Download presentation
Presentation is loading. Please wait.

2
UNIT 12 - METEOROLOGY ES 12 The student will investigate and understand that energy transfer between the sun and Earth and its atmosphere drives weather and climate on Earth. Key concepts include observation and collection of weather data; prediction of weather patterns; severe weather occurrences, such as tornadoes, hurricanes, and major storms; and weather phenomena and the factors that affect climate including radiation, conduction, and convection.

3
Part 1 – Climate and Weather Essential Questions: What are the conditions necessary for cloud formation? How do high and low pressure systems with associated fronts bring about changes in weather? How do latitude, elevation, topography (proximity to mountains), proximity to an ocean, and prevailing winds influence climate? How do uneven heat distribution and the Coriolis Effect influence local and global wind patterns? Essential Understandings: Energy transfer between Earth’s surface and the atmosphere creates the weather. Weather and climate are different. Both weather and climate are measurable and, to a certain extent, predictable. Weather describes day-to-day changes in atmospheric conditions. Climate describes the typical weather patterns for a given location over a period of many years. Instrumentation is used to collect weather and climate data. The four major factors affecting climate are latitude, elevation, proximity to bodies of water, and position relative to mountains. Earth’s major climatic zones are the polar, temperate, and tropical zones. Areas near the equator receive more of the sun’s energy per unit area than areas nearer the poles. Earth’s surface is much more efficiently heated by the sun than is the atmosphere. The amount of energy reaching any given point on Earth’s surface is controlled by the angle of sunlight striking the surface and varies with the seasons. Winds are created by uneven heat distribution at Earth’s surface and modified by the rotation of Earth. The Coriolis Effect causes deflections of the atmosphere due to the rotation of Earth. Global wind patterns result from the uneven heating of Earth by the sun and are influenced by the Coriolis Effect. Convection in the atmosphere is the major cause of weather. Convection is the major mechanism of energy transfer in the oceans, atmosphere, and Earth’s interior. The conditions necessary for cloud formation are air at or below dew point and presence of condensation nuclei. Cloud droplets can join together to form precipitation.
, proximity to an ocean, and prevailing winds influence climate. How do uneven heat distribution and the Coriolis Effect influence local and global wind patterns. Essential Understandings: Energy transfer between Earth’s surface and the atmosphere creates the weather. Weather and climate are different. Both weather and climate are measurable and, to a certain extent, predictable. Weather describes day-to-day changes in atmospheric conditions. Climate describes the typical weather patterns for a given location over a period of many years. Instrumentation is used to collect weather and climate data. The four major factors affecting climate are latitude, elevation, proximity to bodies of water, and position relative to mountains. Earth’s major climatic zones are the polar, temperate, and tropical zones. Areas near the equator receive more of the sun’s energy per unit area than areas nearer the poles. Earth’s surface is much more efficiently heated by the sun than is the atmosphere. The amount of energy reaching any given point on Earth’s surface is controlled by the angle of sunlight striking the surface and varies with the seasons. Winds are created by uneven heat distribution at Earth’s surface and modified by the rotation of Earth. The Coriolis Effect causes deflections of the atmosphere due to the rotation of Earth. Global wind patterns result from the uneven heating of Earth by the sun and are influenced by the Coriolis Effect. Convection in the atmosphere is the major cause of weather. Convection is the major mechanism of energy transfer in the oceans, atmosphere, and Earth’s interior. The conditions necessary for cloud formation are air at or below dew point and presence of condensation nuclei. Cloud droplets can join together to form precipitation..")
4
Meteorology Meteorology -the study of Earth’s atmosphere and the changes within it. Climate - The average temperature and precipitation for an area over a long period of time. Meteorologists use the weather-data averages over 30 years to define and area’s climate. Weather -The daily (short term/day-to-day) changes in the atmosphere for an area. These changes can take place over minutes, hours, days, weeks, months, or years.
 changes in the atmosphere for an area. These changes can take place over minutes, hours, days, weeks, months, or years..")
5
Energy Transfer in the Atmosphere Insolation – incoming solar radiation Sun’s energy is what drives the winds, evaporates water and causes weather changes on Earth. Types of energy transfer Radiation − Energy that travels in the form of waves. o Examples: ultraviolet, infrared, x-rays, gamma rays. Conduction − Energy that transfers between atoms that are touching o A spoon in a mug of hot coffee gets hot on the handle even though it isn’t actually touching the coffee. Convection − Energy that transfers due to the movement of liquids and gases due to differences in temperature. o When air gets heated it expands, becomes less dense and rises. o When air is cooled it contracts, becomes more dense and sinks.

7
4 Factors Affecting Local Climates 1) Proximity (closeness) to oceans Places near large bodies of water tend to have climate with mild winters and summers. This is due to the amount of water vapor in the air. Water takes a long time to heat up and a long time to lose its heat. Being close to the oceans means the air can be very humid (lots of water evaporated). Summer – cooler summers Winter – warmer winters Day – doesn’t get as hot as it could. Night – doesn’t cool down as much. Being far from oceans tends to be drier. Summer – hot summers Winter – cold winters Day – gets really hot really quick. Night – gets cold really quick.
. Summer – cooler summers Winter – warmer winters Day – doesn’t get as hot as it could. Night – doesn’t cool down as much. Being far from oceans tends to be drier. Summer – hot summers Winter – cold winters Day – gets really hot really quick. Night – gets cold really quick..")
9
4 Factors Affecting Local Climates 2) Latitude – degrees N or S of the equator. The closer to the poles – cold, the closer to the equator-hot. This is due to the angle that the Sun’s rays are hitting Earth. Within the tropics (23.5°N & S) the Sun’s rays are hitting most direct (90°) Toward the poles Sun’s rays are hitting at the lowest angle (0°) Zones Equator – Tropics, Poles - Polar, In between – Temperate
 the Sun’s rays are hitting most direct (90°) Toward the poles Sun’s rays are hitting at the lowest angle (0°) Zones Equator – Tropics, Poles - Polar, In between – Temperate.")
12
4 Factors Affecting Local Climates 3) Elevation − As elevation in the troposphere increases, the temperature decreases. − As elevation increases the pressure decreases which allows air to expand which cools the air. This is called adiabatic cooling. As elevation decreases the air pressure increases causing the air to compress which heats the air. No condensation is able to occur if the air is heating.

14
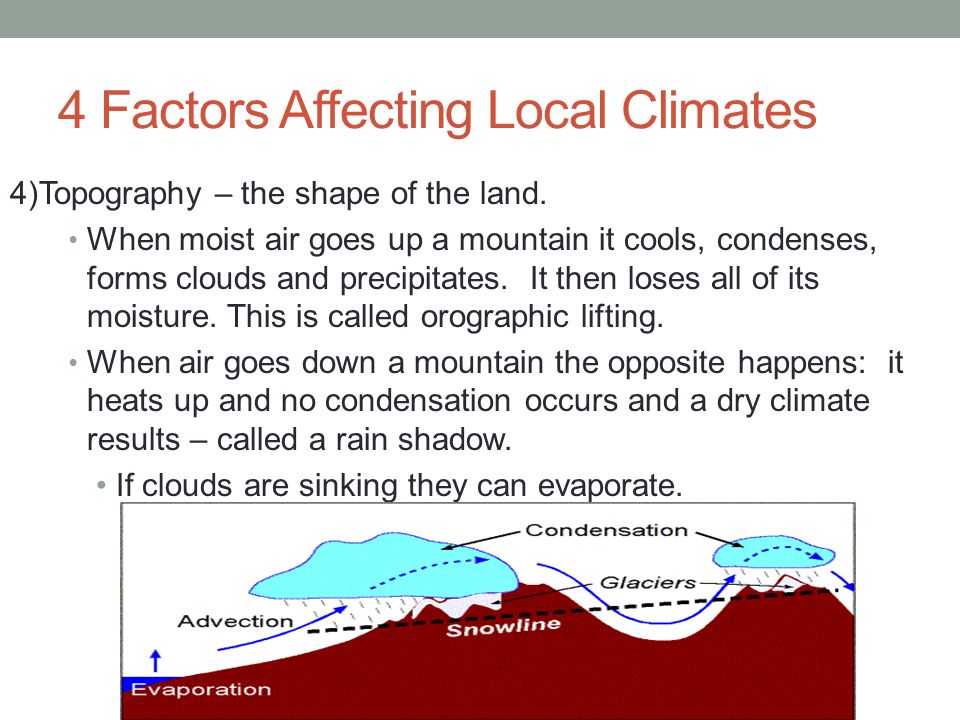
4 Factors Affecting Local Climates 4)Topography – the shape of the land. When moist air goes up a mountain it cools, condenses, forms clouds and precipitates. It then loses all of its moisture. This is called orographic lifting. When air goes down a mountain the opposite happens: it heats up and no condensation occurs and a dry climate results – called a rain shadow. If clouds are sinking they can evaporate.

16
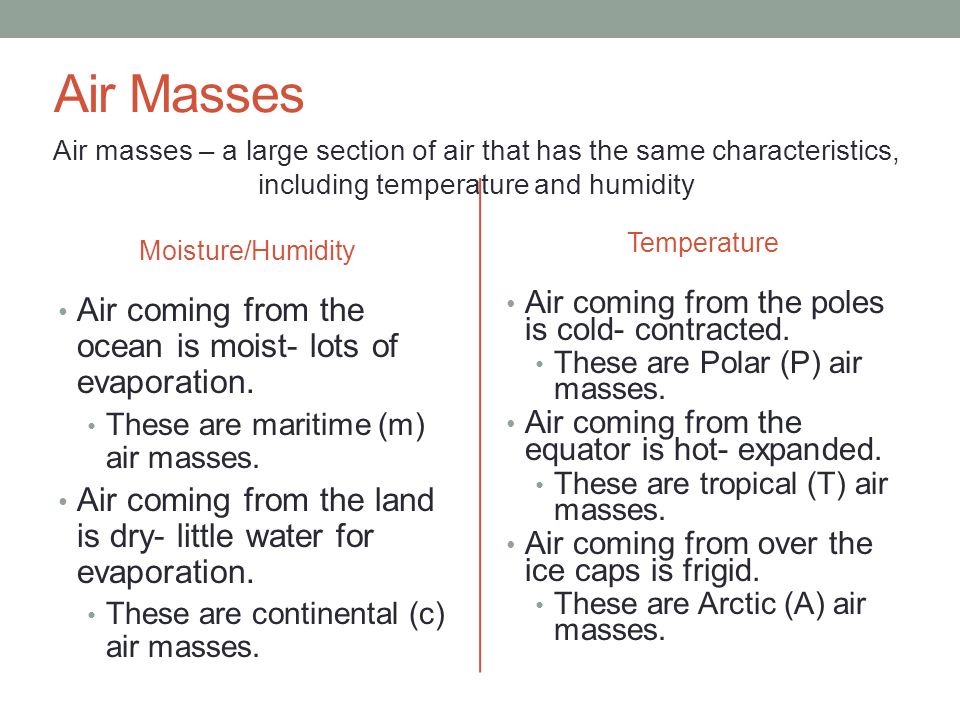
Air Masses Moisture/Humidity Air coming from the ocean is moist- lots of evaporation. These are maritime (m) air masses. Air coming from the land is dry- little water for evaporation. These are continental (c) air masses. Temperature Air coming from the poles is cold- contracted. These are Polar (P) air masses. Air coming from the equator is hot- expanded. These are tropical (T) air masses. Air coming from over the ice caps is frigid. These are Arctic (A) air masses. Air masses – a large section of air that has the same characteristics, including temperature and humidity
 air masses. Air coming from the land is dry- little water for evaporation. These are continental (c) air masses. Temperature Air coming from the poles is cold- contracted. These are Polar (P) air masses. Air coming from the equator is hot- expanded. These are tropical (T) air masses. Air coming from over the ice caps is frigid. These are Arctic (A) air masses. Air masses – a large section of air that has the same characteristics, including temperature and humidity.")
18
Winds Winds are the movement of air from an area of high pressure to low pressure They are named by the DIRECTION THEY COME FROM. Unequal heating of Earth causes air to rise faster in some areas and slower in others. This causes differences in air pressure. Rising air causes low pressure Sinking air causes high pressure

19
Local Wind Patterns Land heats faster because: It is solid and passes the energy by conduction (from touching molecules) Sun only heats the surface of Earth and not beneath. All the energy is concentrated in that thin layer. Water heats slowly because: It moves and transfers the heat. Water is transparent. Sun goes through water and heats a thicker layer than land. Water evaporates and takes heat into the atmosphere and keeps water temperature lower.

20
During the day: Land gets hotter than water and air over it rises faster than over water – low pressure Water stays cooler and air over it sinks – high pressure During the night: Water maintains its warmth and the air rises faster than over land – low pressure Land loses its heat quick and air over it sinks – high pressure Sea Breeze Land Breeze

21
Global Winds Think about Earth having the following conditions: Non-rotating (reality = once every 24 hrs.) Non-tilted on its axis (reality = 23.5°) 100% lit up (reality = 50%) If the above conditions happened Earth’s atmosphere would be: Hottest at the equator Air would rise causing a low pressure on the surface and high in the upper atmosphere. Air would move toward the low pressure area. Coolest at the poles Air would sink causing a high pressure on the surface and a low in the upper atmosphere. Air would move away from the high pressure area.

23
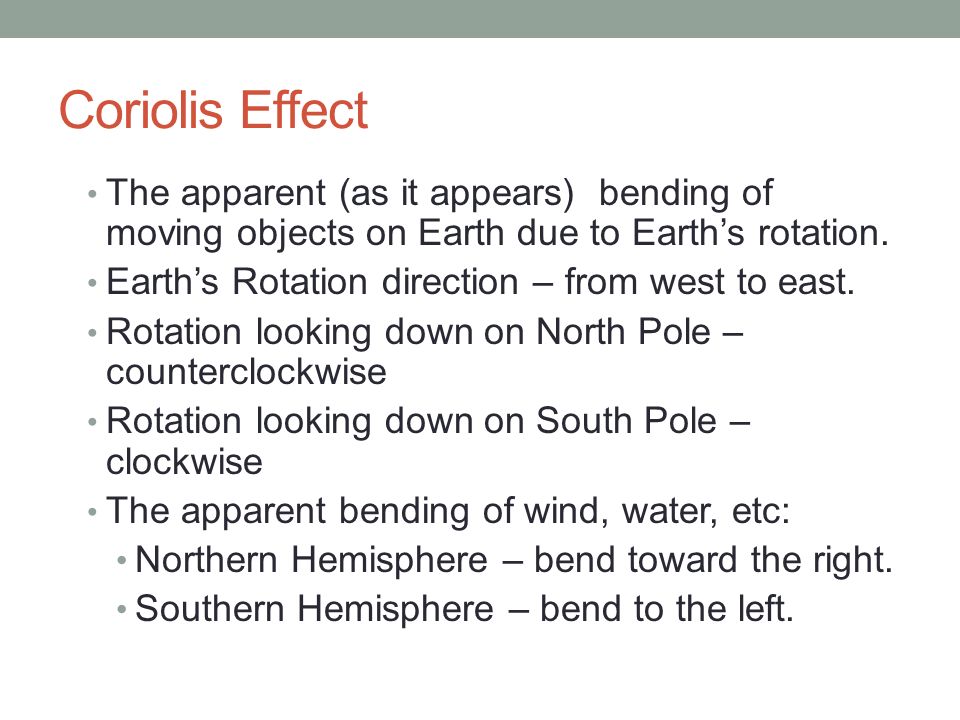
Coriolis Effect The apparent (as it appears) bending of moving objects on Earth due to Earth’s rotation. Earth’s Rotation direction – from west to east. Rotation looking down on North Pole – counterclockwise Rotation looking down on South Pole – clockwise The apparent bending of wind, water, etc: Northern Hemisphere – bend toward the right. Southern Hemisphere – bend to the left.

24
If you launched a missile from the north pole at a target on the equator then: It would travel a straight line a hit the target if Earth were not rotating. Earth is rotating and as it travels toward the target Earth rotates the target westward and it appears that the missile’s path bent right.

26
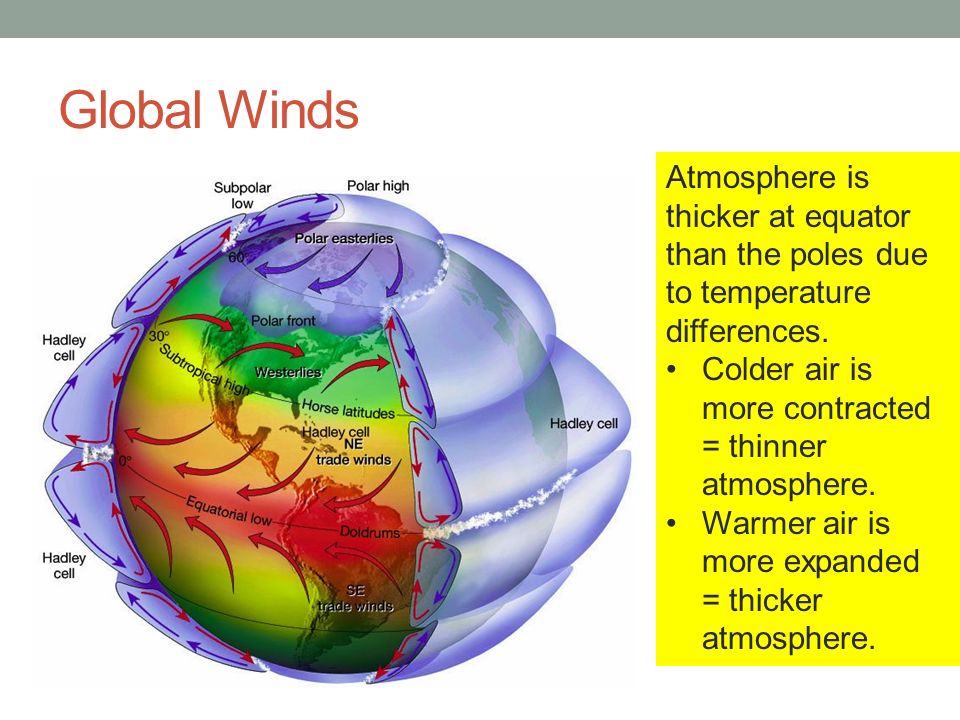
Global Winds Atmosphere is thicker at equator than the poles due to temperature differences. Colder air is more contracted = thinner atmosphere. Warmer air is more expanded = thicker atmosphere.

27
Global Winds - Wind Belts Wind Belts occur because certain latitudes have certain pressures: 0° - Intertropical Convergence Zone (ITCZ) or Doldrums– Low 30°N & S- Horse Latitudes – High 60°N & S – Subpolar Lows – Low 90°N & S – Polar Highs The winds blow from high pressure to low pressure. The wind belts are between these pressure areas. They shift north during our summer and south during our winter. Remember, the southern hemisphere (bottom ½ of Earth) has opposite seasons as us.
 has opposite seasons as us..")
28
Wind Belts Between 0° and 30°N & S Trade Winds Between 30°N & S and 60°N & S Prevailing westerlies Between 60°N & S and 90°N & S Polar Easterlies WINDS ARE NAMED BY THE DIRECTION THEY COME FROM!!!!!

30
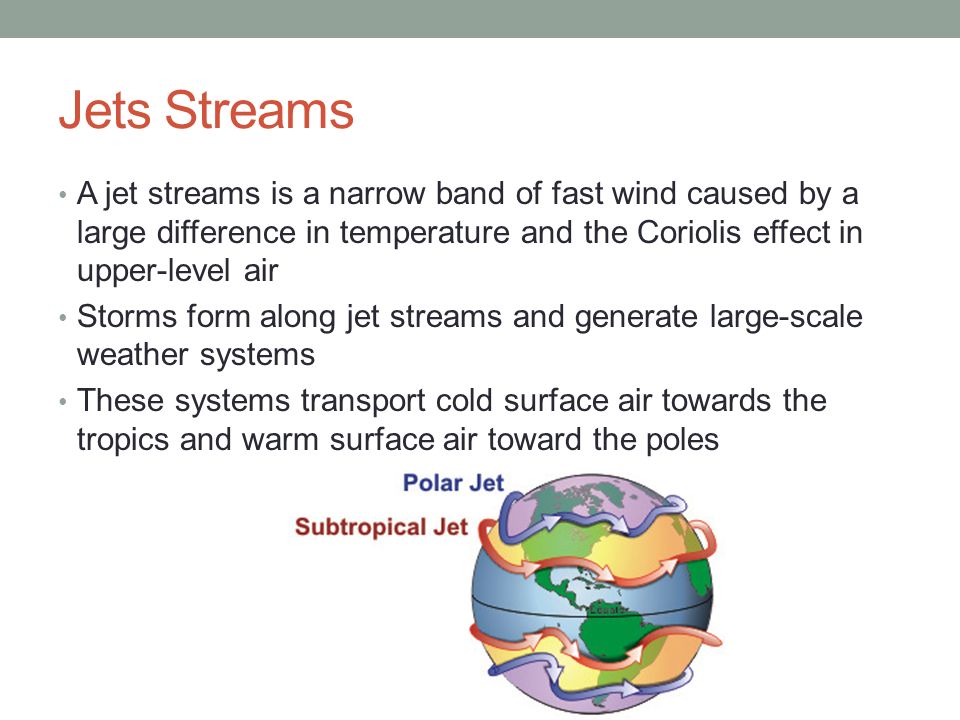
Jets Streams A jet streams is a narrow band of fast wind caused by a large difference in temperature and the Coriolis effect in upper-level air Storms form along jet streams and generate large-scale weather systems These systems transport cold surface air towards the tropics and warm surface air toward the poles

31
Weather Fronts Air masses with different characteristics can collide and result in dramatic weather changes. A collision of two air masses is called a front. A front is a narrow region between two air masses of different densities (temperature, pressure, humidity) Warm front Cold front Stationary front Occluded front
 Warm front Cold front Stationary front Occluded front.")
32
Warm Front A warm front is the surface boundary between a warm air mass and a cold air mass it is overtaking. The air masses do not readily mix; therefore the warm air rises slowly over the colder air because it is less dense. This produces clouds and precipitation well ahead of the approaching warm front. Steady precipitation usually persists along the boundary of a warm front.

33
Warm Front Weather Phenomenon Prior to the Passing of the Front Contact with the Front After the Passing of the Front TemperatureCoolWarming suddenly Warmer then leveling off Atmospheric Pressure Decreasing steadilyLeveling off Slight rise followed by a decrease WindsSouth to southeastVariableSouth to southwest Precipitation Showers, snow, sleet or drizzle Light drizzleNone

34
Cold Front A cold front separates a cold, dry air mass from a warm air mass. The cold air mass pushes under the warm air mass because of its higher density, forcing this warm air to rise. If enough moisture exists in the atmosphere at this time, then clouds and possibly thunderstorms could develop. Cold fronts move much faster than warm fronts.

35
Cold Front Weather Phenomenon Prior to the Passing of the Front Contact with the Front After the Passing of the Front TemperatureWarmCooling suddenlyCold and getting colder Atmospheric Pressure Decreasing steadily Leveling off then increasing Increasing steadily WindsSouth to southeastVariable and gustyWest to northwest PrecipitationShowers Heavy rain or snow, hail sometimes Showers then clearing Clouds Cirrus and cirrostratus changing later to cumulus and cumulonimbus Cumulus and cumulonimbus Cumulus

36
Occluded Front Occluded fronts are produced when a fast moving cold front catches and overtakes a slower moving warm front.

37
Stationary Front A stationary front is the boundary between two different air masses with different densities when neither is advancing. The air masses are not moving strongly enough to overtake each other, so the front remains in one place.

38
Air pressure is the force exerted on you by the weight of tiny particles of air (air molecules). When it's compressed, air is said to be "under high pressure". Weather forecasters measure air pressure with a barometer. Barometers are used to measure the current air pressure at a particular location in "inches of mercury" or in "millibars" (mb). A measurement of 29.92 inches of mercury is equivalent to 1013.25 millibars.
. A measurement of inches of mercury is equivalent to millibars..")
39
Pressure Systems High Pressure A high pressure system is a whirling mass of cool, dry air that generally brings fair weather and light winds. When viewed from above, winds spiral out of a high- pressure center in a clockwise rotation in the Northern Hemisphere. These bring sunny skies. A high pressure system is represented as a big, blue H. Low Pressure A low pressure system is a whirling mass of warm, moist air that generally brings stormy weather with strong winds. When viewed from above, winds spiral into a low-pressure center in a counterclockwise rotation in the Northern Hemisphere. A low pressure system is represented as a big, red L.

40
Clouds and Precipitation A cloud is a large collection of very tiny droplets of water or ice crystals. The droplets are so small and light that they can float in the air. How do they form? All air contains water, but near the ground it is usually in the form of an invisible gas called water vapor. When warm air rises, it expands and cools. Cool air can't hold as much water vapor as warm air, so some of the vapor condenses onto condensation nuclei that are floating in the air. When billions of these droplets come together they become a visible cloud. A condensation nucleus is a small particle in the atmosphere around which water droplets form. These particles can include ice, salt, dust, and other materials.

41
Types of Clouds Low Clouds Cumulus clouds Low level, puffy, flat-bottomed, fair weather clouds. These form late in the day when moist air is heated at the surface, rises, and then condenses Stratus clouds Layered or sheet-like cloud covering much of the sky Middle Clouds – prefix of alto Altocumulus and altostratus Made up of tiny ice crystals due to cold temperatures Can sometimes produce mild precipitation High clouds – prefix cirro Cirrus clouds Wispy, high altitude clouds made of ice. May be a warning cloud for approaching warm front. These do not precipitate.

42
Types of Clouds Nimbus clouds are clouds that produce precipitation Two types: nimbostratus (warm front), cumulonimbus (cold front). If the air that makes up a cumulus cloud is unstable, the cloud will be warmer than the surrounding air and will grow upward The cloud can grow into the middle altitudes as a cumulonimbus cloud What begins as a small mass of unstable, moist air can become an atmospheric giant capable of producing torrential rains, strong winds, and hail during thunderstorms.

43
Types of Clouds

44
Type of Precipitation The type of precipitation that reaches Earth depends on the vertical variation of temperature in the atmosphere Sleet – ice pellets that fall to the ground Hail – large ice pellets caused by an strong up and down motion in a cloud Snow – ice crystals that fall to the ground Rain – liquid water that falls to the ground

45
Water is present as a liquid and as a gas in the atmosphere. When water is a gas, it is called water vapor. The amount of water vapor in the air is called humidity. The amount of water vapor the air can hold depends on the temperature of the air. Warm air can hold more water vapor, while cold air cannot hold as much. Moisture in the Air – Humidity

46
Relative humidity tells us how much water vapor is in the air, compared to how much it could hold at that temperature. It is shown as a percent. For example, a relative humidity of 50 percent means the air is holding one half of the water vapor it can hold. The higher the relative humidity is the more likely it is that precipitation will fall. Dew point - The dew point is the temperature at which water starts to condense out of a particular air mass. The dew point temperature changes only when the moisture content of the air changes. The higher the dew point, the greater the moisture content is in the air.

47
Moisture in the Air – Humidity Relative humidity is measured using a psychrometer. The psychrometer compares the dry and wet bulb temperatures. The wet bulb is cooled by evaporation. The drier the air the cooler the wet bulb.

48
Reasons for the Seasons 23 ½ ° tilt of Earth’s axis As Earth revolves around sun the sun’s direct rays hit at 90° only with in the tropics. As we revolve around Sun those 90° rays migrate north during our summer and south during our winter. 365 ¼ day revolution period Our seasons last as long as they do because of the length of our revolution around Sun. on Mars the seasons are 2 ½ times longer than ours- it takes Mars 2 ½ years to orbit Sun.

49
Summer Solstice Longer days, shorter nights 90° in northern hemisphere. Winter Solstice Shorter days, longer nights 90° in southern hemisphere. Spring/Fall Equinox Equal day and night 90° at equator.

50
Part 2 – Severe Weather Occurrences Essential Questions: How is the cyclonic motion seen in storms associated with severe weather? Essential Understandings: A tornado is a narrow, violent funnel-shaped column of spiral winds that extends downward from the cloud base toward Earth. A hurricane is a tropical cyclone (counterclockwise movement of air) characterized by sustained winds of 120 kilometers per hour (75 miles per hour) or greater.
 characterized by sustained winds of 120 kilometers per hour (75 miles per hour) or greater..")
51
Thunderstorms The conditions that form cumulonimbus clouds are the same conditions that produce thunderstorms. Three conditions must exist: A source of moisture Lifting air masses Unstable atmosphere

52
Tornadoes A rotating column of air that forms when very dry, cold air meets very moist, hot air. (Cold Front) These spawn out of cumulonimbus clouds Winds can reach up to 300mph.
 These spawn out of cumulonimbus clouds Winds can reach up to 300mph..")
53
Tornadoes Common locations: – Tornado Alley Texas, Oklahoma, Kansas, Missouri Measuring scale – Fujita Scale Strongest – F5, Weakest F1

54
Hurricanes Also known as tropical storms or cyclones. These occur within the tropics and start out as thunderstorms. Recipe for hurricane 1. Warm, moist air – form over ocean at least 80°F 2. Water vapor rises and a column of low pressure develops at the center 3. As the pressure in the center decreases the speed of the wind around the center increases.

55
The ones that effect us originate off the coast of Africa Extremely low pressures ( lowest air pressure ever recorded) The center is clear, and calm – eye of the storm. Outside the eye are bands of cumulonimbus clouds – eye wall. Hurricanes

56
These travel in the same manner as wind. Northern Hemisphere – Path bends to the right and rotates counterclockwise Southern Hemisphere – Path bends to the left and rotates clockwise Classified according to categories Called a tropical storm before it becomes a Category 1 The biggest danger is the storm surge Winds blowing toward the center, plus the lower pressure cause water to pile up toward the center. Water levels could be 10 – 20 ft higher than normal. Watches – conditions are likely for it to happen. Warning – it is happening and likely to come your way.

57
Anticyclone Air wants to move straight away from the high pressure center. Earth’s rotation causes it to appear to bend right in the northern hemisphere. The net effect is a clockwise rotation of the air around the high pressure. (Opposite for the southern hemisphere)
.")
58
Cyclone Air wants to move straight toward the low pressure center. Earth’s rotation makes it to appear to bend right in the northern hemisphere. The low pressure gradient pulls it back in toward the middle. The net effect is a counterclockwise rotation of the air around the low pressure. (Opposite for the southern hemisphere)
.")
59
Part 3 – Instruments and Forecasting Essential Questions: What are various weather instruments and how can they used in weather prediction?

60
Weather Instruments Common weather instruments include: Thermometer - temperature Anemometer - Wind speed Wind vane - Wind direction Barometer - Air pressure Psychrometer - Relative humidity Rain gauge – amount of rain

61
Pressure Systems Blue H = high-pressure center Red L = low-pressure center Grey lines = isobars that show lines of connecting pressure Reading Weather Maps Fronts (symbols point in the direction the front is moving) Red half circles = warm front Blue triangles = cold front Purple half circles and triangles = occluded front Red half circles and blue triangles = stationary front Weather systems move from the west to the east in the United States.
 Red half circles = warm front Blue triangles = cold front Purple half circles and triangles = occluded front Red half circles and blue triangles = stationary front Weather systems move from the west to the east in the United States.")
62
Doppler Radar Doppler Radar detects precipitation intensity, wind direction and speed, and provides estimates of hail size and rainfall amounts. Doppler Radar gives forecasters the capability of providing early detection of severe thunderstorms that may bring strong damaging winds, large hail, heavy rain, and possibly tornadoes. Doppler Radar gets its name from the Doppler Effect You probably noticed that the pitch of the siren changed as the fire truck passed you and moved away. This change in the frequency of sound is called the Doppler Effect. Doppler Radar measures the changes in the frequency of the signal it receives to determine the wind.

63
Forecasting Meteorologists study weather. To plot data nationwide, meteorologists use lines that connect points of equal or constant values Isotherms are lines connecting points of equal temperature. Isobars are lines connecting points of equal pressure. The lines themselves are similar to contour lines of topographic maps Station models are a combination of symbols used to show current weather conditions. A station model allows meteorologists to fit a large amount of data into a small space

64
Weather maps are created using data gathered from different weather stations.

65
HOW IS WEATHER SHOWN ON A WEATHER MAP? Present weather MistFogThunderDrizzleRain Snow Hail Shower The shower symbol can be combined with others…. Rain shower Hail shower Snow shower Heavy rain Heavy snow Drizzle Present weather is shown by the symbol at the bottom left of the circle Temperature is shown at the top left of the circle

66
HOW IS WEATHER SHOWN ON A WEATHER MAP? Wind direction and wind speed Wind direction is shown by a line leading into the station circle. This symbol shows that the wind blew into the station circle from the east A circle round the station shows that there was no wind : calm The speed is shown by a series of “feathers” 10 knots 20 knots 30 knots 35 knots 50knots

67
HOW IS WEATHER SHOWN ON A WEATHER MAP? Cloud cover is shown by the amount of shading inside the station circle.

68
Remember!

Similar presentations