Download presentation
Presentation is loading. Please wait.

1
www.scotland.gov.uk/simd Scottish Index of Multiple Deprivation (SIMD) The index, the results and where next Our Dynamic Earth, Edinburgh 6 th November 2007 Matt Perkins Office of the Chief Statistician, The Scottish Government
 The index, the results and where next Our Dynamic Earth, Edinburgh 6 th November 2007 Matt Perkins Office of the Chief Statistician, The Scottish Government")
2
www.scotland.gov.uk/simd Outline The Index –Background –Methodology –Use of the SIMD The Results –15% Most Deprived –Local Authority Where next

3
www.scotland.gov.uk/simd The Index

4
www.scotland.gov.uk/simd What is the SIMD? The Scottish Index of Multiple Deprivation identifies small area concentrations of multiple deprivation across all of Scotland The Index allows effective targeting of policies and funding where the aim is to wholly or partly tackle or take account of area concentrations of multiple deprivation

5
www.scotland.gov.uk/simd The history 2002 –SE commissioned work from SDRC 2003 –SE publish SIMD 2003 (ward level) 2004 –Data zones produced by St Andrews University –SE publish SIMD 2004 (data zone level) 2006 –SE publish SIMD 2006 (data zone level)
 2004 –Data zones produced by St Andrews University –SE publish SIMD 2004 (data zone level) 2006 –SE publish SIMD 2006 (data zone level)")
6
www.scotland.gov.uk/simd SIMD 2003 Similar methodology used across UK 5 domains –Income Deprivation (30%) –Employment Deprivation (30%) –Health Deprivation and Disability (15%) –Education, Skills and Training Deprivation (15%) –Geographical Access to Services (10%) Other domains excluded due to data availability Ward sizes and boundary issues
 –Employment Deprivation (30%) –Health Deprivation and Disability (15%) –Education, Skills and Training Deprivation (15%) –Geographical Access to Services (10%) Other domains excluded due to data availability Ward sizes and boundary issues")
7
www.scotland.gov.uk/simd Data zones and Population Geographical unit built up from 2001 census output areas Fixed boundaries Median population size = 769 6,505 data zones in Scotland SIMD 2004 used Census 2001 SIMD 2006 used 2004 Small Area Population Estimates (Source: GROS) Ongoing monitoring of SAPEs
 Ongoing monitoring of SAPEs")
8
www.scotland.gov.uk/simd Data zones: rural and urban

9
www.scotland.gov.uk/simd SIMD (data zone level) -Background Administrative data sources Combines individual indicators into ‘domains’ and overall index rank Rank 1 = most deprived, 6,505 = least deprived The most deprived 976 areas are the 15% most deprived in Scotland and these tend to be the focus of policies and funding
 -Background Administrative data sources Combines individual indicators into ‘domains’ and overall index rank Rank 1 = most deprived, 6,505 = least deprived The most deprived 976 areas are the 15% most deprived in Scotland and these tend to be the focus of policies and funding")
10
www.scotland.gov.uk/simd SIMD 2004 6 Domains, 31 indicators –Income –Employment –Health –Education –Housing –Access to Services 2001 and 2002 Census & administrative data

11
www.scotland.gov.uk/simd SIMD update: 2006 Update to SIMD 2004 Improvements to methodology and data sources –Changes to tax credit system –New public transport data –New crime domain using 2004 crime data 7 subject areas / ‘domains’: 37 indicators Shows relative changes between SIMD 2004 and 2006

12
www.scotland.gov.uk/simd

13
Income Deprivation Domain Not measuring income Based on benefits data –Income support adults and children –Guarantee Pension Credit adults –Job Seekers Allowance adults and children 2004 used WFTC and DTC data Data zone SAPE –Total population

14
www.scotland.gov.uk/simd Employment Deprivation Domain No change to 2004 indicators Based on benefits data –Unemployment Claimant Count 12 month average –Incapacity Benefit recipients Working age –Severe Disablement Allowance Working age –Compulsory New Deal Participants Data zone SAPE –Working age population

15
www.scotland.gov.uk/simd Crime Domain Data published for the first time Relevant to Neighbourhood Deprivation ‘SIMD crime’ not ‘Total Crime’ –Crimes of violence –Drug Offences –Domestic Housebreaking –Minor Assault –Vandalism Does not include crimes in/near police station Total populations – rate per 10,000

16
www.scotland.gov.uk/simd Housing Deprivation Domain Census data –No change since SIMD 2004 –Persons in households which are overcrowded –Persons in households without central heating Data zone SAPE –Total population

17
www.scotland.gov.uk/simd Health Deprivation Domain Indicators used: –Standardised Mortality Ratio –Hospital Episodes related to alcohol use –Hospital Episodes related to drug use –Comparative Illness Factor –Emergency Admissions to Hospital –Proportion of population being prescribed drugs for anxiety, depression or psychosis –Proportion of live singleton births of low birth weight Methodological changes since 2004 Combined using factor analysis

18
www.scotland.gov.uk/simd Education Deprivation Domain Indicators –School pupil absences –Pupil Performance on SQA at Stage 4 –Working age people with no qualifications –17-21 year olds enrolling into HE –People ages 16-18 not in full time education Changes to 3 indicators Populations relevant to indicator Combined using factor analysis

19
www.scotland.gov.uk/simd Access to Services Domain Drive Times –GP –Shopping facilities (Supermarket in 2004) –Petrol Station –Primary and Secondary Schools (Primary only in 2004) –Post Office Public Transport (Not included in SIMD 2004) –GP –Shopping Facilities –Post Office Population weighted based on COAs Factor analysis within sub-domains
 –Petrol Station –Primary and Secondary Schools (Primary only in 2004) –Post Office Public Transport (Not included in SIMD 2004) –GP –Shopping Facilities –Post Office Population weighted based on COAs Factor analysis within sub-domains")
20
www.scotland.gov.uk/simd Domains and Weightings 20042006 Domainsweight % of overall weightDomainsweight % of overall weight Current Income629Current Income1228 Employment629Employment1228 Health314Health614 Education, Skills and training314 Education, Skills and training614 Geographic Access and Telecommunications 210Geographic Access:49 ~ Drive times 0.75 ~ Public transport times 0.25 Housing15 12 - --Crime25

21
www.scotland.gov.uk/simd The index does … ….pick out area concentrations of multiple deprivation ….provide a ‘scale’ of deprivation See SIMD 2006 Guidance Leaflet for advice on appropriate use of the index The index does not… ….describe how much more deprived one area is than another ….make absolute comparisons over time, BUT individual indicators and the employment domain can be used ….measure affluence – least deprived areas are not necessarily ‘rich’ areas ….pick out deprived individuals - Not all deprived people live in the most deprived areas, and not all those living in deprived areas are deprived ….answer all deprivation questions

22
www.scotland.gov.uk/simd Uses of the SIMD Raise profile & understanding of multiple deprivation across TSG, agencies, LAs & public Inform & influence policies which tackle or take account of concentrations of multiple deprivation - CtOG community regeneration target - Regeneration Outcome Agreements and the CRF - Linking opportunity and need - Health - anticipatory care Funding allocations –Community Regeneration Fund –Housing investment –Local gov. GAE (mostly income domain) Public sector use: SHEFC, Academia and Research, School Projects, Many others…
 Public sector use: SHEFC, Academia and Research, School Projects, Many others….")
23
www.scotland.gov.uk/simd The Results

24
www.scotland.gov.uk/simd SIMD 2006 Results – National Share* Local authority areas with the largest national share of the 15% most deprived in SIMD 2006 are –Glasgow City (34 per cent) –North Lanarkshire (9 per cent) –Edinburgh, City of (6 per cent) –South Lanarkshire (6 per cent) –Dundee City (5 per cent) –Fife (5 per cent) Eilean Siar, Moray, Orkney Islands and Shetland Islands do not have any data zones in the SIMD 2006 15% most deprived *The national share is the proportion data zones in the 15% most deprived for each Local Authority
 –North Lanarkshire (9 per cent) –Edinburgh, City of (6 per cent) –South Lanarkshire (6 per cent) –Dundee City (5 per cent) –Fife (5 per cent) Eilean Siar, Moray, Orkney Islands and Shetland Islands do not have any data zones in the SIMD % most deprived *The national share is the proportion data zones in the 15% most deprived for each Local Authority")
25
www.scotland.gov.uk/simd SIMD 2006 – National Share (part 1) SIMD 2004SIMD 2006 Data Zones in LA Data zones in 15% MD % National share Data zones in 15% MD % National share Glasgow City69437438.3%33033.8% North Lanarkshire41810310.6%848.6% Edinburgh, City of549616.3%636.5% South Lanarkshire398666.8%565.7% Dundee City179515.2%535.4% Fife453343.5%474.8% Inverclyde110363.7%424.3% Renfrewshire214414.2%363.7% North Ayrshire179333.4%333.4% West Dunbartonshire118323.3%333.4% East Ayrshire154282.9%282.9% *The national share is the proportion data zones in the 15% most deprived for each Local Authority
 SIMD 2004SIMD 2006 Data Zones in LA Data zones in 15% MD % National share Data zones in 15% MD % National share Glasgow City % % North Lanarkshire %848.6% Edinburgh, City of %636.5% South Lanarkshire %565.7% Dundee City %535.4% Fife %474.8% Inverclyde %424.3% Renfrewshire %363.7% North Ayrshire %333.4% West Dunbartonshire %333.4% East Ayrshire %282.9% *The national share is the proportion data zones in the 15% most deprived for each Local Authority")
26
www.scotland.gov.uk/simd National Share of deprived data zones by LA The national share is the local authority’s share of the 15% most deprived data zones in Scotland

27
www.scotland.gov.uk/simd SIMD 2006 Results – Local Share* Local authority areas with the largest local share of the 15% most deprived in SIMD 2006 are –Glasgow City (48 per cent) –Inverclyde (38 per cent) –Dundee City (30 per cent) –West Dunbartonshire (28 per cent) –Clackmannanshire (23 per cent) –North Lanarkshire (20 per cent) Eilean Siar, Moray, Orkney Islands and Shetland Islands do not have any data zones in the SIMD 2006 15% most deprived * The local share is the proportion of data zones in a local authority area that are in the 15% most deprived
 –Inverclyde (38 per cent) –Dundee City (30 per cent) –West Dunbartonshire (28 per cent) –Clackmannanshire (23 per cent) –North Lanarkshire (20 per cent) Eilean Siar, Moray, Orkney Islands and Shetland Islands do not have any data zones in the SIMD % most deprived * The local share is the proportion of data zones in a local authority area that are in the 15% most deprived")
28
www.scotland.gov.uk/simd Local authority areas with more than 15 per cent local share of data zones in the 15% most deprived in the overall SIMD 2006 Local Authority Number of data zones in LA 15% most deprived data zones SIMD 2004SIMD 2006 No of data zones Local share (%) No of data zones Local share (%) Glasgow City69437453.933047.6 Inverclyde1103632.74238.2 Dundee City1795128.55329.6 West Dunbartonshire1183227.13328.0 Clackmannanshire641015.61523.4 North Lanarkshire41810324.68420.1 East Ayrshire1542818.22818.2 North Ayrshire1793318.43318.4 Renfrewshire2144119.23616.8 The local share is the proportion of data zones in a local authority area that are in the 15% most deprived in Scotland
 No of data zones Local share (%) Glasgow City Inverclyde Dundee City West Dunbartonshire Clackmannanshire North Lanarkshire East Ayrshire North Ayrshire Renfrewshire The local share is the proportion of data zones in a local authority area that are in the 15% most deprived in Scotland")
29
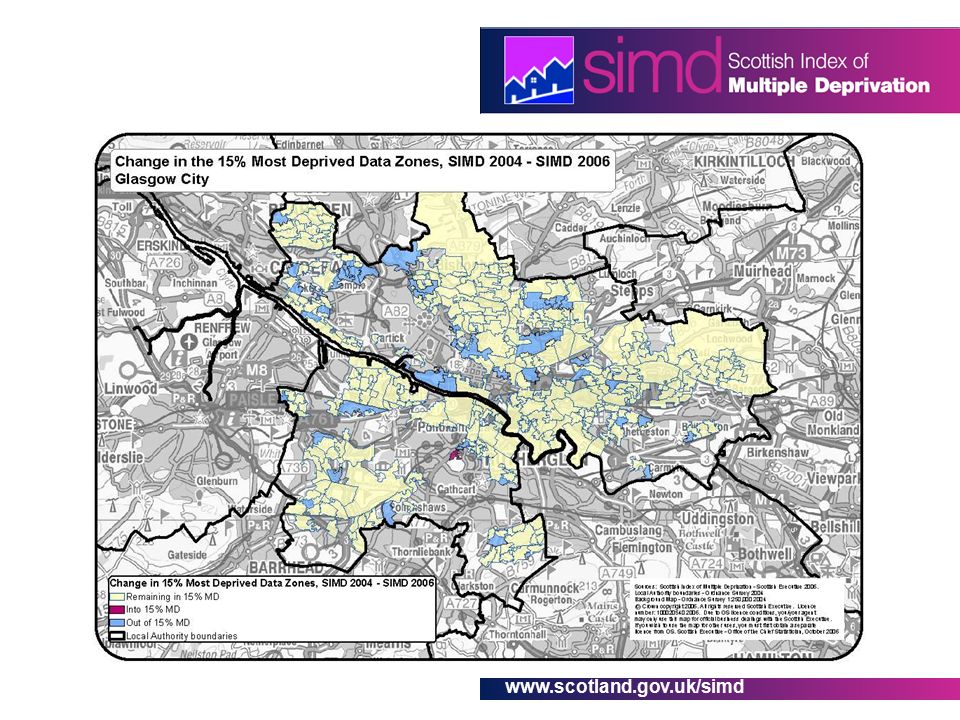
www.scotland.gov.uk/simd 15% most deprived data zones: change between SIMD 2004 and SIMD 2006 Of the 976 data zones in the 15% most deprived in SIMD 2004: –856 (88%) remained in the 15% most deprived areas in the SIMD 2006 –120 new data zones moved in and 120 moved out of the 15% most deprived areas Of the 120 data zones moving in to the 15% most deprived areas in the SIMD 2006: –Over 80 are ranked in the 15% most deprived for three or more SIMD 2006 domains and 89 (74%) were in the 15% to 20% in the SIMD 2004 Of the 120 data zones moving out of the 15% most deprived in SIMD 2004: –The proportion of working age population employment deprived decreased in 113 (94%) of the 120 data zones –94 (78%) moved to 15 - 20% and 112 (93%) moved to 15 - 25%
 remained in the 15% most deprived areas in the SIMD 2006 –120 new data zones moved in and 120 moved out of the 15% most deprived areas Of the 120 data zones moving in to the 15% most deprived areas in the SIMD 2006: –Over 80 are ranked in the 15% most deprived for three or more SIMD 2006 domains and 89 (74%) were in the 15% to 20% in the SIMD 2004 Of the 120 data zones moving out of the 15% most deprived in SIMD 2004: –The proportion of working age population employment deprived decreased in 113 (94%) of the 120 data zones –94 (78%) moved to % and 112 (93%) moved to %")
30
www.scotland.gov.uk/simd
33
Distribution of employment deprived* population *Claiming Incapacity Benefit or Severe Disablement Allowance or on unemployment claimant count or New Deal participants. Not ‘worklessness’ and not ‘unemployed’

34
www.scotland.gov.uk/simd What was published Hardcopy and online general report with initial analysis Online technical report Hardcopy and online guidance leaflet An online interactive mapping website An online Statistical Compendium of tables, charts and maps Online background data for SIMD 2006

35
www.scotland.gov.uk/simd Website: overview

36
www.scotland.gov.uk/simd Interactive mapping

37
www.scotland.gov.uk/simd Interactive mapping

38
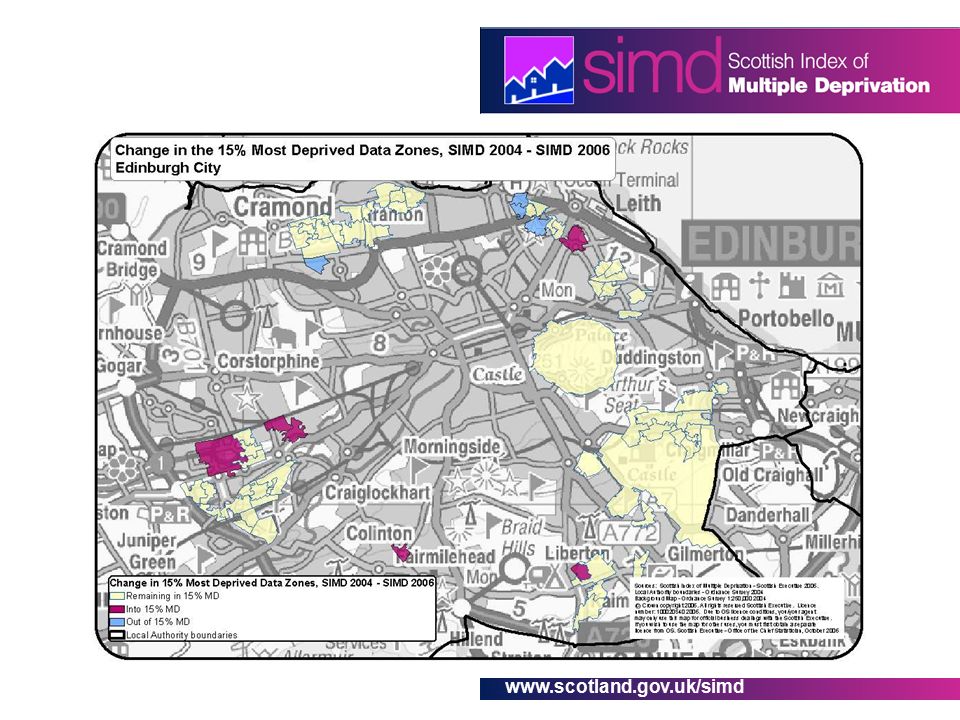
www.scotland.gov.uk/simd 15% most deprived data zones in Edinburgh

39
www.scotland.gov.uk/simd SIMD 2006 – Overall rank

40
www.scotland.gov.uk/simd SIMD 2006 – Income rank

41
www.scotland.gov.uk/simd SIMD 2006 – Employment rank

42
www.scotland.gov.uk/simd SIMD 2006 – Health rank

43
www.scotland.gov.uk/simd SIMD 2006 – Education rank

44
www.scotland.gov.uk/simd SIMD 2006 – Housing rank

45
www.scotland.gov.uk/simd SIMD 2006 – Access rank

46
www.scotland.gov.uk/simd SIMD 2006 – Crime rank

47
www.scotland.gov.uk/simd Where next

48
www.scotland.gov.uk/simd The future SIMD 2006 –Analysis of results Social Focus on Deprived Areas –Continuing to promote index –Ensuring correct use of index –Assisting users SIMD 2009 –Update on SIMD 2006 –2007/2008 data –Housing data –Crime data

49
www.scotland.gov.uk/simd ANY QUESTIONS? Contacts: Neighbourhood Statistics (SNS & SIMD) Tel: 0131 244 0442 neighbourhoodstatistics@scotland.gov.uk Matt Perkins Tel: 0131 244 0443 matt.perkins@scotland.gsi.gov.uk
 Tel: Matt Perkins Tel:")
50
www.scotland.gov.uk/simd SIMD 2004SIMD 2006 Data Zones in LA Data zones in 15% MD % National share Data zones in 15% MD % National share Aberdeen City267181.8%272.8% Falkirk197141.4%191.9% Highland29290.9%171.7% Clackmannanshire64101.0%151.5% West Lothian21190.9%141.4% South Ayrshire147131.3%131.3% Dumfries & Galloway19390.9%111.1% Argyll & Bute12290.9%101.0% Perth & Kinross17530.3%90.9% Angus14230.3%80.8% Stirling11060.6%70.7% SIMD 2006 – National Share (part 2)
")
51
www.scotland.gov.uk/simd SIMD 2004SIMD 2006 Data Zones in LA Data zones in 15% MD % National share Data zones in 15% MD % National share Aberdeenshire30120.2%60.6% Midlothian11210.1%50.5% East Renfrewshire12050.5%30.3% East Dunbartonshire12740.4%30.3% Scottish Borders13020.2%30.3% East Lothian12000.0%10.1% Eilean Siar3600.0%0 Moray11600.0%0 Orkney Islands2700.0%0 Shetland Islands3000.0%0 SIMD 2006 – National Share (part 3)
")
52
www.scotland.gov.uk/simd Local Authorities with between 5 and 15% local share of data zones in the 15% most deprived in the overall SIMD 2006 Local Authority Number of data zones in LA 15% most deprived data zones SIMD 2004SIMD 2006 No of data zonesLocal share (%)No of data zonesLocal share (%) South Lanarkshire3986616.65614.1 Edinburgh, City of5496111.16311.5 Fife453347.54710.4 Aberdeen City267186.72710.1 Falkirk197147.1199.6 West Lothian21194.3146.6 South Ayrshire147138.8138.8 Argyll & Bute12297.4108.2 Stirling11065.576.4 Dumfries & Galloway19394.7115.7 Highland29293.1175.8 Angus14232.185.6 Perth & Kinross17531.795.1
No of data zonesLocal share (%) South Lanarkshire Edinburgh, City of Fife Aberdeen City Falkirk West Lothian South Ayrshire Argyll & Bute Stirling Dumfries & Galloway Highland Angus Perth & Kinross")
53
www.scotland.gov.uk/simd Local authorities with less than 5% local share of data zones in the 15% most deprived in the overall SIMD 2006 Local Authority Number of data zones in LA 15% most deprived data zones SIMD 2004SIMD 2006 No of data zones Local share (%) No of data zones Local share (%) Midlothian11210.954.5 East Renfrewshire12054.232.5 East Dunbartonshire12743.132.4 Scottish Borders13021.532.3 Aberdeenshire30120.762.0 East Lothian12000.010.8 Moray11600.00 Eilean Siar3600.00 Orkney Islands2700.00 Shetland Islands3000.00
 No of data zones Local share (%) Midlothian East Renfrewshire East Dunbartonshire Scottish Borders Aberdeenshire East Lothian Moray Eilean Siar Orkney Islands Shetland Islands")
Similar presentations


 2009 Dumfries & Galloway Andrew White Office of the Chief Statistician 05 th February.>")


 2004 TRACEY STEAD OFFICE OF THE CHIEF STATISTICIAN SCOTTISH EXECUTIVE.>")

 2009 Inverclyde Council Niamh Laffan Office of the Chief Statistician Scottish Government.>")

 2009 East Ayrshire Andrew White Office of the Chief Statistician 16 th February.>")


 ScotPHO training course – day 4 Andrew White Office of the Chief Statistician, Scottish.>")