Download presentation
Presentation is loading. Please wait.

1
Population Change in The United States, Texas and the Houston Area: Implications for the Socioeconomic Future Population Change in The United States, Texas and the Houston Area: Implications for the Socioeconomic Future Steve Murdock Hobby Center for the Study of Texas Allyn and Gladys Cline Professor of Sociology Rice University Presentation to: Memorial Drive Presbyterian 55+ Houston, Texas September 14, 2015

2
Total Population and Percent Population Change in Texas and the United States, 1850-2010 Total Population Percent Change YearTexasU.S. TexasU.S. 1850 212,592 23,191,876--- 1860 604,215 31,443,321184.235.6 1870 818,579 39,818,44935.526.6 1880 1,591,749 50,155,78394.526.0 1890 2,235,527 62,947,71440.425.5 1900 3,048,710 75,994,57536.420.7 1910 3,896,542 91,972,26627.821.0 1920 4,663,228 105,710,62019.714.9 1930 5,824,715 122,775,04624.916.1 1940 6,414,824 131,669,27510.17.2 1950 7,711,194 150,697,36120.214.5 1960 9,579,677 179,323,17524.219.0 1970 11,196,730 203,302,03116.913.4 1980 14,229,191 226,545,80527.111.4 1990 16,986,510 248,709,87319.49.8 2000 20,851,820 281,421,90622.813.2 2010 25,145,561 308,745,53820.69.7 Source: Derived from the U.S. Census Bureau decennial census April 1 of reported year.

3
3 Estimates of the Unauthorized Immigrant Population in the United States (in Millions), 2000-2012 Source: Passel, Jeffrey and D’Vera Cohn, “Unauthorized Immigrant Totals Rise in 7 States, Fall in 14,” Washington, D.C. Pew Hispanic Center, November 18, 2014.

4
4 Estimates of the Unauthorized Immigrant Population in Texas (in Millions), 2000-2012 Source: Passel, Jeffrey and D’Vera Cohn, “Unauthorized Immigrant Totals Rise in 7 States, Fall in 14,” Washington, D.C.Pew Hispanic Center, November 18, 2014.
, Source: Passel, Jeffrey and D’Vera Cohn, Unauthorized Immigrant Totals Rise in 7 States, Fall in 14, Washington, D.C.Pew Hispanic Center, November 18, 2014.")
5
Change 2000-2010 State 2000 Population 2010 PopulationNumericPercent United States281,421,906308,745,53827,323,6329.7 Texas20,851,82025,145,5614,293,74120.6 California33,871,64837,253,9563,382,30810.0 Florida15,982,37818,801,3102,818,93217.6 Georgia8,186,4539,687,6531,501,20018.3 North Carolina8,049,3139,535,4831,486,17018.5 Arizona5,130,6326,392,0171,261,38524.6 Virginia7,078,5158,001,024922,50913.0 Washington5,894,1216,724,540830,41914.1 Colorado4,301,2615,029,196727,93516.9 Nevada1,998,2572,700,551702,29435.1 Ten States in the United States with the Largest Numeric Population Increase 2000-2010 Population values as of April 1, 2000 and April 1, 2010. Source: U.S. Census Bureau

6
Ten Largest States in the United States Ranked by Population Size in 2014 State April 1, 2000 April 1, 2010 July 1, 2014 Change 2000-10 Change 2010-14 Numeric% % United States281,421,906308,745,538318,857,05627,323,6329.710,111,5183.3 California33,871,64837,253,95638,802,5003,382,308101,548,5444.2 Texas20,851,82025,145,56126,956,9584,293,74120.61,811,3977.2 Florida15,982,37818,801,31019,893,2972,818,93217.61,091,9875.8 New York18,976,45719,378,10219,746,227401,6452.1368,1251.9 Illinois12,419,29312,830,63212,880,580411,3393.349,9480.4 Pennsylvania12,281,05412,702,37912,787,209421,3253.484,8300.7 Ohio11,353,14011,536,50411,594,163183,3641.657,6590.5 Georgia8,186,4539,687,65310,097,3431,501,20018.3409,6904.2 North Carolina8,049,3139,535,4839,943,9641,486,17018.5408,4814.3 Michigan9,938,4449,883,6409,909,877-54,804-0.626,2370.3 Source: U.S. Census Bureau.

7
Ten States in the United States with the Largest Numeric Population Increase, 2010-2014 State April 1, 2000 April 1, 2010 July 1, 2014 Change 2000-10 Change 2010-14 Numeric% % United States281,421,906308,745,538318,857,05627,323,6329.710,111,5183.3 Texas20,851,82025,145,56126,956,9584,293,74120.61,811,3977.2 California33,871,64837,253,95638,802,5003,382,30810.01,548,5444.2 Florida15,982,37818,801,31019,893,2972,818,93217.61,091,9875.8 Georgia8,186,4539,687,65310,097,3431,501,20018.3409,6904.2 North Carolina8,049,3139,535,4839,943,9641,486,17018.5408,4814.3 New York18,976,45719,378,10219,746,227401,6452.1368,1251.9 Arizona5,130,6326,392,0176,731,4841,261,38524.6339,4675.3 Washington5,894,1216,724,5407,061,530830,41914.1336,9905.0 Colorado4,301,2615,029,1965,355,866727,93516.9326,6706.5 Virginia7,078,5158,001,0248,326,289922,50913.0325,2654.1 Source: U.S. Census Bureau.

8
Ten States in the United States with the Largest Percentage Population Increase, 2010-2014 State April 1, 2000 April 1, 2010 July 1, 2014 Change 2000-10 Change 2010-14 Numeric% % United States281,421,906308,745,538318,857,05627,323,6329.710,111,5183.3 North Dakota642,200672,591739,48230,3914.766,8919.9 Texas20,851,82025,145,56126,956,9584,293,74120.61,811,3977.2 Colorado4,301,2615,029,1965,355,866727,93516.9326,6706.5 Utah2,233,1692,763,8852,942,902530,71623.8179,0176.5 Florida15,982,37818,801,31019,893,2972,818,93217.61,091,9875.8 Arizona5,130,6326,392,0176,731,4841,261,38524.6339,4675.3 Nevada1,998,2572,700,5512,839,099702,29435.1138,5485.1 Washington5,894,1216,724,5407,061,530830,41914.1336,9905.0 South Dakota754,844814,180853,17559,3367.938,9954.8 South Carolina4,012,0124,625,3644,832,482613,35215.3207,1184.5 Source: U.S. Census

9
Twenty MSAs with the Largest Numeric Change, 2010 - 2014 Population Change 2013-2014 Change 2010-2014 Place201020132014 Numeric % % Houston-The Woodlands-Sugar Land, TX 5,920,416 6,333,809 6,490,180 156,371 2.5 569,764 9.6 Dallas-Fort Worth-Arlington, TX 6,426,214 6,823,113 6,954,330 131,217 1.9 528,116 8.2 New York-Newark-Jersey City, NY-NJ-PA 19,567,410 20,002,086 20,092,883 90,797 0.5 525,473 2.7 Los Angeles-Long Beach-Anaheim, CA 12,828,837 13,175,849 13,262,220 86,371 0.7 433,383 3.4 Washington-Arlington-Alexandria, DC-VA-MD-WV 5,636,232 5,967,176 6,033,737 66,561 1.1 397,505 7.1 Miami-Fort Lauderdale-West Palm Beach, FL 5,564,635 5,863,458 5,929,819 66,361 1.1 365,184 6.6 Atlanta-Sandy Springs-Roswell, GA 5,286,728 5,525,432 5,614,323 88,891 1.6 327,595 6.2 Phoenix-Mesa-Scottsdale, AZ 4,192,887 4,404,129 4,489,109 84,980 1.9 296,222 7.1 San Francisco-Oakland-Hayward, CA 4,335,391 4,529,654 4,594,060 64,406 1.4 258,669 6.0 Seattle-Tacoma-Bellevue, WA 3,439,809 3,613,621 3,671,478 57,857 1.6 231,669 6.7 Austin-Round Rock, TX 1,716,289 1,885,803 1,943,299 57,496 3.0 227,010 13.2 Riverside-San Bernardino-Ontario, CA 4,224,851 4,390,262 4,441,890 51,628 1.2 217,039 5.1 Denver-Aurora-Lakewood, CO 2,543,482 2,699,750 2,754,258 54,508 2.0 210,776 8.3 Orlando-Kissimmee-Sanford, FL 2,134,411 2,271,083 2,321,418 50,335 2.2 187,007 8.8 San Antonio-New Braunfels, TX 2,142,508 2,282,201 2,328,652 46,451 2.0 186,144 8.7 Boston-Cambridge-Newton, MA-NH 4,552,402 4,698,049 4,732,161 34,112 0.7 179,759 3.9 San Diego-Carlsbad, CA 3,095,313 3,222,558 3,263,431 40,873 1.3 168,118 5.4 Charlotte-Concord-Gastonia, NC-SC 2,217,012 2,337,339 2,380,314 42,975 1.8 163,302 7.4 Minneapolis-St. Paul-Bloomington, MN-WI 3,348,859 3,461,434 3,495,176 33,742 1 146,317 4 Tampa-St. Petersburg-Clearwater, FL 2,783,243 2,874,154 2,915,582 41,428 1.4 132,339 4.8

10
Twenty Places with the Largest Numeric Change, 2010 - 2014 Population Change 2013-2014 Change 2010-2014 Place201020132014 Numeric% % New York, NY 8,175,133 8,438,379 8,491,079 52,700 0.6 315,946 3.9 Houston, TX 2,099,451 2,203,806 2,239,558 35,752 1.6 140,107 6.7 Los Angeles, CA 3,792,621 3,897,940 3,928,864 30,924 0.8 136,243 3.6 Austin, TX 790,390 887,124 912,791 25,667 2.9 122,401 15.5 San Antonio, TX 1,327,407 1,411,766 1,436,697 24,931 1.8 109,290 8.2 Phoenix, AZ 1,445,632 1,512,442 1,537,058 24,616 1.6 91,426 6.3 Dallas, TX 1,197,816 1,260,725 1,281,047 20,322 1.6 83,231 6.9 Charlotte, NC 731,424 793,951 809,958 16,007 2.0 78,534 10.7 San Diego, CA 1,307,402 1,359,844 1,381,069 21,225 1.6 73,667 5.6 Fort Worth, TX 741,206 794,055 812,238 18,183 2.3 71,032 9.6 San Jose, CA 945,942 1,003,821 1,015,785 11,964 1.2 69,843 7.4 Denver, CO 600,158 648,401 663,862 15,461 2.4 63,704 10.6 Seattle, WA 608,660 653,404 668,342 14,938 2.3 59,682 9.8 Washington, DC 601,723 649,111 658,893 9,782 1.5 57,170 9.5 Columbus, Ohio 787,033 823,536 835,957 12,421 1.5 48,924 6.2 San Francisco, CA 805,235 841,138 852,469 11,331 1.3 47,234 5.9 Nashville-Davidson, TN 601,222 634,870 644,014 9,144 1.4 42,792 7.1 Oklahoma City, OK 579,999 611,030 620,602 9,572 1.6 40,603 7.0 New Orleans, LA 343,829 379,006 384,320 5,314 1.4 40,491 11.8

12
Components of Population Change for Texas, April 1, 2010 - June 30, 2013 Total Change: 1,295,324

13
Components of Population Change for Houston-The Woodlands-Sugar Land MSA, April 1, 2010 – June 30, 2013 Total Change: 392,702 Source: U.S. Census Bureau, 2013 Population Estimates

14
Components of Population Change for Harris County, April 1, 2010 – June 30, 2013 Total Change: 245,425

15
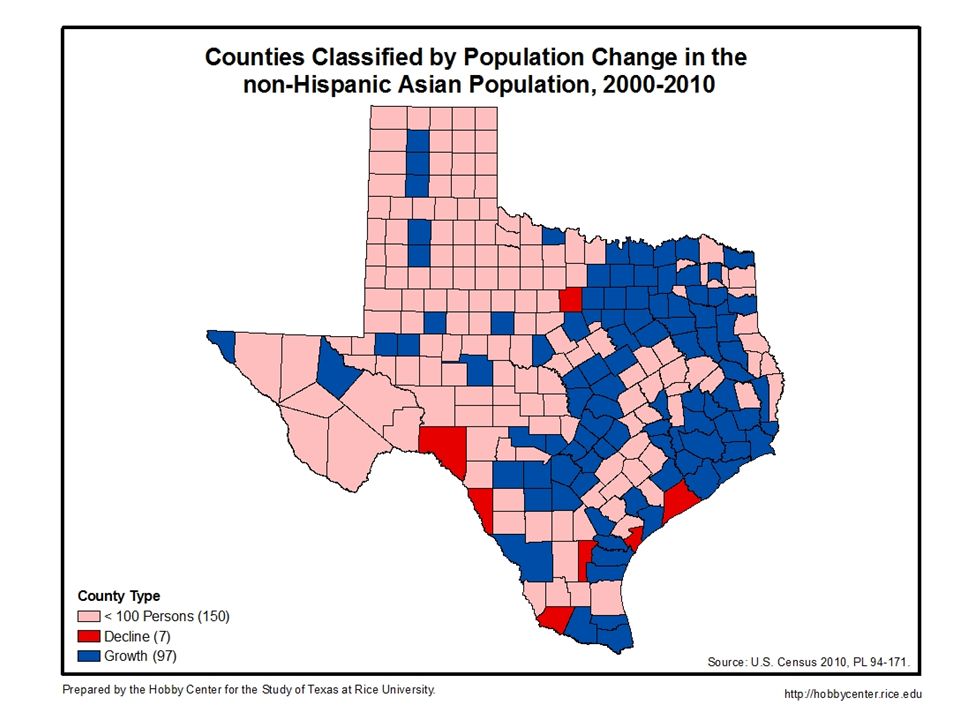
Population, Population Change, and Proportion of the Total Population by Race/Ethnicity for Texas, 2000 and 2010 PopulationPopulation ChangePercent of Total Population Race/Ethnicity*20002010NumericPercent Percent of Total Change 20002010 NH White10,933,31311,397,345464,0324.210.8 52.4 45.3 Hispanic (All Races)6,669,6669,460,9212,791,25541.865.0 32.0 37.6 NH Black2,364,2552,886,825522,57022.112.2 11.3 11.5 NH Asian554,445948,426393,98171.19.2 2.7 3.8 NH Other330,141452,044121,90336.92.8 1.6 1.8 Total20,851,82025,145,5614,293,74120.6 100.0 *Hispanic includes persons of all races. All other race/ethnicity categories shown here are Non-Hispanic. Non-Hispanic Other includes persons identifying themselves as Non-Hispanic American Indian or Alaska Native, Non-Hispanic Native Hawaiian or Pacific Islander, Non- Hispanic Some Other Race, or Non-Hispanic and a combination of two or more races. Source: U.S. Census 2000 and 2010, P.L. 94-171. Prepared by the Hobby Center for the Study of Texas at Rice University http://HobbyCenter.Rice.edu

16
Population, Population Change, and Proportion of the Population 18 Years and Older by Race/Ethnicity for Texas, 2000 and 2010 PopulationPopulation ChangePercent of Total Population Race/Ethnicity*20002010NumericPercent Percent of Total Change 20002010 NH White8,426,1669,074,684648,5187.719.6 56.3 49.6 Hispanic (All Races)4,282,9016,143,1441,860,24343.456.1 28.6 33.6 NH Black1,631,4482,076,282444,83427.313.4 10.9 11.4 NH Asian415,219716,968301,74972.79.1 2.8 3.9 NH Other209,327268,65959,33228.31.8 1.4 1.5 Total14,965,06118,279,7373,314,67622.1 100.0 *Hispanic includes persons of all races. All other race/ethnicity categories shown here are Non-Hispanic. Non-Hispanic Other includes persons identifying themselves as Non-Hispanic American Indian or Alaska Native, Non-Hispanic Native Hawaiian or Pacific Islander, Non- Hispanic Some Other Race, or Non-Hispanic and a combination of two or more races. Source: U.S. Census 2000 and 2010, P.L. 94-171. Prepared by the Hobby Center for the Study of Texas at Rice University http://HobbyCenter.Rice.edu

17
Population, Population Change, and Proportion of the Population Under 18 Years by Race/Ethnicity for Texas, 2000 and 2010 PopulationPopulation ChangePercent of Total Population Race/Ethnicity*20002010NumericPercent Percent of Total Change 20002010 NH White2,507,1472,322,661-184,486-7.4-18.8 42.6 33.8 Hispanic (All Races)2,386,7653,317,777931,01239.095.1 40.5 48.3 NH Black732,807810,54377,73610.67.9 12.4 11.8 NH Asian139,226231,45892,23266.29.4 2.4 3.4 NH Other120,814183,38562,57151.86.4 2.1 2.7 Total5,886,7596,865,824979,06516.6 100.0 *Hispanic includes persons of all races. All other race/ethnicity categories shown here are Non-Hispanic. Non-Hispanic Other includes persons identifying themselves as Non-Hispanic American Indian or Alaska Native, Non-Hispanic Native Hawaiian or Pacific Islander, Non- Hispanic Some Other Race, or Non-Hispanic and a combination of two or more races. Source: U.S. Census 2000 and 2010, P.L. 94-171. Prepared by the Hobby Center for the Study of Texas at Rice University http://HobbyCenter.Rice.edu

22
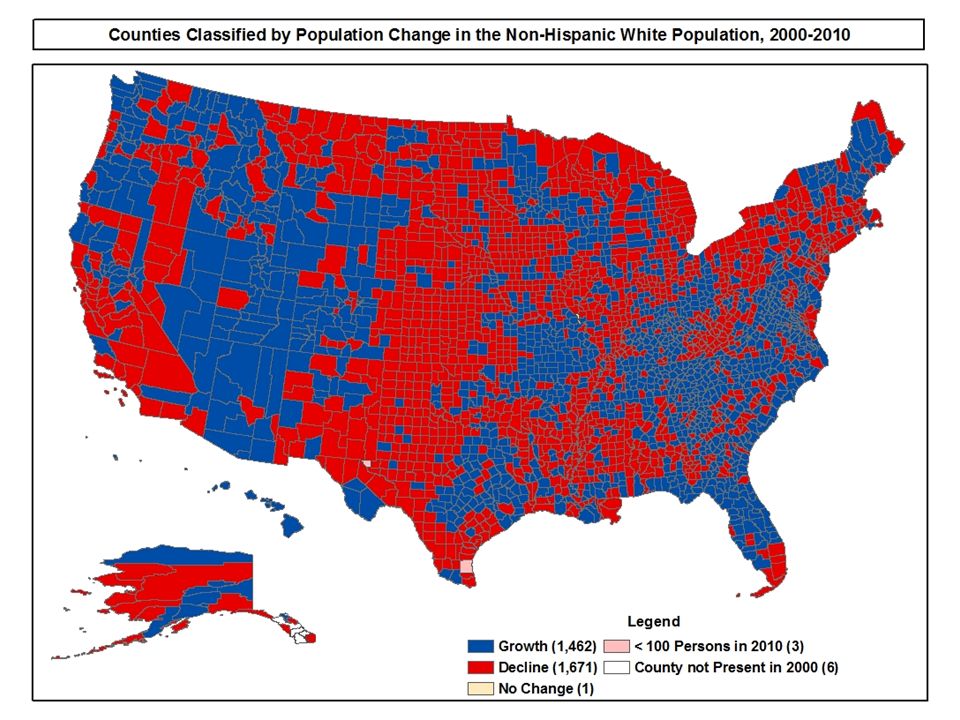
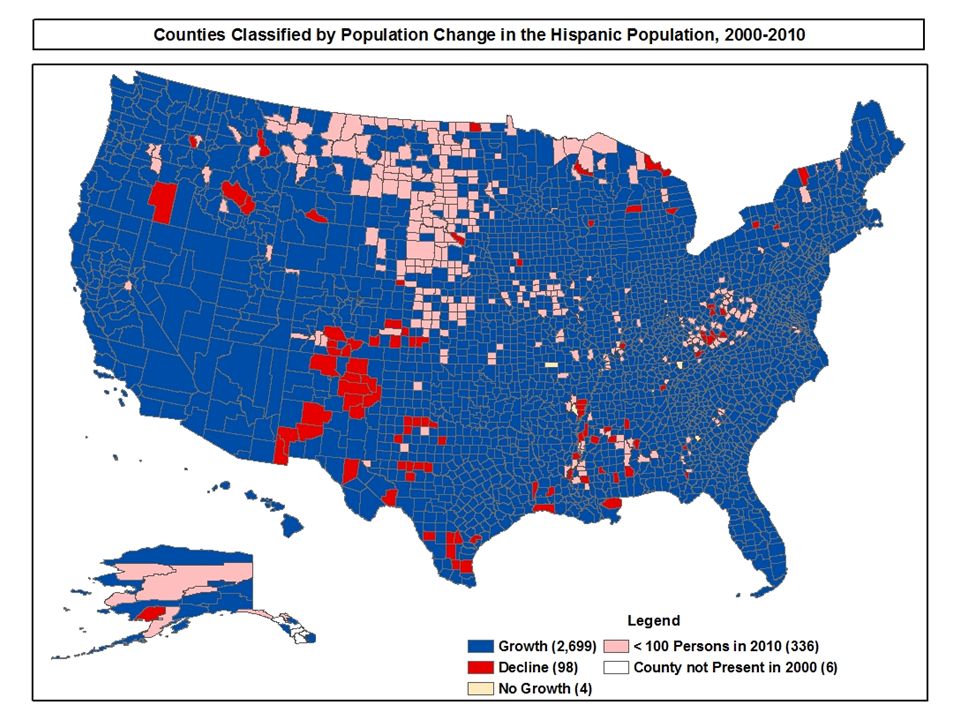
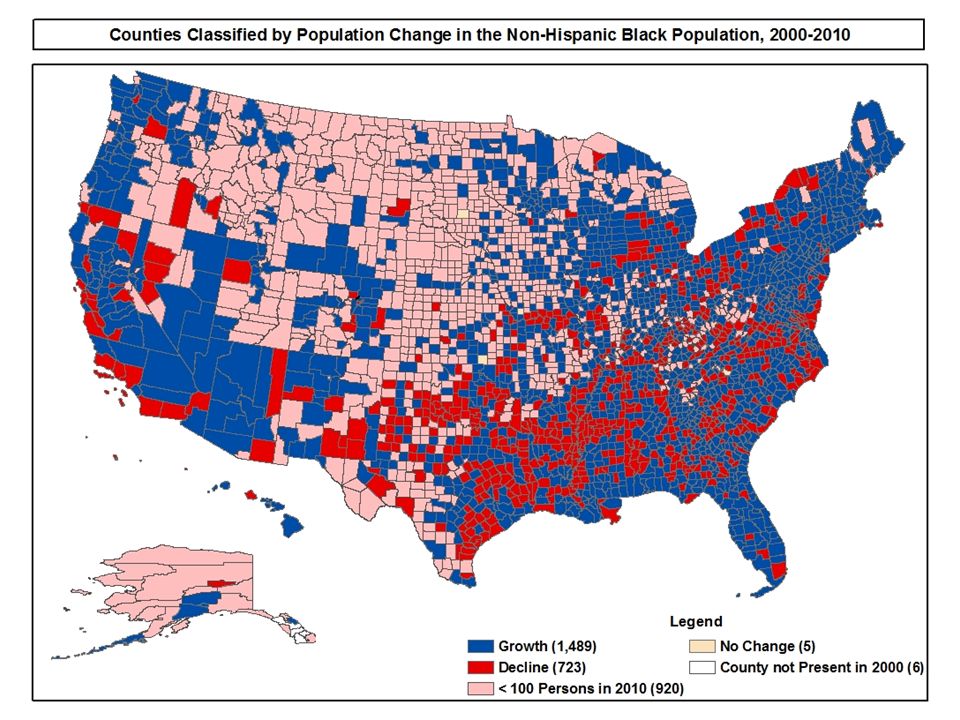
Population, Population Change, and Proportion of the Total Population by Race/Ethnicity for the United States, 2000 and 2010 PopulationPopulation ChangePercent of Total Population Race/Ethnicity*20002010NumericPercent Percent of Total Change 20002010 NH White194,552,774196,817,5522,264,7781.28.3 69.1 63.7 Hispanic (All Races)35,305,81850,477,59415,171,77643.055.5 12.5 16.3 NH Black33,947,83737,685,8483,738,01111.013.7 12.1 12.2 NH Asian10,123,16914,465,1244,341,95542.915.9 3.6 4.7 NH Other7,492,3089,299,4201,807,11224.16.6 2.7 3.0 Total281,421,906308,745,53827,323,6329.7 100.0 *Hispanic includes persons of all races. All other race/ethnicity categories shown here are Non-Hispanic. Non-Hispanic Other includes persons identifying themselves as Non-Hispanic American Indian or Alaska Native, Non-Hispanic Native Hawaiian or Pacific Islander, Non- Hispanic Some Other Race, or Non-Hispanic and a combination of two or more races. Source: U.S. Census 2000 and 2010, P.L. 94-171. Prepared by the Hobby Center for the Study of Texas at Rice University http://HobbyCenter.Rice.edu

23
Population, Population Change, and Proportion of the Population Under 18 Years by Race/Ethnicity for the United States, 2000 and 2010 PopulationPopulation ChangePercent of Total Population Race/Ethnicity*20002010NumericPercent Percent of Total Change 20002010 NH White44,027,08739,716,562-4,310,525-9.8-228.4 60.9 53.5 Hispanic (All Races)12,342,25917,130,8914,788,63238.8253.7 17.1 23.1 NH Black10,610,26410,362,183-248,081-2.3-13.1 14.7 14.0 NH Asian2,420,2743,176,129755,85531.240.0 3.3 4.3 NH Other2,893,9283,795,702901,77431.247.8 4.0 5.1 Total72,293,81274,181,4671,887,6552.6 100.0 *Hispanic includes persons of all races. All other race/ethnicity categories shown here are Non-Hispanic. Non-Hispanic Other includes persons identifying themselves as Non-Hispanic American Indian or Alaska Native, Non-Hispanic Native Hawaiian or Pacific Islander, Non- Hispanic Some Other Race, or Non-Hispanic and a combination of two or more races. Source: U.S. Census 2000 and 2010, P.L. 94-171. Prepared by the Hobby Center for the Study of Texas at Rice University http://HobbyCenter.Rice.edu

28
Population, Population Change, and Proportion of the Total Population by Race/Ethnicity for the Dallas-Fort Worth-Arlington Metropolitan Statistical Area, Texas 2000 and 2010 Population Population Change Percent of Total Change Racial Group20002010 NumericPercent Percent of Total Change 20002010 NH* White3,081,7343,248,509 166,7755.413.6 59.350.5 NH Black707,490941,599 234,10933.119.2 13.614.7 Hispanic1,121,4421,758,738 637,29656.852.2 21.527.4 NH Asian & Other293,460477,368 183,90862.715.0 5.67.4 Total5,204,1266,426,214 1,222,08823.5100.0 Source: U.S. Census 2010, P.L. 94-171. Metropolitan Statistical Areas (MSAs) as defined by OMB in 2013. *NH refers to nonHispanic values for categories labeled NH are only for the nonHispanic persons in each race category. Hispanic includes Hispanics of all races.
 as defined by OMB in *NH refers to nonHispanic values for categories labeled NH are only for the nonHispanic persons in each race category. Hispanic includes Hispanics of all races..")
29
Population, Population Change, and Proportion of the Total Population Under Age 18 by Race/Ethnicity for the Dallas-Fort Worth-Arlington Metropolitan Statistical Area, 2000 and 2010 Population Population Change Percent of Total Change Racial Group20002010 NumericPercent Percent of Total Change 20002010 NH* White735,112699,178 -35,934-4.9-11.1 50.239.1 NH Black227,185277,206 50,02122.015.4 15.615.5 Hispanic410,193661,960 251,76761.477.5 28.137.1 NH Asian & Other88,486147,481 58,99566.718.2 6.18.3 Total1,460,9761,785,825 324,84922.2100.0 Source: U.S. Census 2010, P.L. 94-171. Metropolitan Statistical Areas (MSAs) as defined by OMB in 2013. *NH refers to nonHispanic values for categories labeled NH are only for the nonHispanic persons in each race category. Hispanic includes Hispanics of all races.
 as defined by OMB in *NH refers to nonHispanic values for categories labeled NH are only for the nonHispanic persons in each race category. Hispanic includes Hispanics of all races..")
30
Population, Population Change, and Proportion of the Total Population by Race/Ethnicity for the Houston-The Woodlands-Sugar Land Metropolitan Statistical Area, 2000 and 2010 Population Population Change Percent of Total Change Racial Group20002010 NumericPercent Percent of Total Change 20002010 NH* White2,256,8572,340,268 83,4113.76.8 48.139.6 NH Black781,159996,221 215,06227.517.5 16.616.8 Hispanic1,352,3932,096,532 744,13955.060.7 28.835.4 NH Asian & Other302,752487,395 184,64361.015.0 6.58.2 Total4,693,1615,920,416 1,227,25526.1100.0 Source: U.S. Census 2010, P.L. 94-171. Metropolitan Statistical Areas (MSAs) as defined by OMB in 2013. *NH refers to nonHispanic values for categories labeled NH are only for the nonHispanic persons in each race category. Hispanic includes Hispanics of all races.
 as defined by OMB in *NH refers to nonHispanic values for categories labeled NH are only for the nonHispanic persons in each race category. Hispanic includes Hispanics of all races..")
31
Population, Population Change, and Proportion of the Total Population Under 18 by Race/Ethnicity for the Houston-The Woodlands-Sugar Land Metropolitan Statistical Area, 2000 and 2010 Population Population Change Percent of Total Change Racial Group20002010 NumericPercent Percent of Total Change 20002010 NH* White542,563494,054 -48,509-8.9-16.5 39.829.8 NH Black244,702282,991 38,28915.613.0 18.017.1 Hispanic489,495744,227 254,73252.086.8 35.945.0 NH Asian & Other85,634134,692 49,05857.316.7 6.38.1 Total1,362,3941,655,964 293,57021.5100.0 Source: U.S. Census 2010, P.L. 94-171. Metropolitan Statistical Areas (MSAs) as defined by OMB in 2013. *NH refers to nonHispanic values for categories labeled NH are only for the nonHispanic persons in each race category. Hispanic includes Hispanics of all races.
 as defined by OMB in *NH refers to nonHispanic values for categories labeled NH are only for the nonHispanic persons in each race category. Hispanic includes Hispanics of all races..")
32
POPULATION CHARACTERISTICS AND SOCIOECONOMIC CONDITIONS

33
Total and Percent of the Population in Poverty and Median Household Income by Race/Ethnicity for the United States, 1999 and 2010 Race/ Ethnicity 19992010 Population in Poverty % Median Household Income* Population in Poverty % Median Household Income* NH White16,026,5428.3$59,22121,831,92810.8$53,988 Hispanic (All Races)7,797,87422.6$44,07912,583,54224.8$40,165 NH Black7,970,16524.8$38,54110,270,22927.1$33,568 NH Asian1,241,29112.6$68,0201,806,21712.4$67,142 Total33,899,81212.4$54,966 47,330,50215.3$50,046 *In 2010 Dollars. Source: U.S. Census Bureau, Census 2000 Summary File 4, 2006-2010 American Community Survey Not all race/ethnic groups are shown here but are included in the total. Prepared by the Hobby Center for the Study of Texas at Rice University http://HobbyCenter.Rice.edu

34
Total and Percent of the Population in Poverty and Median Household Income by Race/Ethnicity for Texas, 1999 and 2010 Race/ Ethnicity 19992010 Population in Poverty % Median Household Income* Population in Poverty % Median Household Income* NH White856,0557.9$61,5421,111,2519.5$59,517 Hispanic (All Races)1,658,43425.4$39,1012,555,08026.8$37,087 Black515,85923.3$38,378717,45824.7$35,674 Asian63,59811.7$65,633120,60112.6$64,191 Total3,117,60915.4$52,260 4,521,02317.9$48,615 *In 2010 Dollars. Source: U.S. Census Bureau, Census 2000 Summary File 4, 2006-2010 American Community Survey Not all race/ethnic groups are shown here but are included in the total. Prepared by the Hobby Center for the Study of Texas at Rice University http://HobbyCenter.Rice.edu

35
Total and Percent of the Population in Poverty and Median Household Income by Race/Ethnicity for Dallas-Forth Worth-Arlington MSA, Texas, 1999 and 2010 Race/ Ethnicity 1999 2010 Population in Poverty % Median Household Income* Population in Poverty % Median Household Income* NH White 168,3995.5$72,291234,2447.3$66,611 Hispanic (All Races) 219,00619.9$46,782419,02423.7$40,083 NH Black 134,47419.7$43,070220,86723.6$37,539 Asian 19,16510.0$72,04937,44111.0$70,006 Total 547,38510.8$63,245 934,82714.6$54,449 *In 2010 Dollars Source: U.S. Census Bureau, Census 2000 Summary File 4, 2006-2010 American Community Survey Prepared by the Hobby Center for the Study of Texas at Rice University http://HobbyCenter.Rice.edu

36
Total and Percent of the Population in Poverty and Median Household Income by Race/Ethnicity for Houston-Sugar Land-Baytown MSA, Texas, 1999 and 2010 Race/ Ethnicity 1999 2010 Population in Poverty % Median Household Income* Population in Poverty % Median Household Income* NH White 142,9066.2$73,353167,5937.1$72,480 Hispanic (All Races) 294,48422.0$43,087533,71625.2$40,972 NH Black 167,27122.0$41,210223,99022.2$39,638 Asian 25,33811.4$67,70250,73212.9$67,333 Total 635,34913.7$58,497 986,22016.5$53,942 *In 2010 Dollars Source: U.S. Census Bureau, Census 2000 Summary File 4, 2006-2010 American Community Survey Prepared by the Hobby Center for the Study of Texas at Rice University http://HobbyCenter.Rice.edu

37
Percent of the Population Age 25 and Older in the United States and Texas with Less Than High School Diploma/GED by Race/Ethnicity, 2010

38
Educational Attainment for the Population Age 25 and over by Race/Ethnicity, Dallas, Texas, 2010 Race/ Ethnicity* Population Age 25 and Older Less than High School High School Diploma Some College or Associates Degree Bachelor Degree or More NH White268,2344.814.523.557.2 NH Black184,58216.435.633.114.9 Hispanic269,88656.423.812.27.6 Asian24,48418.710.716.254.4 NH Other12,66211.214.236.538.1 Total759,84826.522.821.828.9 *Hispanic includes persons of all races. All other race/ethnicity categories shown here are Non-Hispanic. Non- Hispanic Other includes persons identifying themselves as Non-Hispanic American Indian or Alaska Native, Non- Hispanic Native Hawaiian or Pacific Islander, Non-Hispanic Some Other Race, or Non-Hispanic and a combination of two or more races. Source: U.S. Census Bureau 2010 American Community Survey Prepared by the Hobby Center for the Study of Texas at Rice University http://HobbyCenter.Rice.edu

39
Educational Attainment for the Population Age 25 and over by Race/Ethnicity, Houston, Texas, 2010 Race/ Ethnicity* Population Age 25 and Older Less than High School High School Diploma Some College or Associates Degree Bachelor Degree or More NH White419,8895.616.025.952.5 NH Black308,64015.531.634.918.0 Hispanic501,73450.922.816.49.8 Asian91,93915.815.017.152.1 NH Other14,93616.017.334.535.7 Total1,337,13825.722.123.928.3 *Hispanic includes persons of all races. All other race/ethnicity categories shown here are Non-Hispanic. Non- Hispanic Other includes persons identifying themselves as Non-Hispanic American Indian or Alaska Native, Non- Hispanic Native Hawaiian or Pacific Islander, Non-Hispanic Some Other Race, or Non-Hispanic and a combination of two or more races. Source: U.S. Census Bureau 2010 American Community Survey Prepared by the Hobby Center for the Study of Texas at Rice University http://HobbyCenter.Rice.edu

40
PROJECTIONS

41
U.S. Population by Race and Hispanic Origin: Census 2010 and Projected for 2020 to 2060 Year (Resident population as of July 1, Number in thousands) Non-Hispanic Hispanic (any race) Total White aloneBlack aloneAsian alone All other races 2010196,81837,68614,4659,29950,478308,746 2020199,31241,77618,24610,77863,784333,896 2030198,81845,45222,04413,50278,655358,471 2040193,88748,76925,88116,60394,876380,016 2050186,33451,98829,58320,166111,732399,803 2060178,95255,30233,10624,128128,780420,268 Source: U.S. Census Bureau, 2010 Census and 2012 National Projections
 Non-Hispanic Hispanic (any race) Total White aloneBlack aloneAsian alone All other races ,81837,68614,4659,29950,478308, ,31241,77618,24610,77863,784333, ,81845,45222,04413,50278,655358, ,88748,76925,88116,60394,876380, ,33451,98829,58320,166111,732399, ,95255,30233,10624,128128,780420,268 Source: U.S. Census Bureau, 2010 Census and 2012 National Projections.")
42
Numeric Change in U.S. Population by Race and Hispanic Origin: 2010 to 2060 (in millions)
")
43
Change in the U.S. Population by Race and Hispanic Origin: 2010 to 2060

44
Age Distribution of the U.S. Population: Census 2010 and Projected 2020 to 2060 Age Group (Percent of total resident population as of July 1) 201020202030204020502060 Under 5 years6.5 6.26.16.05.9 5 to 19 years20.418.818.618.117.817.7 20 to 44 years33.633.032.331.531.631.3 45 to 64 years26.424.922.623.323.723.2 65 years and over13.116.820.321.020.921.9 Source: U.S. Census Bureau, 2010 Census and 2012 National Projections
 Under 5 years to 19 years to 44 years to 64 years years and over Source: U.S. Census Bureau, 2010 Census and 2012 National Projections.")
45
Percent By Race and Hispanic Origin by Selected Age Groups for the U.S. Population : 2010 Age Group Percent of each group's resident population as of April 1 Non-Hispanic Hispanic (any race) Total White alone Black alone Asian alone All other races Total 63.812.24.73.016.3100.0 Under 5 years 50.813.64.36.025.3100.0 5 to 17 years 54.514.14.34.822.3100.0 18 to 24 years 57.114.34.93.620.1100.0 25 to 44 years 59.612.65.92.719.2100.0 45 to 64 years 71.711.34.42.010.6100.0 65 years and over 80.08.43.41.36.9100.0 Elderly Age Groups 65 to 74 years 78.09.13.81.57.6100.0 75 to 84 years 81.27.83.21.26.6100.0 85 years and over 84.96.82.50.94.9100.0 Source: U.S. Census Bureau, 2010 Census
 Total White alone Black alone Asian alone All other races Total Under 5 years to 17 years to 24 years to 44 years to 64 years years and over Elderly Age Groups 65 to 74 years to 84 years years and over Source: U.S. Census Bureau, 2010 Census.")
46
Projected Percent By Race and Hispanic Origin by Selected Age Groups for the U.S. Population: 2060 Age Group Percent of each group's resident population as of April 1 Non-Hispanic Hispanic (any race)Total White alone Black alone Asian alone All other races Total 42.613.27.95.730.6100.0 Under 5 years 30.913.06.69.939.6100.0 5 to 17 years 33.613.26.89.037.4100.0 18 to 24 years 35.813.27.27.736.1100.0 25 to 44 years 39.013.58.56.033.0100.0 45 to 64 years 45.313.48.74.428.2100.0 65 years and over 55.812.57.72.721.3100.0 Elderly Age Groups 65 to 74 years 52.513.68.03.122.8100.0 75 to 84 years 56.711.77.92.521.2100.0 85 years and over 62.710.96.72.117.6100.0 Source: U.S. Census Bureau, 2012 National Projections
Total White alone Black alone Asian alone All other races Total Under 5 years to 17 years to 24 years to 44 years to 64 years years and over Elderly Age Groups 65 to 74 years to 84 years years and over Source: U.S. Census Bureau, 2012 National Projections.")
47
Population in Texas by Race/Ethnicity in 2010 and Projections of the Population in Texas by Race/Ethnicity from 2020 to 2050 Under Alternative Assumptions of Age and Race/Ethnicity-Specific Rates of Net Migration 47 YearNH 1 WhiteNH BlackHispanic NH Asian & Other 2 Total Assuming Zero Net Migration 201011,397,3452,886,8259,460,9211,400,47025,145,561 2020 11,576,5953,122,63711,137,6721,536,69327,373,597 2030 11,501,0203,280,94112,869,7531,638,24929,289,963 2040 11,182,5763,355,50014,570,8511,714,23230,823,159 2050 10,766,6223,366,52816,191,1501,728,20632,052,506 Assuming Net Migration Equal to One-Half of 2000-2010 201011,397,3452,886,8259,460,9211,400,47025,145,561 2020 11,752,5303,295,19812,031,0591,825,13028,903,917 2030 11,850,1803,658,99715,082,0582,309,76332,900,998 2040 11,676,1573,951,90918,489,8032,881,52536,999,394 2050 11,376,5764,182,15522,268,3903,483,17841,310,299 Assuming Net Migration Equal to 2000-2010 201011,397,3452,886,8259,460,9211,400,47025,145,561 2020 11,931,8153,477,92813,003,1592,170,40930,583,311 2030 12,211,6644,080,45317,702,1323,288,53637,282,785 2040 12,194,1514,653,72523,514,9744,953,86145,316,711 2050 12,024,9135,195,86130,701,2087,283,54855,205,530 1 NH refers to Non-Hispanic; values shown are only for the non-Hispanic persons in each race category. Hispanic includes Hispanics of all races. 2 NH Asian & Other category includes non-Hispanic persons who identify themselves as belonging to two or more race groups.

48
Percent of the Population by Race/Ethnicity in 2010 and Projected Through 2050 Under Alternative Assumptions of Age and Race/Ethnicity-Specific Rates of Net Migration for the State of Texas Year NH 1 WhiteNH BlackHispanic NH Asian & Other 2 Total Assuming Zero Net Migration (Scenario 0.0) 201045.311.537.6 5.6100.0 2020 42.311.440.7 5.6100.0 2030 39.311.243.9 5.6100.0 2040 36.310.947.2 5.6100.0 2050 33.610.550.5 5.4100.0 Assuming Net Migration Equal to One-Half of 2000-2010 (Scenario 0.5) 201045.311.537.6 5.6100.0 2020 40.711.441.6 6.3100.0 2030 36.011.145.8 7.1100.0 2040 31.610.750.0 7.7100.0 2050 27.510.253.9 8.4100.0 Assuming Net Migration Equal to 2000-2010 (Scenario 1.0) 201045.311.537.6 5.6100.0 2020 39.011.442.5 7.1100.0 2030 32.810.947.5 8.8100.0 2040 26.910.351.910.9100.0 2050 21.89.455.613.2100.0 1 NH refers to Non-Hispanic; values shown are only for the non-Hispanic persons in each race category. Hispanic includes Hispanics of all races. 2 NH Asian & Other category includes non-Hispanic persons who identify themselves as belonging to two or more race groups.

49
Percent of the Population by Age Group and Race/Ethnicity in 2010 and Projected Percent of the Population by Age Group and Race/Ethnicity from 2030 to 2050 Assuming Age and Race/Ethnicity-Specific Net Migration Equal to 2000-2010 for the State of Texas (Scenario 1.0) 49 AgeNH 1 WhiteNH BlackHispanic NH Asian & Other 2 Total 2010 <1820.428.135.129.627.3 18-248.711.211.710.2 25-4425.729.130.132.328.2 45-6429.824.017.521.424.0 65+15.47.65.66.510.3 2030 <18 19.323.429.721.724.9 18-24 7.59.610.811.59.6 25-44 23.027.229.931.627.5 45-64 24.324.219.824.122.2 65+ 25.915.69.811.115.8 2050 <18 18.220.727.321.924.0 18-24 7.48.910.68.69.4 25-44 23.025.527.830.526.9 45-64 23.725.621.424.922.8 65+ 27.719.312.914.116.9 1 NH refers to Non-Hispanic; values shown are only for the non-Hispanic persons in each race category. Hispanic includes Hispanics of all races. 2 NH Asian & Other category includes non-Hispanic persons who identify themselves as belonging to two or more race groups.

50
Percent of Age Group by Race/Ethnicity in 2010 and Projected Percent of Age Group by Race/Ethnicity from 2030 to 2050 Assuming Age and Race/Ethnicity-Specific Net Migration Equal to 2000-2010 for the State of Texas (Scenario 1.0) 50 AgeNH 1 WhiteNH BlackHispanic NH Asian & Other 2 Total 2010 <18 33.811.848.36.0100.0 18-24 38.712.643.25.5100.0 25-44 41.511.940.26.4100.0 45-64 56.111.527.45.0100.0 65+ 67.68.420.53.5100.0 2030 <18 25.410.356.67.7100.0 18-24 25.510.953.010.6100.0 25-44 27.310.851.710.1100.0 45-64 36.012.042.49.6100.0 65+ 53.610.829.46.2100.0 2050 <18 16.58.163.412.0100.0 18-24 17.18.962.012.0100.0 25-44 18.68.957.515.0100.0 45-64 22.710.552.414.4100.0 65+ 35.710.842.511.0100.0 1 NH refers to Non-Hispanic; values shown are only for the non-Hispanic persons in each race category. Hispanic includes Hispanics of all races. 2 NH Asian & Other category includes non-Hispanic persons who identify themselves as belonging to two or more race groups.

51
51 Percent of Persons 65 Years of Age and Older in Texas Counties, 2010 51

52
Percent of Persons 65 Years of Age and Older in Texas Counties, 2050* 52 * Assuming rates of net migration equal to 2000-2010

53
Population by Race/Ethnicity in 2010 and Projections of the Population by Race/Ethnicity from 2020 to 2050 Under Alternative Scenarios of Age/Sex and Race/Ethnicity-Specific Net Migration for Harris County YearNH White NH Black Hispanic NH Asian & Other Total 2010 1,349,646754,2581,671,540317,0154,092,459 Assuming Rates of Zero Net Migration 2020 1,370,357819,9031,994,717347,7984,532,775 2030 1,342,716858,7772,316,580363,9464,882,019 2040 1,278,423876,1372,643,875371,1765,169,611 2050 1,198,102876,4752,946,940370,5875,392,104 Assuming Rates of Net Migration Equal to One-Half of 2000-2010 2020 1,313,873840,3362,153,854400,8564,708,919 2030 1,232,849901,5762,698,721482,6255,315,771 2040 1,118,087934,3263,289,505563,9005,905,818 2050 998,149945,4313,909,739646,5306,499,849 Assuming Rates of Net Migration Equal to 2000-2010 2020 1,255,205856,1982,319,477459,0924,889,972 2030 1,113,765921,9463,099,887637,3625,772,960 2040 944,770935,9823,927,987851,4056,660,144 2050 784,522905,3824,767,4311,115,1387,572,473 Source: Tx. State Data Center and Hobby Center for the Study of Texas

54
Percent of Population by Race/Ethnicity in 2010 and Projections of the Population by Race/Ethnicity from 2020 to 2050 Under Alternative Scenarios of Age/Sex and Race/Ethnicity-Specific Net Migration for Harris County YearNH White NH Black Hispanic NH Asian & Other Total 2010 33.018.440.87.7100.0 Assuming Rates of Zero Net Migration 2020 30.218.144.07.7100.0 2030 27.517.647.57.5100.0 2040 24.716.951.17.2100.0 2050 22.216.354.76.9100.0 Assuming Rates of Net Migration Equal to One-Half of 2000-2010 2020 27.917.845.78.5100.0 2030 23.217.050.89.1100.0 2040 18.915.855.79.5100.0 2050 15.414.560.29.9100.0 Assuming Rates of Net Migration Equal to 2000-2010 2020 25.717.547.49.4100.0 2030 19.316.053.711.0100.0 2040 14.214.159.012.8100.0 2050 10.412.063.014.7100.0 Source: Tx. State Data Center and Hobby Center for the Study of Texas

55
Population by Race/Ethnicity in 2010 and Projections of the Population by Race/Ethnicity from 2020 to 2050 Under Alternative Scenarios of Age/Sex and Race/Ethnicity-Specific Net Migration for Dallas County YearNH White NH Black Hispanic NH Asian & Other Total 2010 784,693518,732905,940158,7742,368,139 Assuming Rates of Zero Net Migration 2020 785,498570,1531,107,349177,1052,640,105 2030 753,645605,3551,318,991186,8732,864,864 2040 701,895627,7561,545,129193,6733,068,453 2050 648,778640,5421,772,394196,0913,257,805 Assuming Rates of Net Migration Equal to One-Half of 2000-2010 2020 701,757581,4091,155,350198,5372,637,053 2030 597,468627,9101,435,586231,3332,892,297 2040 491,394656,5131,742,378264,0463,154,331 2050 401,233671,5392,070,126295,8843,438,782 Assuming Rates of Net Migration Equal to 2000-2010 2020 624,417588,7601,201,188221,7012,636,066 2030 464,572634,1001,538,137285,9432,922,752 2040 329,773645,2781,881,934358,3413,215,326 2050 231,828625,4572,221,784443,1213,522,190 Source: Tx. State Data Center and Hobby Center for the Study of Texas

56
Percent of Population by Race/Ethnicity in 2010 and Projections of the Population by Race/Ethnicity from 2020 to 2050 Under Alternative Scenarios of Age/Sex and Race/Ethnicity-Specific Net Migration for Dallas County YearNH White NH Black Hispanic NH Asian & Other Total 2010 33.121.938.36.7100.0 Assuming Rates of Zero Net Migration 2020 29.821.641.96.7100.0 2030 26.321.146.06.5100.0 2040 22.920.550.46.3100.0 2050 19.919.754.46.0100.0 Assuming Rates of Net Migration Equal to One-Half of 2000-2010 2020 26.622.043.87.5100.0 2030 20.721.749.68.0100.0 2040 15.620.855.28.4100.0 2050 11.719.560.28.6100.0 Assuming Rates of Net Migration Equal to 2000-2010 2020 23.722.345.68.4100.0 2030 15.921.752.69.8100.0 2040 10.320.158.511.1100.0 2050 6.617.863.112.6100.0 Source: Tx. State Data Center and Hobby Center for the Study of Texas

57
YearNH WhiteNH BlackHispanic NH Asian & OtherTotal Zero Net Migration 20103,327,493494,4401,163,353214,2915,199,577 20204,083,029729,8621,874,142356,6817,043,714 20304,317,143889,0182,706,852516,9508,429,963 20404,313,453986,4123,491,396647,0639,438,324 20504,200,3511,071,8454,132,177715,33510,119,708 Net Migration Equal to One-Half 2000-2010 20103,327,493494,4401,163,353214,2915,199,577 20204,155,229767,3341,956,916378,4227,257,901 20304,473,197989,0492,978,165600,0229,040,433 20404,546,7931,164,3874,097,050855,86710,664,097 20504,485,0341,327,1915,282,6011,104,88812,199,714 Net Migration Equal to 2000-2010 20103,327,493494,4401,163,353214,2915,199,577 20204,229,134806,7302,043,525401,9567,481,345 20304,635,9581,100,1293,277,789700,2429,714,118 20404,794,3411,374,8054,812,7071,154,41312,136,266 20504,791,6731,644,4456,772,9011,783,10214,992,121 Population Age 55 and Older in Texas by Race/Ethnicity in 2010 and Projected to 2050 Using Alternative Projection Scenarios

58
YearNH WhiteNH BlackHispanic NH Asian & Other Total Zero Net Migration 2010-2020755,536235,422710,789142,3901,844,137 2020-2030234,114159,156832,710160,2691,386,249 2030-2040-3,69097,394784,544130,1131,008,361 2040-2050-113,10285,433640,78168,272681,384 2010-2050872,858577,4052,968,824501,0444,920,131 Net Migration Equal to One-Half 2000-2010 2010-2020827,736272,894793,563164,1312,058,324 2020-2030317,968221,7151,021,249221,6001,782,532 2030-204073,596175,3381,118,885255,8451,623,664 2040-2050-61,759162,8041,185,551249,0211,535,617 2010-20501,157,541832,7514,119,248890,5977,000,137 Net Migration Equal to 2000-2010 2010-2020901,641312,290880,172187,6652,281,768 2020-2030406,824293,3991,234,264298,2862,232,773 2030-2040158,383274,6761,534,918454,1712,422,148 2040-2050-2,668269,6401,960,194628,6892,855,855 2010-20501,464,1801,150,0055,609,5481,568,8119,792,544 Numeric Change in Population Age 55 and Older in Texas by Race/Ethnicity in 2010 and Projected to 2050 Using Alternative Projection Scenarios

59
Percent Change in Population Age 55 and Older in Texas by Race/Ethnicity in 2010 and Projected to 2050 Using Alternative Projection Scenarios YearNH WhiteNH BlackHispanic NH Asian & Other Total Zero Net Migration 2010-202022.747.661.166.435.5 2020-20305.721.844.444.919.7 2030-2040-0.111.029.025.212.0 2040-2050-2.68.718.410.67.2 2010-205020.853.971.870.048.6 Net Migration Equal to One-Half 2000-2010 2010-202024.955.268.276.639.6 2020-20307.728.952.258.624.6 2030-20401.617.737.642.618.0 2040-2050-1.414.028.929.114.4 2010-205025.862.778.080.657.4 Net Migration Equal to 2000-2010 2010-202027.163.275.787.643.9 2020-20309.636.460.474.229.8 2030-20403.425.046.864.924.9 2040-2050-0.119.640.754.523.5 2010-205030.669.982.888.065.3

60
YearNH WhiteNH BlackHispanic NH Asian & Other Zero Net Migration 201064.09.522.44.1 202058.010.426.65.0 203051.210.532.16.2 204045.710.537.06.8 205041.510.640.87.1 Net Migration Equal to One-Half 2000-2010 201064.09.522.44.1 202057.310.627.05.1 203049.510.932.96.7 204042.610.938.48.1 205036.810.943.39.0 Net Migration Equal to 2000-2010 201064.09.522.44.1 202056.510.827.35.4 203047.711.333.77.3 204039.511.339.79.5 205032.011.045.211.8 Population Age 55 and Older in Texas by Race/Ethnicity in 2010 and Projected to 2050 Using Alternative Projection Scenarios

61
YearNH WhiteNH BlackHispanic NH Asian & OtherTotal Zero Net Migration 2010655,602172,514200,45885,3651,113,939 2020856,963252,409370,604136,6921,616,668 2030926,842308,405592,392191,3912,019,030 2040930,953345,509813,799233,9022,324,163 2050890,359376,113960,897252,8502,480,219 Net Migration Equal to One-Half 2000-2010 2010655,602172,514200,45885,3651,113,939 2020852,493265,005389,173149,2771,655,948 2030925,446342,235661,841234,1502,163,672 2040947,808405,538990,731329,8662,673,943 2050922,305461,9941,319,648420,7423,124,689 Net Migration Equal to 2000-2010 2010655,602172,514200,45885,3651,113,939 2020846,725277,146407,805162,3231,693,999 2030920,376376,339741,141288,7912,326,647 2040963,691469,2921,221,496474,7413,129,220 2050958,284553,2961,848,593724,5924,084,765 Population Age 55 and Older in the Houston-Sugar Land-The Woodlands MSA by Race/Ethnicity in 2010 and Projected to 2050 Using Alternative Projection Scenarios

62
Numeric Change in Population Age 55 and Older in the Houston-Sugar Land-The Woodlands MSA by Race/Ethnicity in 2010 and Projected to 2050 Using Alternative Projection Scenarios YearNH WhiteNH BlackHispanic NH Asian & Other Total Zero Net Migration 2010-2020201,36179,895170,14651,327502,729 2020-203069,87955,996221,78854,699402,362 2030-20404,11137,104221,40742,511305,133 2040-2050-40,59430,604147,09818,948156,056 2010-2050234,757203,599760,439167,4851,366,280 Net Migration Equal to One-Half 2000-2010 2010-2020196,89192,491188,71563,912542,009 2020-203072,95377,230272,66884,873507,724 2030-204022,36263,303328,89095,716510,271 2040-2050-25,50356,456328,91790,876450,746 2010-2050266,703289,4801,119,190335,3772,010,750 Net Migration Equal to 2000-2010 2010-2020191,123104,632207,34776,958580,060 2020-203073,65199,193333,336126,468632,648 2030-204043,31592,953480,355185,950802,573 2040-2050-5,40784,004627,097249,851955,545 2010-2050302,682380,7821,648,135639,2272,970,826

63
Percent Change in Population Age 55 and Older in the Houston-Sugar Land-The Woodlands MSA by Race/Ethnicity in 2010 and Projected to 2050 Using Alternative Projection Scenarios YearNH WhiteNH BlackHispanic NH Asian & Other Total Zero Net Migration 2010-202030.746.384.960.145.1 2020-20308.222.259.840.024.9 2030-20400.412.037.422.215.1 2040-2050-4.48.918.18.16.7 2010-205026.454.179.166.255.1 Net Migration Equal to One-Half 2000-2010 2010-202030.053.694.174.948.7 2020-20308.629.170.156.930.7 2030-20402.418.549.740.923.6 2040-2050-2.713.933.227.516.9 2010-205028.962.784.879.764.4 Net Migration Equal to 2000-2010 2010-202029.260.7103.490.252.1 2020-20308.735.881.777.937.3 2030-20404.724.764.864.434.5 2040-2050-0.617.951.352.630.5 2010-205031.668.889.288.272.7

64
YearNH WhiteNH BlackHispanic NH Asian & Other Zero Net Migration 201058.915.518.07.6 202053.015.622.98.5 203045.915.329.39.5 204040.114.935.010.0 205035.915.238.710.2 Net Migration Equal to One-Half 2000-2010 201058.915.518.07.6 202051.516.023.59.0 203042.815.830.610.8 204035.415.237.112.3 205029.514.842.213.5 Net Migration Equal to 2000-2010 201058.915.518.07.6 202050.016.424.19.5 203039.616.231.912.3 204030.815.039.015.2 205023.513.545.317.7 Population Age 55 and Older in the Houston-Sugar Land-The Woodlands MSA by Race/Ethnicity in 2010 and Projected to 2050 Using Alternative Projection Scenarios

65
YearNH WhiteNH BlackHispanic NH Asian & OtherTotal Zero Net Migration 2010388,721130,767156,21756,948732,653 2020499,143189,142290,08488,2711,066,640 2030535,215230,603467,786121,7931,355,397 2040547,954265,047654,411154,6261,622,038 2050522,357291,695774,637169,0081,757,697 Net Migration Equal to One-Half 2000-2010 2010388,721130,767156,21756,948732,653 2020470,929193,662297,86788,6951,051,153 2030472,810238,858493,052124,2021,328,922 2040457,231279,085720,655173,1471,630,118 2050416,632312,996934,401218,8181,882,847 Net Migration Equal to 2000-2010 2010388,721130,767156,21756,948732,653 2020441,455197,020304,22987,6321,030,336 2030406,512241,033511,699121,5111,280,755 2040359,409276,605762,433185,3861,583,833 2050303,153303,4331,051,157281,1041,938,847 Population Age 55 and Older in Harris County by Race/Ethnicity in 2010 and Projected to 2050 Using Alternative Projection Scenarios

66
Numeric Change in Population Age 55 and Older in Harris County by Race/Ethnicity in 2010 and Projected to 2050 Using Alternative Projection Scenarios YearNH WhiteNH BlackHispanic NH Asian & Other Total Zero Net Migration 2010-2020110,42258,375133,86731,323333,987 2020-203036,07241,461177,70233,522288,757 2030-204012,73934,444186,62532,833266,641 2040-2050-25,59726,648120,22614,382135,659 2010-2050133,636160,928618,420112,0601,025,044 Net Migration Equal to One-Half 2000-2010 2010-202082,20862,895141,65031,747318,500 2020-20301,88145,196195,18535,507277,769 2030-2040-15,57940,227227,60348,945301,196 2040-2050-40,59933,911213,74645,671252,729 2010-205027,911182,229778,184161,8701,150,194 Net Migration Equal to 2000-2010 2010-202052,73466,253148,01230,684297,683 2020-2030-34,94344,013207,47033,879250,419 2030-2040-47,10335,572250,73463,875303,078 2040-2050-56,25626,828288,72495,718355,014 2010-2050-85,568172,666894,940224,1561,206,194

67
Percent Change in Population Age 55 and Older in Harris County by Race/Ethnicity in 2010 and Projected to 2050 Using Alternative Projection Scenarios YearNH WhiteNH BlackHispanic NH Asian & Other Total Zero Net Migration 2010-202028.444.685.755.045.6 2020-20307.221.961.338.027.1 2030-20402.414.939.927.019.7 2040-2050-4.710.118.49.38.4 2010-205025.655.279.866.358.3 Net Migration Equal to One-Half 2000-2010 2010-202021.148.190.755.743.5 2020-20300.423.365.540.026.4 2030-2040-3.316.846.239.422.7 2040-2050-8.912.229.726.415.5 2010-20506.758.283.374.061.1 Net Migration Equal to 2000-2010 2010-202013.650.794.753.940.6 2020-2030-7.922.368.238.724.3 2030-2040-11.614.849.052.623.7 2040-2050-15.79.737.951.622.4 2010-2050-28.256.985.179.762.2

68
YearNH WhiteNH BlackHispanic NH Asian & Other Zero Net Migration 201053.117.821.37.8 202046.817.727.28.3 203039.517.034.59.0 204033.816.340.39.6 205029.716.644.19.6 Net Migration Equal to One-Half 2000-2010 201053.117.821.37.8 202044.818.428.38.5 203035.618.037.19.3 204028.017.144.210.7 205022.116.649.611.7 Net Migration Equal to 2000-2010 201053.117.821.37.8 202042.819.129.58.6 203031.718.840.09.5 204022.717.548.111.7 205015.615.754.214.5 Population Age 55 and Older in Harris County by Race/Ethnicity in 2010 and Projected to 2050 Using Alternative Projection Scenarios

69
TEXAS EDUCATION

70
Education Level Is Related to Employment and Earnings Source: U.S. Department of Labor, Bureau of Labor Statistics, June 2013/first quarter 2013 70 Unemployment Rate Median Weekly Earnings Median: $827 Overall Unemployment Rate: 7.6%

71
Mean Household Income by Race/Ethnicity, Educational Attainment, and Occupation In Texas in 2010 Occupations Less Than High School /GED Bachelor's Degree Graduate/ Prof Degree NH White Managerial & Professional$ 72,446$ 84,504$ 120,792$ 149,819 Technical, Sales, & Admin. 52,930 64,179 112,843 130,471 Precision Prod., Craft, & Repairers 55,079 68,247 94,875 119,057 Operatives and Laborers 48,819 61,211 77,581 89,720 Total 50,533 64,975 114,698 144,714 NH Black Managerial & Professional$ 47,483$ 52,186$ 84,758$ 99,073 Technical, Sales, & Admin. 33,980 43,933 75,416 80,852 Precision Prod., Craft, & Repairers 42,767 53,192 82,885 69,805 Operatives and Laborers 37,811 46,296 66,181 63,707 Total 31,072 42,465 78,933 94,490 Hispanic Managerial & Professional$ 52,178$ 61,992$ 88,036$ 116,400 Technical, Sales, & Admin. 40,131 50,127 81,005 91,155 Precision Prod., Craft, & Repairers 42,302 51,527 63,695 63,345 Operatives and Laborers 41,273 47,455 54,282 57,806 Total 38,221 47,760 81,548 108,473 NH Asian & Other Managerial & Professional$ 84,172$ 73,016$ 103,737$ 130,603 Technical, Sales, & Admin. 52,764 60,719 86,039 105,469 Precision Prod., Craft, & Repairers 54,594 63,451 70,778 92,041 Operatives and Laborers 47,939 49,015 60,895 65,074 Total 50,815 55,496 93,474 123,035 Source: Ruggles et al. 2010; U.S. Census Bureau, American Community Survey 2010 Public Use Microdata Sample, 2011.

72
Percent of Population 25 Years of Age and Older in Texas Who Are High School Graduates and Higher or College Graduates and Higher by Race/Ethnicity, 1990-2010 Educational Attainment Level NH White*NH Black Hispanic NH Asian & OtherTotal 1990 High School and Higher81.566.244.679.172.1 College and Higher25.212.07.341.320.3 2000 High School and Higher87.275.849.380.775.7 College and Higher30.015.38.947.823.2 2010 High School and Higher92.086.459.687.180.7 College and Higher34.119.711.646.025.9 * NH refers to Non-Hispanic; values for categories labeled NH are only for the Non-Hispanic persons in each race category. Hispanic includes Hispanics of all races. Source: U.S. Census Bureau, 2010 American Community Survey, Census 2000, Summary File 3, Census of Population and Housing, 1990: Summary Tape File 3, 2012, 2002, 1990, 1991.

73
General Revenue Expenditures (in $2010) for Texas Public Elementary and Secondary Schools, Selected Education Programs, and Public Colleges and Universities, and Percent Change in Expenditures, 2000 and 2010 Expenditures Percent Change 2000-2010 20002010 ProgramTotal Per Student Total Per Student Total Per Student Total Elementary and Secondary$29,237,537,256$7,308$36,491,096,511$7,52724.83.0 Bilingual/ESL747,953,8271,5091,295,663,0241,66273.210.1 Gifted and Talented311,414,735930418,034,6781,13634.222.2 Special Education2,202,643,4054,5134,800,227,93310,779117.9138.8 Career and Technology Education*717,482,3749691,009,165,94298240.71.4 Total Public Colleges and Public Universities3,406,851,6074,079 3,746,005,0912,935 10.0-28.1 Note: Enrollment data based upon 1999-2000 and 2009-10 school years. *Enrollment calculated from percentage distribution. Source: Texas Education Agency, 1999-00, Elementary and Secondary Program Enrollment and expenditures, Academic Excellence Indicator System and 2000-10 State Profile Report; 2009-10 and 1999-00, Public Education Information Management System Budget Report; Texas Higher Education Coordinating Board, 2009-2010 and1999-2000 Public College and University Enrollment Database and 2000 and 2010, An Overview of Article III Senate Bill 1 81st Legislature, 2012.

74
Selected Characteristics of Texas Education 2 nd in Total Student Enrollment [4.9 million students (2010-11)] 1 1 st in Total Student Enrollment Growth [1998-99 to 2008-09 (806,781)] 1 1 st in Hispanic Student Enrollment Growth [1998-99 to 2008-09 (752,272)] 1 42 nd in Instruction and Instruction-Related Expenditures per Pupil ($5,443) 2 43 rd in Total Per Pupil Expenditures ($8,350) 2 28 th in Pupils per Teacher (14.7) 1 28 th in Average Freshman Graduation Rates for public secondary schools, 2008-09 (75.4%) 3 Ranked Last in the Percent of People 25 years and over Who have Completed High School [81.1% (including Equivalency)] 4 30 th in Percent of People 25 Years and Over Who Have Completed a Bachelor’s Degree (26.4%) 5 1 National Center for Education Statistics, The Condition of Education, 2012 2 National Center for Education Statistics, Common Core of Data (CCD), National Public Education Financial Survey, FY 2008. 3 National Center for Education Statistics, 2008-09 Core of Common Data (CCD) 4 American Community Survey, 2011, Table GCT 1501 5 American Community Survey, 2011, Table GCT 1502
![Selected Characteristics of Texas Education 2 nd in Total Student Enrollment [4.9 million students ( )] 1 1 st in Total Student Enrollment Growth [ to (806,781)] 1 1 st in Hispanic Student Enrollment Growth [ to (752,272)] 1 42 nd in Instruction and Instruction-Related Expenditures per Pupil ($5,443) 2 43 rd in Total Per Pupil Expenditures ($8,350) 2 28 th in Pupils per Teacher (14.7) 1 28 th in Average Freshman Graduation Rates for public secondary schools, (75.4%) 3 Ranked Last in the Percent of People 25 years and over Who have Completed High School [81.1% (including Equivalency)] 4 30 th in Percent of People 25 Years and Over Who Have Completed a Bachelor’s Degree (26.4%) 5 1 National Center for Education Statistics, The Condition of Education, National Center for Education Statistics, Common Core of Data (CCD), National Public Education Financial Survey, FY 2008.](http://images.slideplayer.com/34/10272565/slides/slide_74.jpg "3 National Center for Education Statistics, Core of Common Data (CCD) 4 American Community Survey, 2011, Table GCT American Community Survey, 2011, Table GCT")
75
Selected Characteristics of Texas Education (2) 12 th in Percent of People below Poverty Level in the Past 12 Months (18.5%) 6 10 th in Percent of Children below Poverty Level in the Past 12 months (26.6%) 7 41 st in Percent of 18- to 24- Year Olds enrolled in Colleges and Universities (39.6%) 8 46 th in the Percent of Public High School Teachers Teaching with a Major in their Main Assignments (71.9%) 9 Between 2000 and 2010, Texas Student Age Population (Ages 5-17) Grew by a 67,522 People Per Year (or 675,220 between 2000-10) 10 In 2010, 4,937,351 children were of school age (Age 5-17), up from 4,262,131 in 2000 (a 15.8% increase) 10 6 American Community Survey, 2011, Table GCT 1701 7 American Community Survey, 2011, Table GCT 1704 8 United States Education Dashboard, Data Derived from 2006-08 American Community Survey Public Use Microdata Sample (PUMS) data 9 National Center for Education Statistics, Schools and Staffing Survey, 2007-08 10 U. S. Census Bureau, 2000 & 2010 Decennial Census

76
Total Public Education (All Levels) and Public Elementary and Secondary School Enrollment in Texas by Race/Ethnicity in 2010 and Projected to 2050 Using the Projections That Assume 2000–2010 Rates of Net Migration for Texas YearNH a WhiteNH BlackHispanic NH Asian & OtherTotal Total Public Education (All Levels)* 20102,137,393832,2022,805,785348,7916,124,171 20202,109,148874,2943,490,796533,0467,007,284 20302,128,376955,1944,428,574682,1968,194,340 20402,037,8041,028,9975,778,539973,9869,819,326 20501,979,1091,095,3427,207,2061,469,75511,751,412 Public Elementary and Secondary Schools 20101,547,693632,4012,398,684269,0664,847,844 20201,548,792646,7562,917,449406,7555,519,752 20301,577,470706,2633,715,984480,5336,480,250 20401,479,111754,1734,865,439726,4527,825,175 20501,446,198798,1256,012,6771,109,4439,366,443 Source: Projections by the authors and 2010 data and rates derived from Texas Education Agency, Enrollment in Texas Public Schools 2011-2012, 2011; Texas Higher Education Coordinating Board, Demographic Data for Public Community College and University Students for 1980-2010, 2011. * Excludes public health related educational institutions.

77
Percent of Total Public Education (All Levels), Public Elementary and Secondary School Enrollment in Texas by Race/Ethnicity in 2010 and Projected to 2050 Using the Projections That Assume 2000–2010 Rates of Net Migration for Texas YearNH WhiteNH BlackHispanic NH Asian & Other Total Public Education (All Levels)* 201034.913.645.85.7 202030.112.549.87.6 203026.011.754.08.3 204020.810.558.89.9 205016.89.361.312.6 Public Elementary and Secondary Schools 201031.913.049.55.6 202028.111.752.97.3 203024.310.957.37.5 204018.99.662.29.3 205015.48.564.211.9 Source: Projections by the authors and 2010 data and rates derived from Texas Education Agency, Demographic Data for Public School Students for 1980-2010, 2011;Texas Education Agency, Enrollment in Texas Public Schools 2011- 2012, 2011; Texas Higher Education Coordinating Board 2011, Demographic Data for Public Community College and University Students for 1980-2010, 2011. * Excludes public health related educational institutions. Note: Enrollment data based on 2009-10 school years.

78
Total Public Community College, Public University, and Total Public College and University Enrollment in Texas by Race/Ethnicity in 2010 and Projected to 2050 Using the Projection that Assumes 2000-2010 Age and Race/Ethnicity-Specific Net Migration for Texas YearNH White*NH BlackHispanic NH Asian & OtherTotal Public Community Colleges 2010314,976130,786263,60037,261746,623 2020299,721149,167370,86858,999878,755 2030296,231163,939459,61892,6931,012,481 2040297,987181,123590,855117,6431,187,608 2050285,152196,248771,788170,6271,423,815 Public Universities 2010274,72469,015143,50142,464529,704 2020260,63578,371202,47967,292608,777 2030254,67584,992252,972108,970701,609 2040260,70693,701322,245129,891806,543 2050247,759100,969422,741189,685961,154 Total Public Colleges and Universities 2010589,700199,801407,10179,7251,276,327 2020560,356227,538573,347126,2911,487,532 2030550,906248,931712,590201,6631,714,090 2040558,693274,824913,100247,5341,994,151 2050532,911297,2171,194,529360,3122,384,969 * NH refers to Non-Hispanic; values for categories labeled NH are only for the Non-Hispanic persons in each race category. Hispanic includes Hispanics of all races. Source: Projections by the authors; and Texas Higher Education Coordinating Board, 2010 Public College and University Enrollment Database, 2012.

79
Percent of Public Community College, Public University, and Total Public College and University Enrollment in Texas by Race/Ethnicity in 2010 and Projected to 2050 Using the Projection that Assumes 2000-2010 Age and Race/Ethnicity-Specific Net Migration for Texas YearNH White*NH BlackHispanic NH Asian & Other Public Community Colleges 201042.217.535.35.0 202034.117.042.26.7 203029.316.245.49.1 204025.115.349.89.8 205020.013.854.212.0 Public Universities 201051.913.027.18.0 202042.812.933.311.0 203036.312.136.115.5 204032.311.640.016.1 205025.810.544.019.7 Total Public Colleges and Universities 201046.215.731.96.2 202037.715.338.58.5 203032.114.541.611.8 204028.013.845.812.4 205022.312.550.115.1 Note: Enrollment data based upon 2009-10 school years. * NH refers to Non-Hispanic; values for categories labeled NH are only for the Non-Hispanic persons in each race category. Hispanic includes Hispanics of all races. Source: Projections by the authors; and Texas Higher Education Coordinating Board, 2010 Public College and University Enrollment Database, 2012.

80
Percent Change in Projected Number of Students with Financial Need Unmet by Household Resources Enrolled at Public Colleges and Universities in Texas in 2010 and Projected to 2050 Using the Population Projection That Assumes 2000-2010 Rates of Net Migration (1.0 Scenario) YearNH White*NH BlackHispanic NH Asian & Other Total Public Community Colleges 2010-20-4.814.140.758.322.7 2020-30 -1.29.923.957.117.9 2030-400.610.528.626.919.8 2040-50 -4.38.430.645.022.9 2010-50 -9.550.1192.8357.9112.9 Public Universities 2010-20-5.113.641.158.517.9 2020-30 -2.38.424.961.917.3 2030-402.410.227.419.215.9 2040-50 -5.07.831.246.020.9 2010-50 -9.846.3194.6346.793.8 Total Public Colleges and Universities 2010-20-5.013.840.858.420.4 2020-30 -1.89.224.360.017.6 2030-401.610.428.122.318.1 2040-50 -4.78.130.845.622.0 2010-50 -9.748.3193.4351.3104.0 * NH refers to Non-Hispanic; values for categories labeled NH are only for the Non-Hispanic persons in each race category. Hispanic includes Hispanics of all races. Source: Projections by the authors; and Texas Higher Education Coordinating Board, 2010 Financial Aid Database, 2013.

81
Mean Consumer Expenditures in 2010 and Projected for 2050 Under Alternative Assumptions of Socioeconomic Closure Between Minority and NonHispanic White Households

82
Percent of All Households in Poverty in 2010 and Projected for 2050 Under Alternative Assumptions of Socioeconomic Closure Between Minority and NonHispanic White Households

83
Percent Change in Socioeconomic Resources in Texas Compared to Percent Change in Households, 2010-2050 Household Change: 127.6%

84
Percent Change in Socioeconomic Resources Compared to Percent Change in U. S. Households, 2010 - 2060

85
The mark of a truly educated man is to be moved deeply by statistics. George Bernard Shaw

86
FOR MORE INFORMATION INCLUDING PURCHASE INFORMATION, CONTACT: TEXAS A&M PRESS 800-826-8911 FAX: 888-617-2421 WWW.TAMUPRESS.COM OR GO TO: HTTP://THETEXASCHALLENGE.COM/ WWW.TAMUPRESS.COM HTTP://THETEXASCHALLENGE.COM/ 86

87
Steve Murdock Phone: 210-867-4385 E-mail: shm3@rice.edushm3@rice.edu Website: http://hobbycenter.rice.edu

Similar presentations


 Source: U.S. Census Bureau,>")


