Download presentation
Presentation is loading. Please wait.

1
Population Change in Texas: Implications for Human and Socioeconomic Resources in the 21st Century
by Steve H. Murdock Department of Rural Sociology Texas Agricultural Experiment Station Texas A&M University System

2
Major Demographic Trends Affecting the Future
Change in Rates and Sources of Population Growth Increase in the Non-Anglo Population Aging of the Population

3
Total Population Change

4
Total Population and Percent Population Change in Texas and the United States, 1850-2002

5
Ten Fastest Growing States in Numerical Terms in the United States, 1990-2000

6
Ten Fastest Growing States in Percentage Terms in the United States, 1990-2000

7
Ten Largest States in United States by Population Size in 2000 Ranked by Population Size in 2000

8
Racial/Ethnic Change in Texas

9
Texas Rank Among States on Selected Characteristics of Race/Ethnicity Groups

10
Texas Rank Among States on Selected Characteristics of Race/Ethnicity Groups

11
Anglo Population For States in the United States in 1990 and 2000 Ranked by Total Population Size in 2000

12
Texas Rank Among States on Selected Characteristics of Race/Ethnicity Groups

13
Numerical Change in Population by Race/Ethnicity in Texas for 1980-1990 and 1990-2000

14
Percent Change in Population by Race/Ethnicity for 1980-1990 and 1990-2000 in Texas

15
Proportion of Net Population Change Attributable to Each Race/Ethnicity Group in Texas for and

16
Major Changes in Population Composition (Characteristics)
Age

17
Median Age in the United States and Texas, 1900-2000

18
Percent of Texas Population by Age Group and Ethnicity, 2000

19
Percent of Texas Population by Age Group and Ethnicity, 2040*

20
POPULATION CHARACTERISTICS AND SOCIOECONOMIC CONDITIONS

21
Median Household Income in 1999 in Texas by Age of Householder
Thousands

22
Median Household Income In 1999 in Texas by Race/Ethnicity of Householder

23
States Ranked by Median Household Income in 1999

24
States Ranked by Per Capita Income in 1999

25
Educational Attainment in 2000 in Texas for Persons 25+ Years of Age By Race/Ethnicity
Percent

26
States Ranked by Percent High School Graduates + in the Population 25 Years of Age or Older, 2000

27
States Ranked by Percent College Graduates + in the Population 25 Years of Age or Older, 2000

28
PROJECTIONS

29
Population in Texas by Race/Ethnicity in 2000 and Projections of the Population in Texas by Race/Ethnicity from 2010 to 2040

30
Percent Change for Selected Time Periods for Projected Population in Texas by Racial/Ethnic Status Under Alternative Assumptions of Migration Scenarios

31
Percent of Population in Texas by Race/Ethnicity in 2000 and Projections of the Percent of the Population in Texas by Race/Ethnicity from 2010 to 2040

32
Projected Proportion of Population by Race/Ethnicity in Texas, 2000-2040*
* Using U.S. Census count for 2000 and Texas State Data Center 1.0 population projection scenario for

33
Percent of the Projections of the Population by Race/Ethnicity and Age Groups in Texas from Under Alternative Migration Scenarios

34
Projected Percent of Net Change Attributable to Each Race/Ethnicity Group in Texas for 2000-2040*
* Using U.S. Census count for 2000 and Texas State Data Center 1.0 population projection scenario for 2040.

35
The Texas Challenge in the Twenty-First Century: Implications of Population Change for the Future of Texas by Steve H. Murdock The Center for Demographic and Socioeconomic Research and Education Department of Rural Sociology Texas A&M University System The Center for Demographic and Socioeconomic Research and Education

36
Ethnic Diversity of the Population, Householders, and Labor Force in Texas, 2000 and 2040*
Proj_pop-hhdr-lf_6pie.pr4

37
Ethnic Diversity of the Population Enrolled in Elementary and Secondary Schools and Colleges in Texas, 2000 and 2040* Proj_Ed-Enrol_4pie.pr4

38
Ethnic Diversity of Household Income and Consumer Expenditures in Texas, 2000 and 2040*
Proj_Inc-Exp_4pie.pr4

39
State Tax Revenues in Texas Proportioned by Race/Ethnicity in 2000 and Projections to 2040* Assuming 2000 Decile Tax Rates *Projections are shown for the 1.0 scenario

40
Projected Percent of Labor Force by Educational Attainment in Texas, 2000 and 2040

41
Average Household Income in Texas, 2000-2040* (in 2000 Dollars)
")
42
Projected Percent of Households in Poverty by Family Type in Texas, 2000 and 2040

43
EDUCATION

44
Percent Change in Enrollment in Texas Public Elementary and Secondary Schools, and Total Public Colleges and Universities by Race/Ethnicity,

45
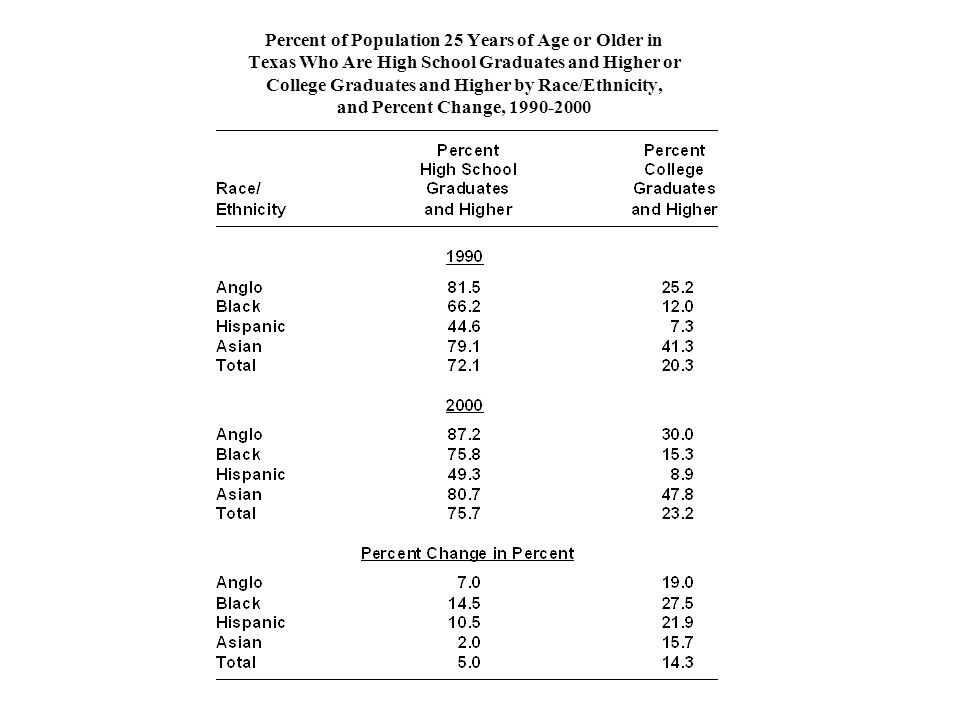
Percent of Population 25 Years of Age or Older in Texas Who Are High School Graduates and Higher or College Graduates and Higher by Race/Ethnicity, and Percent Change,
46
Public Community College and University Enrollment Rates (Per 100 Persons Ages 18 to 35) in Texas by Race/Ethnicity, 1990 and 2000

47
Enrollment in Public Community Colleges and Public Universities in Texas, 2000-2040*
Bev Table 7.4

48
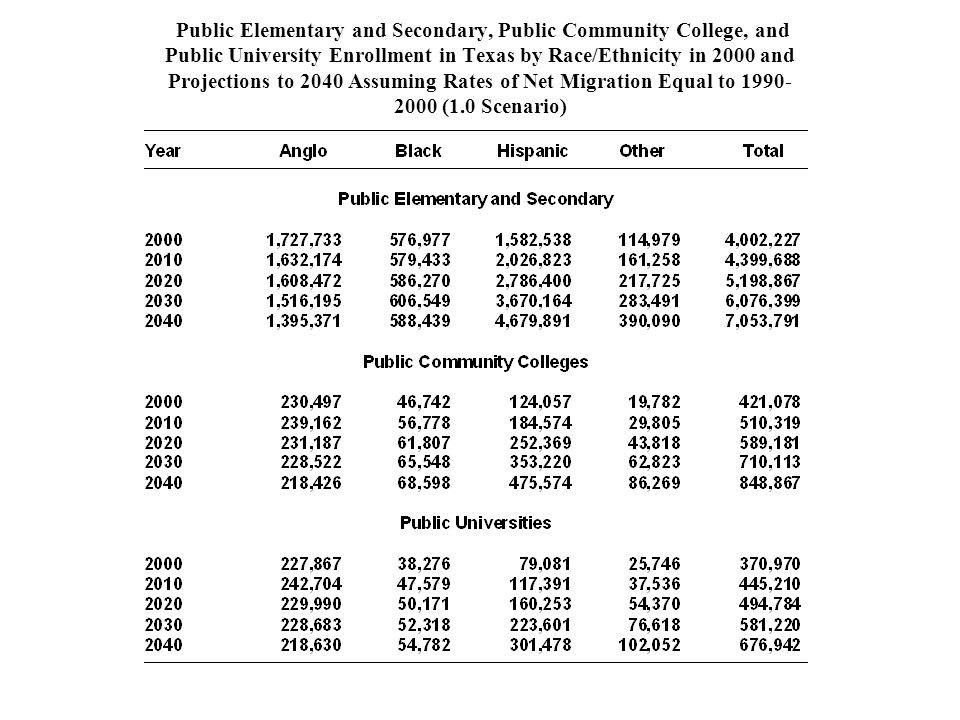
Public Elementary and Secondary, Public Community College, and Public University Enrollment in Texas by Race/Ethnicity in 2000 and Projections to 2040 Assuming Rates of Net Migration Equal to (1.0 Scenario)
49
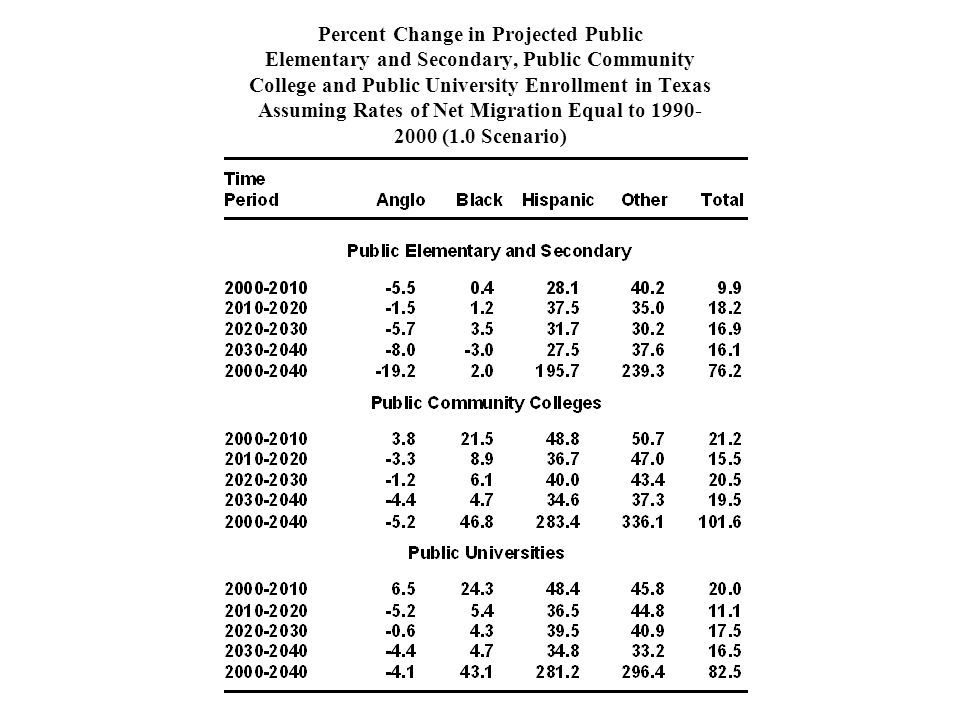
Percent Change in Projected Public Elementary and Secondary, Public Community College and Public University Enrollment in Texas Assuming Rates of Net Migration Equal to (1.0 Scenario)
50
Projected Percent of Public Community College Enrollment by Race/Ethnicity in 2000 and Projections for 2040* Bev tab b

51
Projected Percent of Public University Enrollment by Race/Ethnicity in 2000 and Projections for 2040* Bev tab

52
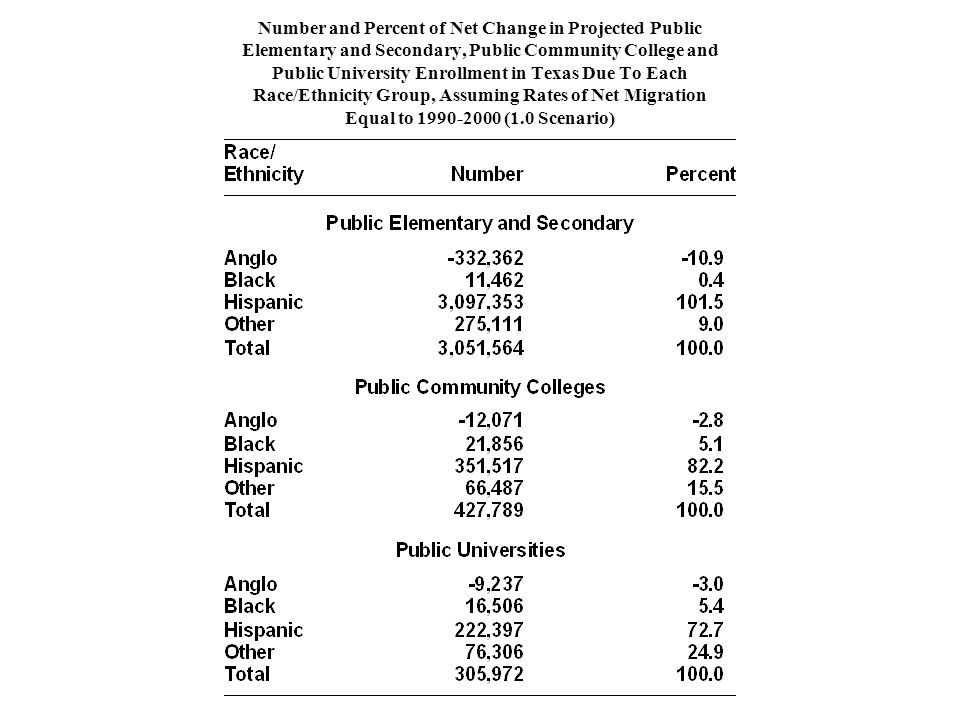
Number and Percent of Net Change in Projected Public Elementary and Secondary, Public Community College and Public University Enrollment in Texas Due To Each Race/Ethnicity Group, Assuming Rates of Net Migration Equal to (1.0 Scenario)
53
Average Annual Household Income in the United States
by Educational Attainment* in 2000 *From March 2001 Current Population Survey

54
Lifetime Household Income in the United States
by Educational Attainment* in 2000 *From March 2001 Current Population Survey

55
Working Lifetime (40 Years) Consumer
Expenditures by Educational Attainment (in 2000 Dollars)
")
56
Working Lifetime (40 Years) Total State and Local Taxes for
Households by Educational Attainment of Householder (in 2000 Dollars)
")
58
Percent of Persons 25 Years of Age or Older by Level of Educational Attainment and Race/Ethnicity in 2000 and Projected to 2040* Assuming Trends in Educational Attainment Rates

59
Aggregate Income and Consumer Expenditures for Population 25 Years of Age or Older in Texas in 2000 and Projected Under Alternative Educational Attainment Assumptions for 2040*

60
Percent Change in Projected Aggregate Income and Consumer Expenditures for Population 25 Years of Age or Older in Texas Under Alternative Educational Attainment Assumptions, 2000 to 2040*

61
Prison Population and Prison Costs for Population 25 Years of Age or Older in Texas in 2000 and Projected Under Alternative Educational Attainment Assumptions for 2040*

62
Medicaid Participants and Medicaid Costs for Population 25 Years of Age or Older in Texas in 2000 and Projected Under Alternative Educational Attainment Assumptions for 2040*

63
TANF Participants and TANF Costs for Population 25 Years of Age or Older in Texas in 2000 and Projected Under Alternative Educational Attainment Assumptions for 2040*

64
Food Stamp Participants and Food Stamp Costs for Population 25 Years of Age or Older in Texas in 2000 and Projected Under Alternative Educational Attainment Assumptions for 2040*

65
Percent Change in Projected Prison, TANF, Food Stamp, and Medicaid Participants and Costs for Population 25 Years of Age or Older in Texas Under Alternative Educational Attainment Assumptions, 2000 to 2040*

66
Texas State Data Center
Steve Murdock Texas State Data Center Phone (CS) Phone (AUS) Fax Website txsdc.tamu.edu
 Phone (AUS) Fax Website txsdc.tamu.edu.")
Similar presentations


 Demographic Highlights TEXAS is: big. The population.>")


. Statistics.>")


