Download presentation
Presentation is loading. Please wait.

1
What is the Carbon and Ecological Shoe Size of Your Facility? Amy K Coplen, Margie Marley and Jack Mizner Sandia is a multiprogram laboratory operated by Sandia Corporation, a Lockheed Martin Company, for the United States Department of Energy’s National Nuclear Security Administration under contract DE-AC04-94AL85000. Source: http://www.panda.org/news_facts/publications/living_planet_report/index.cfm

2
Introduction The purpose of this workshop is to explore the process of quantifying greenhouse gas (GHG) emissions and calculating the carbon footprint and ecological footprint of a large, industrial government facility.
 emissions and calculating the carbon footprint and ecological footprint of a large, industrial government facility.")
3
Overview Background on greenhouse gas (GHG) inventories, ecological and carbon footprints Examples of GHG inventory software and footprint calculators The Baseline Ecological Footprint of Sandia National Labs Introduction to the user model to calculate the carbon and ecological footprint of a facility Skills and tools to complete your own calculation
 inventories, ecological and carbon footprints Examples of GHG inventory software and footprint calculators The Baseline Ecological Footprint of Sandia National Labs Introduction to the user model to calculate the carbon and ecological footprint of a facility Skills and tools to complete your own calculation")
4
GHG Inventories and Ecological and Carbon Footprints Benefits of footprinting and of creating a GHG inventory. Comparison between a GHG inventory and a footprint

9
Defining Ecological and Carbon Footprints CO 2 Land Carbon Footprint: the area of biologically productive land and water needed to absorb carbon dioxide released by burning fossil fuels. Ecological Footprint: the area of biologically productive land and water needed to provide ecological resources and services – food, fibre, and timber, land on which to build, in addition to the Carbon Footprint.

10
An Overview of the Ecological Footprint Concept A measure of human demand on nature Compares consumption of natural resources with the Earth's regeneration capacity Estimates the land area required to support the resource consumption, greenhouse gas (GHG) emissions, and waste generation of a population
 emissions, and waste generation of a population")
11
Why Measure Ecological Footprints? Source: WWF Living Planet Report 2006 Humanity exceeded the carrying capacity of the Earth in the 1980s, and has been incurring an ecological deficit ever since. Earth’s Biocapacity: the amount of biologically productive area – cropland, pasture, forest, and fisheries – that is available to meet humanity’s needs.

12
Ecological Footprint of Countries - 2003 U.S. Ecological Footprint of Countries – 2003 World Average China

13
All Ecological Footprint of Countries – 2005 U.S. China World Average

14
Ecological Footprint of Countries - 2005

15
Generic Ecological Footprint Models The Average American’s Ecological Footprint Source: http://www.myfootprint.orghttp://www.myfootprint.org

17
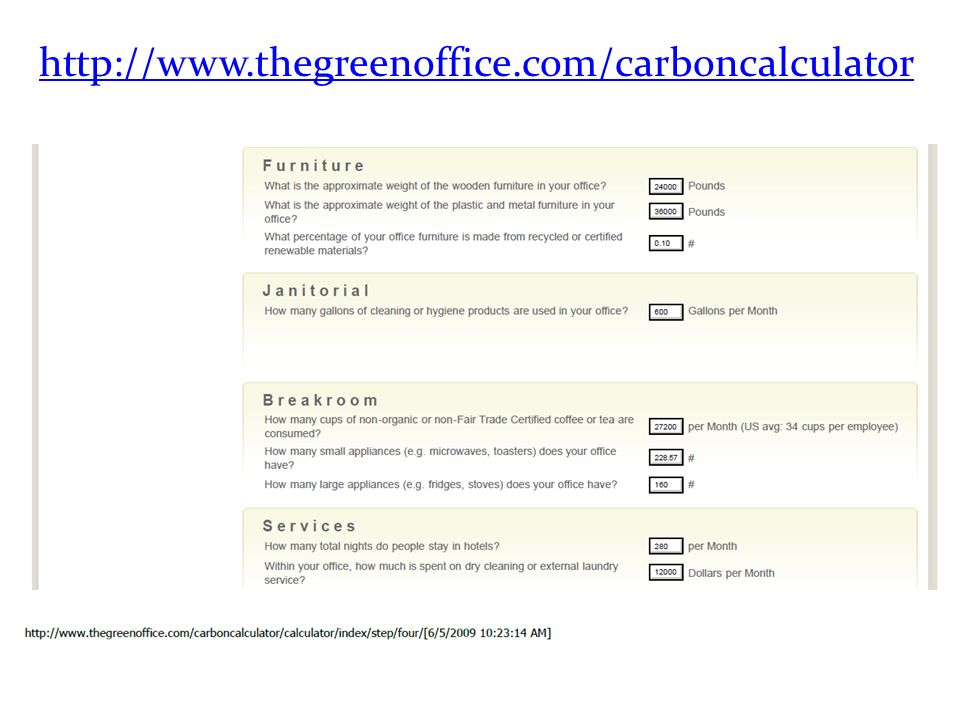
http://www.thegreenoffice.com/carboncalculator
18
GHG Inventory Software and Calculators ICLEI’s Clean Air and Climate Protection Software Software for the 2006 IPCC Guidelines ghgTrack Software HIS Greenhouse Gas Suite ESS GHG/Carbon Management Solution™ California Climate Action Registry - CARROT

19
The Baseline Ecological Footprint of Sandia National Labs

20
Geographical Boundaries

21
General SNL/NM Site Statistics 8,600 acres of total landholdings 5,600 acres of DOE property 2,900 acres of US Air Force property 10,000 MOWs Over 700 government-owned buildings 5.4 million gross ft 2 of building space

22
Analysis Methodology Based on methodology developed by Mathis Wackernagel and William Rees Determine contributions to the ecological footprint Develop calculation methods specific to each category

23
Sandia’s Ecological Footprint

24
Carbon Footprint Methodology 1.Determine Total CO 2 E Emissions 2.Convert Emissions into an Area in Global Hectares (gha) 3.Express Findings in gha and Local Hectares (lha) CO 2 E = Carbon dioxide equivalent (includes N2O and CH4 based on their corresponding global warming potentials gha = global hectare (1 ha of the Earth’s average bioproductive land) lha = local hectare (1 ha of the average bioproductive land on the SNL/NM campus) 1ha = 2.47 acres = 107,639 ft 2
 3.Express Findings in gha and Local Hectares (lha) CO 2 E = Carbon dioxide equivalent (includes N2O and CH4 based on their corresponding global warming potentials gha = global hectare (1 ha of the Earth’s average bioproductive land) lha = local hectare (1 ha of the average bioproductive land on the SNL/NM campus) 1ha = 2.47 acres = 107,639 ft 2")
25
Global Hectares – The Details The world’s average forest has an absorption capacity of 0.192 hectares per metric ton of CO 2 per year. Since not all land is as productive as a forest, we multiply by an equivalence factor of 1.17gha/ha to compensate for bio-productive inequalities. CO 2 E = Carbon dioxide equivalent (includes N 2 O and CH 4 based on their corresponding global warming potentials gha = global hectare (1 ha of the Earth’s average bioproductive land) 1ha = 2.47 acres = 107,639 ft 2 CO2, N2O and CH4 emissions Average Forest Absorption Capacity Equivalence Factor Footprint in Global Hectares
 1ha = 2.47 acres = 107,639 ft 2 CO2, N2O and CH4 emissions Average Forest Absorption Capacity Equivalence Factor Footprint in Global Hectares.")
26
Local Hectares – The Details Carbon sequestration was converted into CO 2 sequestration potentials, which were multiplied by the percentages of corresponding land types to yield an average CO 2 sequestration potential for the local landscape. As with the average global sequestration potential, the local sequestration potential was multiplied by the CO2E emissions to yield a footprint in local hectares. lha = local hectare (1 ha of the average bioproductive land on the SNL/NM campus) 1ha = 2.47 acres = 107,639 ft 2 Average local CO2 Sequestration CO2, N2O and CH4 emissions Footprint in Local Hectares
 1ha = 2.47 acres = 107,639 ft 2 Average local CO2 Sequestration CO2, N2O and CH4 emissions Footprint in Local Hectares.")
27
History of the Model Amy invents the “wheel” – January 2009 - Baseline Ecological Footprint of Sandia National Laboratories, New Mexico Jack thinks we should produce a lot of “wheels” – February 2009 - Take the baseline and create a model that will allow the site inputs to change Margie builds the factory and begins production – May 2009 - Excel skills applied over and over and over again to create a working model

28
Introduction to the Model Baseline equations previously verified and validated Developed worksheets to capture distilled inputs Segregated information within each worksheet – Inputs can be modified for a different year/same site or a different site – Constants and coefficients – Calculations – Output Output checked against original calculations results

29
Model Contents 56 possible site input variables 64 constant values including unit conversions 72 calculations using some similar inputs and constants Outputs – 5 Tables and 4 Graphs

30
Model Input - Groups 1.Land 2.Energy 3.Transportation 4.Waste

31
Calculate carbon dioxide equivalent (CO 2 E) emissions and convert into the land area required to sequester those emissions Land Use Energy Use NM Grid Electricity Hydroelectricity Biomass Electricity Solar Electricity Natural Gas Transportation Commuting Fleet Vehicles Airline Travel Rental Cars Waste Waste Transportation Landfill GHG Emissions Ecological Footprint Inputs
 emissions and convert into the land area required to sequester those emissions Land Use Energy Use NM Grid Electricity Hydroelectricity Biomass Electricity Solar Electricity Natural Gas Transportation Commuting Fleet Vehicles Airline Travel Rental Cars Waste Waste Transportation Landfill GHG Emissions Ecological Footprint Inputs")
32
Data Gathering - Sources Sandia Organizations Facilities Energy Management Human Resources MOW survey Fleet Services Air Quality Compliance Treasury and Travel Energy Information Administration (EIA) www.fueleconomy.gov Bureau of Transportation Statistics – www.bts.gov Literature - Sharing Nature’s Interest
 Bureau of Transportation Statistics – Literature - Sharing Nature’s Interest")
33
Worksheets Worksheets were used to compile the gathered information and identify which values are inputs for the model: Land Energy Transportation Waste - WARM Results

34
Waste Carbon Footprint EPA’s Waste Reduction Model Material Life Cycle Source: http://www.epa.gov/climatechange/wycd/waste/downloads/chapter1.pdf WARM Captures: GHG emissions Sinks Emission offsets

35
WARM Results Output data from WARM Recycling helps reduce GHG emissions. Commodity Tons* Recycled Tons* Landfilled Total MTCO2E ** Aluminum Cans2-(27) Steel Cans6-(10) Corrugated Cardboard290-(902) Phonebooks4-(12) Dimensional Lumber283-(696) Mixed Paper, Office168-(572) Mixed Metals1,268-(6,665) Mixed Plastics6-(8) Mixed Recyclables309-(899) Mixed MSWNA11,04017,552 Carpet3-(24) Personal Computers29-(64) Concrete4,159-(32) Tires5-(9) Total17,57011,0407,632
 Steel Cans6-(10) Corrugated Cardboard290-(902) Phonebooks4-(12) Dimensional Lumber283-(696) Mixed Paper, Office168-(572) Mixed Metals1,268-(6,665) Mixed Plastics6-(8) Mixed Recyclables309-(899) Mixed MSWNA11,04017,552 Carpet3-(24) Personal Computers29-(64) Concrete4,159-(32) Tires5-(9) Total17,57011,0407,632.")
36
Tips on Making Estimations No local sequestration potentials No fuel type data for fleet No Human Resource data on telecommuters, carpools, bus riders, etc. Use best and worst case scenarios to bracket possible results

37
Sample of Constants Established Values and Coefficients Atomic Mass Global Warming Potential (GWP) Gross Heat of Combustion Emissions Factors Literature – Sharing Natures Interest Global Sequestration Land Sequestration Ratio Land Equivalence Factor Unit conversions Areas English to Metric Energy Volume Mass Time
 Gross Heat of Combustion Emissions Factors Literature – Sharing Natures Interest Global Sequestration Land Sequestration Ratio Land Equivalence Factor Unit conversions Areas English to Metric Energy Volume Mass Time")
38
Land Use Footprint Total Developed Land Area 873 acres (353 lha) lha = local hectare (1 ha of the average bioproductive land on the SNL/NM campus) 1ha = 2.47 acres = 107,639 ft 2
 lha = local hectare (1 ha of the average bioproductive land on the SNL/NM campus) 1ha = 2.47 acres = 107,639 ft 2")
39
Sample Model Calculation - Energy Grid Electricity CO 2 E = Carbon dioxide equivalent (includes N2O and CH4 based on their corresponding global warming potentials CH4 Emissions N2O Emissions CO2 Emissions N2O GWP CH4 GWP Grid Electricity Consumption CO2E Emissions

40
Sample Model Calculation - Energy Grid Electricity CO 2 E = Carbon dioxide equivalent (includes N2O and CH4 based on their corresponding global warming potentials Input Constant Input

41
Incorporation of Renewable Energy Hydroelectricity ~ 700 gha Solar ~ -108 gha Biomass Renewable Energy Certificates (RECs) ~ -2,047 gha
 ~ -2,047 gha")
42
Outputs Output – Independently checked by calculating the output using separate methods. Model Demonstration

43
Class Exercise

44
Questions? Amy K Coplenakcople@sandia.govakcople@sandia.gov Margie Marleymmarle@sandia.govmmarle@sandia.gov Jack Miznerjhmizne@sandia.govjhmizne@sandia.gov

Similar presentations


 that would be required to sustainably provide for a specific population’s resources and assimilate its.>")


>")


>")