Download presentation
Presentation is loading. Please wait.

1
Equilibrium in the Biosphere

2
Week 2 Bio 20 Cyber High

3
Ecology Study of the interactions between organisms and their physical environment and with each other.

4
Biosphere the part of the earth that is inhabited by organisms. 3 parts: 1Lithosphere Land 2Hydrosphere water 3Atmosphere The gasses that surround the Earth.

5
Living vs. Non-living There are two factors which make up the biosphere. Biotic Factors Living components of the biosphere plants and animals… Abiotic Factors Non-living components of the biosphere minerals, water, weather...

6
Interactions Within the Biosphere Abiotic vs Biotic When a non-living factor affects a living factor. i.e. The weather affecting a living organism Biotic vs. Biotic When a living factor affects another living factor. i.e. Two organisms fighting for the same food. Biotic vs. Abiotic Abiotic vs. Abiotic

7
Levels of Organization

8
Levels of organization Cell Tissue Organ System Organism Population Community Ecosystem Biosphere Biome

9
Hierarchical Levels within the Biosphere Biosphere Ecosystem Community Population Organism World Lake or River Lots of different species of organisms Lots of same species of fish Fish

10
Important Definitions Population: group of individuals of the same: species, place & time Community : populations of all species in an area Ecosystem : community and its biotic and abiotic factors Interactions Biome : large scale ecosystems Can be found around the world tundra, grassland

11
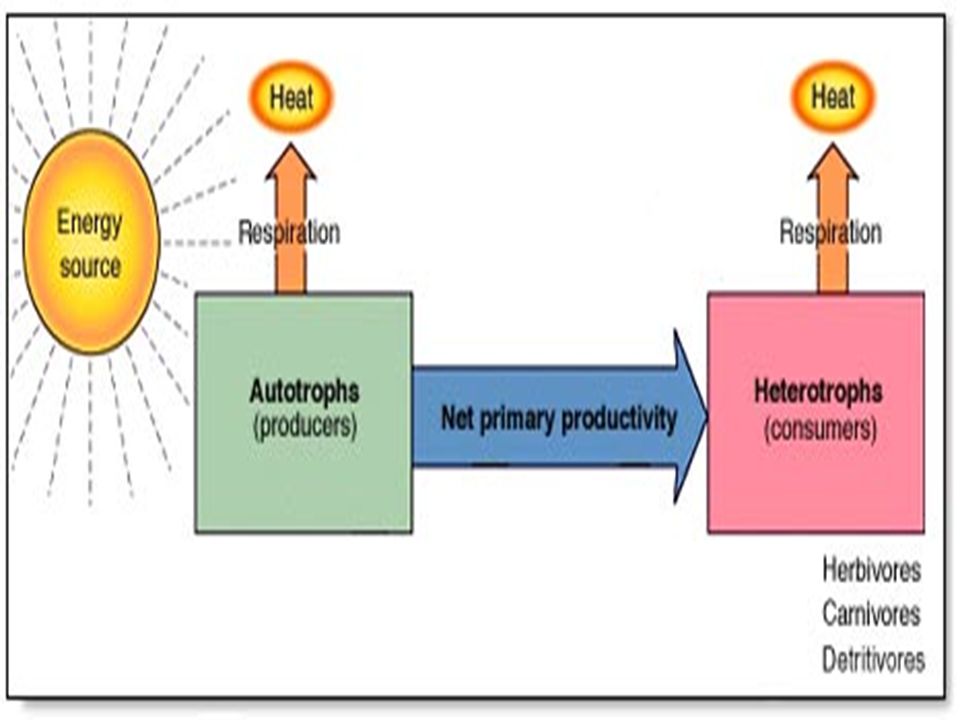
General Terms Autotroph Producer Photosynthesis Light energy used to make organic compounds (glucose) Done by chloroplast containing organisms (plants, algae) Chemosynthesis Energy released by chemical reactions to make a sugar Oxidizing hydrogen sulfide or methane Done by bacteria in extreme environments (deep sea vents, hot springs)
 Done by chloroplast containing organisms (plants, algae) Chemosynthesis Energy released by chemical reactions to make a sugar Oxidizing hydrogen sulfide or methane Done by bacteria in extreme environments (deep sea vents, hot springs)")
12
Heterotroph Consumer A Primary consumer eats a producer A Secondary consumer eats a primary consumer A Tertiary consumer eats a secondary consumer… More General Terms

13
Herbivore An organism that only eats plants. Rabbit, squirrel Carnivore An organism that only eats animals. Wolf, Lion, Tyrannosaurus Rex Omnivore An organism that eats both plants and animals. Bear, Human More General Terms

14
Scavenger An organism that feeds on dead organisms or the wastes of organisms. Vulture, Seagull, Decomposer An organism that breaks down organic wastes and the remains of dead organisms into simpler compounds such as: carbon dioxide ammonia Water

16
Input energy Biogeochemical Cycles Energy Lost Ecosystems are OPEN SYSTEMS. Energy and matter can flow in and out of system

17
Food chains Food Chain A linear illustration that represents the step sequence of who eats whom in the biosphere. used to show: energy transfers Two Types Grazer: plant, herbivore, carnivore Detritus: organic waste, scavengers, decomposers

18
Food chains Characteristics: Energy is transferred from organism to organism Each time energy is transferred about 90% is lost as heat or used for life processes Lost as heat during cellular respiration, stored in an unusable form, metabolized by the organism itself for ATP to live

19
Food Chain Note that: the arrow points at the eater the arrows separate trophic (eating) levels
 levels")
20
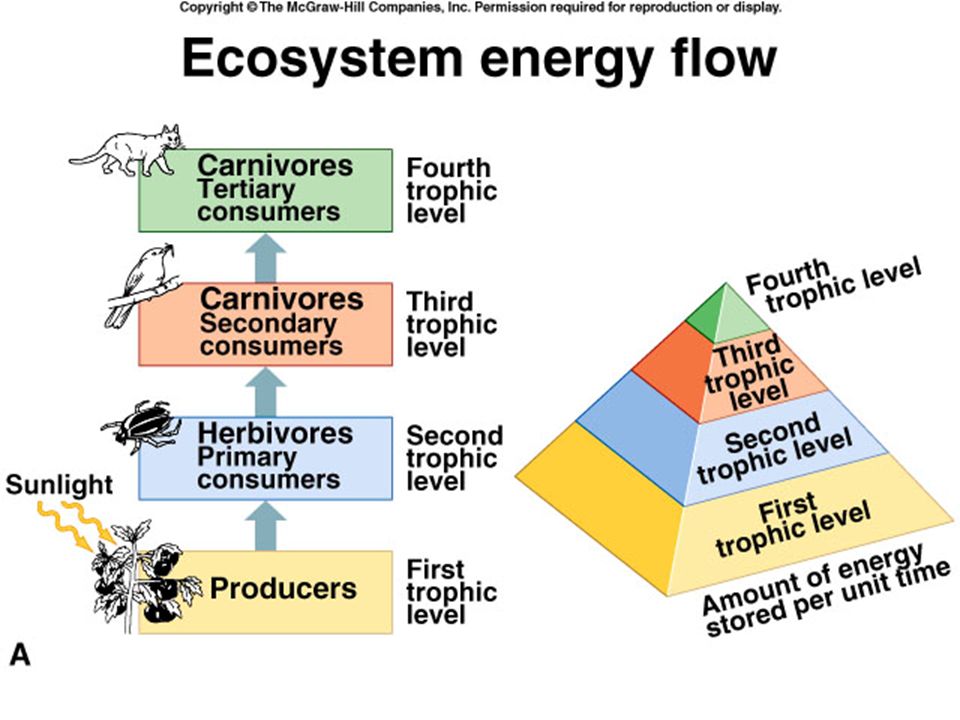
Trophic Levels Trophic level: how far an organism is from the original energy source Plants – first trophic level Original energy is from the sun When an organism is ingested by another, energy is transferred Plant – mouse – owl Producer – primary consumer – secondary consumer (top carnivore) T1 – T2 – T3
 T1 – T2 – T3")
22
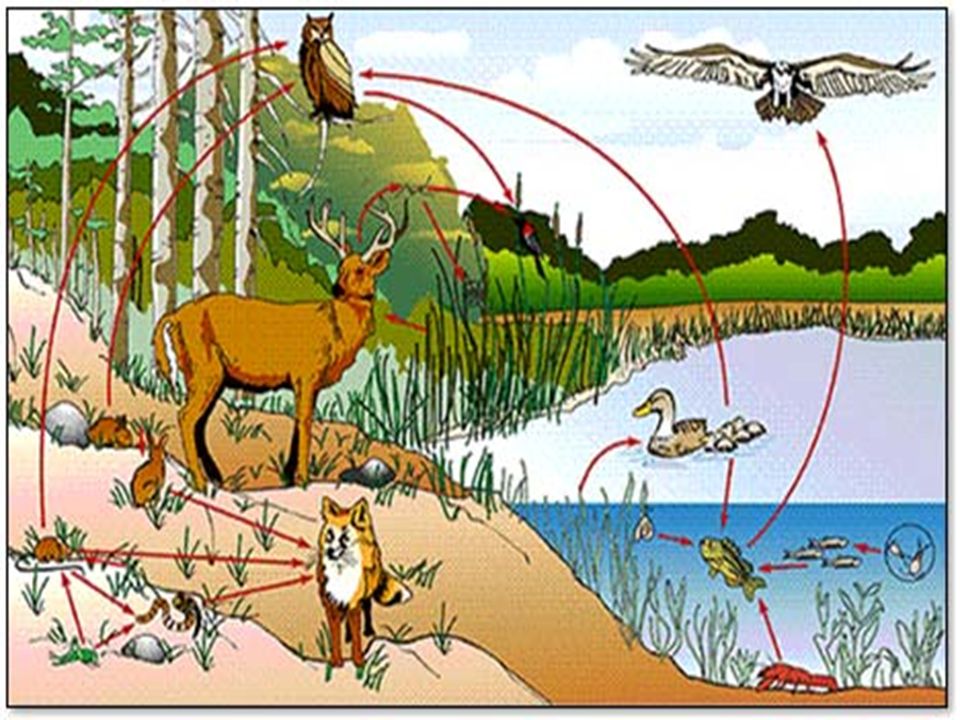
Food Webs What would happen if we relied on deer for our food? In reality, a consumer relies on more than one food source If one source is scarce, consumer can eat more of something else Food web: a series of interlocking food chains more accurately represents energy pathways who eats whom… really

23
Food Web ABCD represent different trophic levels. Level D represents the decomposers

27
Laws of Thermodynamics Biosphere requires a constant flow of energy Energy flows one way through the biosphere following basic scientific principles called the laws of thermodynamics

28
Laws of Thermodynamics Energy can be changed in form, but not created or destroyed. (Law of conservation of energy) Energy input = Energy Output First Law
 Energy input = Energy Output First Law.")
29
Second Law Any energy change results in loss of energy as heat Energy input desired energy + waste energy

30
Energy Flow About 10% of the energy is transferred from one trophic level to the next.

31
During any change, some of the energy is lost as waste energy or heat. Applied to an ecosystem, as energy flows through the community there is energy loss at each trophic level. Much of this loss is in the form of heat which is lost when food molecules are broken down in the cells. There would be less energy loss in the community if consumers only fed on producers

33
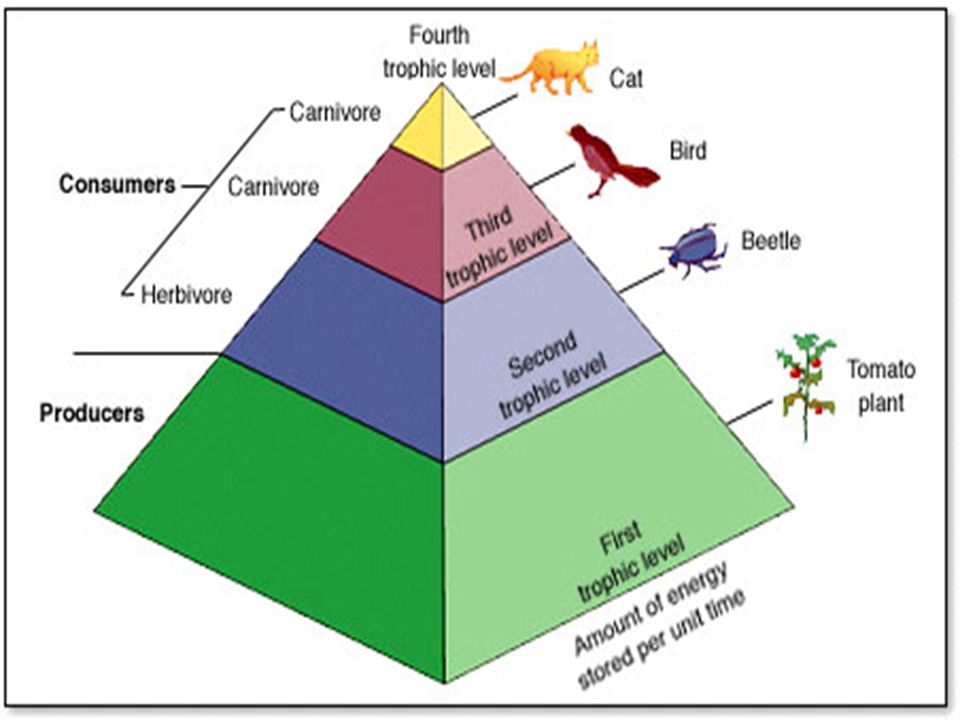
Ecological Pyramids Ecological pyramids illustrate the energy loss through the trophic levels Solar radiation transformed in plants Plants create chemical energy Plant eaten by consumer Energy lost at each transformation Higher trophic level = less energy available Number of trophic levels limited b/c of loss of energy

34
Ecological Pyramids In ecological pyramids, Base -the producer populations Next Level - the primary consumers Higher levels and above -the secondary, tertiary etc.

36
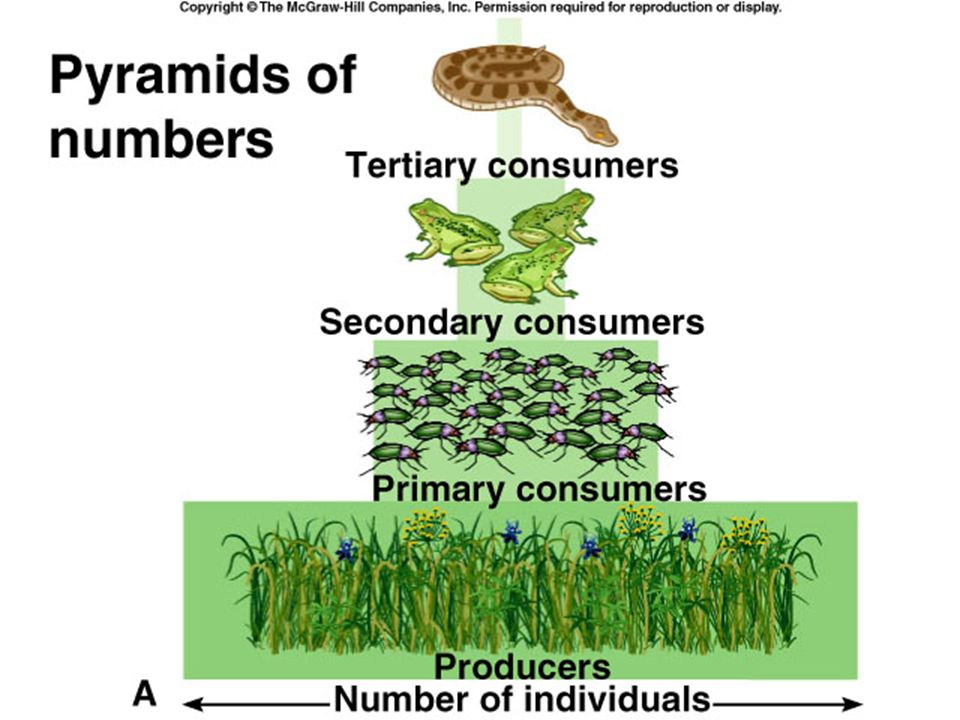
Ecological Pyramids Three types: Numbers: total number of organisms in each trophic levels Biomass: mass of dry tissue of organisms at each trophic level shows how mass decreases as you move up the food chain Energy: based on energy produced at each trophic level

37
Energy Pyramids

38
Pyramid of Numbers

41
Pyramid of Biomass

42
Human Interference in the Ecosystem Pesticides used to kill pests mosquitoes - malaria pesticides in food chain accumulate at each level causes loss of diversity.

43
Example DDT: dichloro diphenyl trichloroethane developed as a biological weapon in WWII 1950’s - used as a pesticide for insects

45
DDT also affects human populations found in breast milk came from sprayed crops animals that ate crops Banned in Canada and US in 1970’s Not banned in other areas - Mexico, Central America Continues to be produced as a cheap pesticide in poorer nations

46
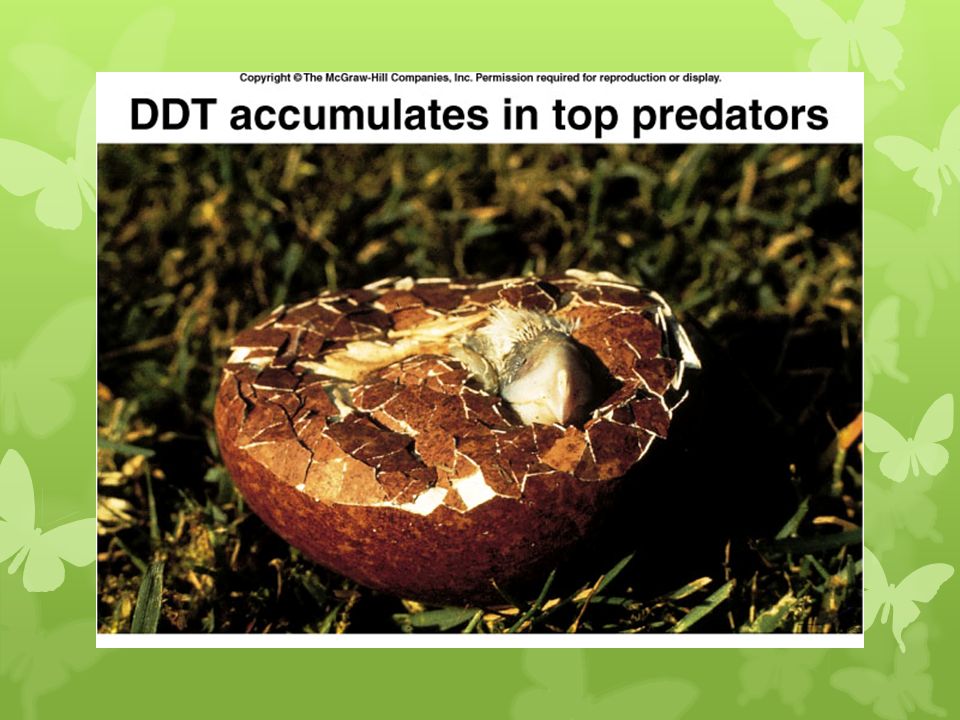
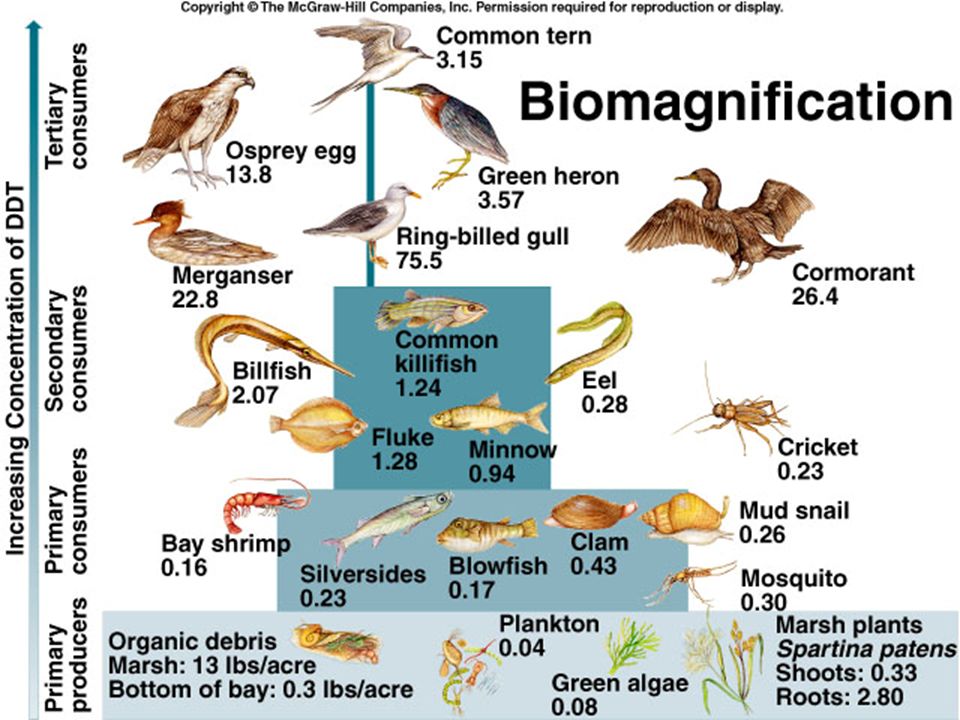
Biological amplification Pesticide concentration builds up at the top level of the pyramid toxins accumulate in fatty tissue not released in wastes Magnifies each time you move up higher trophic level - higher concentration

Similar presentations