Download presentation
Presentation is loading. Please wait.

1
System Performance Monitoring at RBC Craig Hodgins zSeries Performance Engineer Royal Bank of Canada

2
RBC Configuration 17 production LPARS in 3 Centres 9 test LPARS Performance teams for – IMS – DB2 – WAS – MQ – System Capacity Planning team

3
What is performance? Performance tuning is all about making hard choices as painless as possible so that more important work is given priority at the expense of less important work.

5
Best Practices “How is the system performing?” – What does that mean? How do you prove your case? – Gather the required data, summarize your findings, and present the results. – Is a resource being measured or is a workload being measured? Use detailed reports and graphs as back up to your analysis. Always tell a story as it helps make a point. Theory

6
Systems Team Role responsible for overall system performance monitor system health and diagnose performance issues identify performance issues via alerts and RMF monitoring work with other teams to resolve issues Work with vendors (IBM)
")
7
Tools SMF RMF WLM Strobe Omegamon MS Excel MXG Tivoli Decision Support SAS REXX zOSMF

8
Methodology Real time problem resolution – Alerts – RMF / Omegamon – RMF extracts Historical investigation – SMF extracts – RMF extracts

9
Email Alerts Types of alerts – CPU utilization (real-time) – CPU delays (previous day) – storage delays (previous day) – I/O response time (previous day) Contents of Email “P5KFIBR3 JOB58370 USING 89.1 %CPU. PLS NOTIFY TASK OWNER” – Contains a link to RMFDDS report http://TNET:8803/gpm/reports/PROCU?resource=,THPF,MVS_IMAGE&range= 20160127063202,20160127063202

10
RMF DDS Report

11
Omegamon Data CSECT Analysis: INSP + Current sampling options: + JOB(P5KFIBR3) ASID is 831 Sampling is active + NOLIMIT INTERVAL(10) + Samples taken = 907; samples used = 907 -icpu TCB(8) LMOD(L5RXTBL) CSECT($PRIVATE) OFF(0) GR(230) HOT +<.: %CPU Utilization (CSECT) |----+---20---+---40---+---60---+---80---+---100 + 2EF0A230 +000230 78.37 |==========================> + 2EF0AD20 +000D20 14.95 |======> + 2EF0A000 +000000 6.67 |==>
 ASID is 831 Sampling is active + NOLIMIT INTERVAL(10) + Samples taken = 907; samples used = 907 -icpu TCB(8) LMOD(L5RXTBL) CSECT($PRIVATE) OFF(0) GR(230) HOT +<.: %CPU Utilization (CSECT) | EF0A |==========================> + 2EF0AD D |======> + 2EF0A |==>")
12
General Monitoring Performance Management Database – to see trending of key performance indicators – created daily Dynamic Web Reporting System – specific data – on demand – MXG data base and dictionary

13
Reporting Pivot tables Pivot charts Trend reports On demand historical reports RMF DDS reports

14
Performance Reporting Database Daily reports created for all LPARs Configuration and IPL data CPU utilization, including zIIPs Capture ratio IO rates and response times Paging rates and central storage statistics

15
A Picture Is Worth…

16
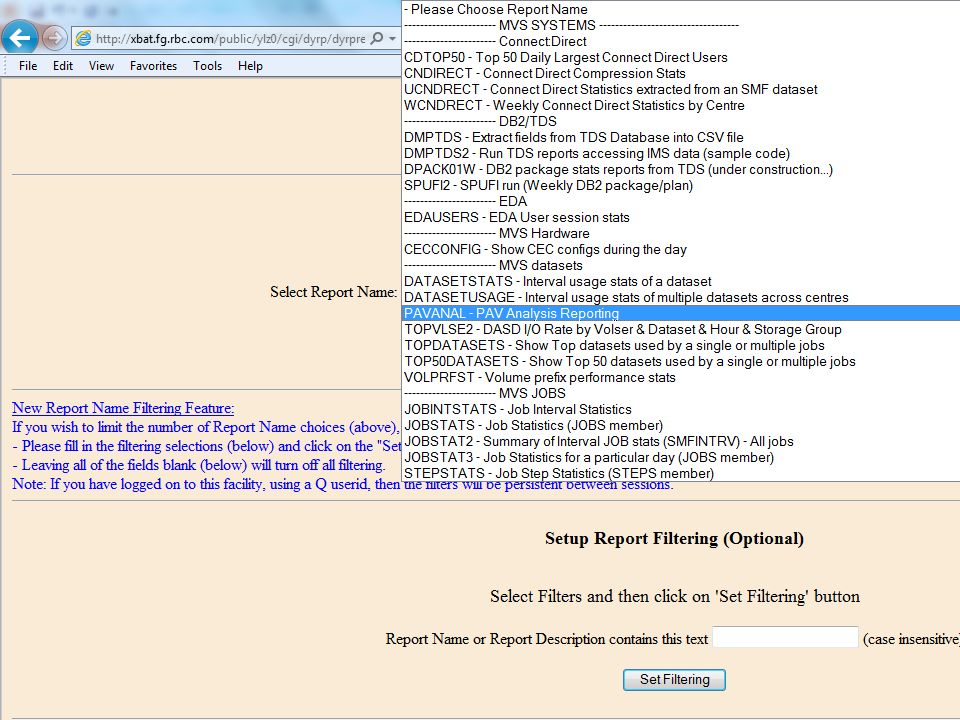
Dynamic Web Reporting System Used for detailed historical reporting On demand canned queries Can use SAS to create customized queries

20
Pivot Table From Extract

21
Pivot Chart

22
Things to Ponder SIMD (Single Instruction, Multiple Data) – Can’t make the CPU faster – Allows parallelism SMT2 (Simultaneous Multi-threading x2) – What is the effect? – Had to make reporting changes (MXG)
.")
23
Summary Large and complex environment Use automation and alerts effectively Use tools to diagnose problems faster Stay up with latest developments Team effort Data is key Effective reporting

24
Q&A and Discussion What are your best practices? What do you do differently? How do you keep up with ongoing changes? Health Checker?

Similar presentations


>")


 Jarek Gryz.>")


