Download presentation
Presentation is loading. Please wait.

1
POROSITY AND PERMEABILITY Review and Quiz

2
Water drains downward through the unsaturated zone due to gravity.
The water table is located at the top of the saturated zone. The saturated zone is the area filled with groundwater.

3
Why?

4
POROSITY – the percentage of open pore space between rock particles (sediment)
Big spaces, not a lot of them Little spaces, but lots of them Example: conglomerate Example: sandstone

5
Recalling the recent Porosity and Permeability lab, make your hypothesis. How do you predict the relationship between porosity and permeability? IOW, does porosity affect permeability?____________

6
Which size held the most water?
Demo #1 1st trial: look at red yellow green only Porosity - Amount of open space between sediments Demo #1 Which size held the most water?

7
Big spaces, not a lot of them LESS surface area
Little spaces but lots of them GREATER surface area EQUAL POROSITY IMPORTANT TO REMEMBER The size of the rock particle DOES NOT change the porosity!

8
Porosity is determined by
Porosity - The amount of open space in between rock particles. Porosity is determined by 1. Shape - Well rounded particles have greater porosity than angular particles. ROUND ANGULAR POROSITY ROUNDNESS

9
2. PACKING- The more closely packed the particles
are, the lower the porosity. POROSITY PACKING UNPACKED PACKED

10
- If all particles are the same size, they are sorted.
3. SORTING- - If all particles are the same size, they are sorted. - If the particles are different sizes, they are unsorted (poorly sorted) - The more sorted the particles, the higher the porosity POROSITY SORTING
 - The more sorted the particles, the higher the porosity. POROSITY. SORTING.")
11
does NOT affect porosity!!!!! (Shape, Packing, Sorting does)
Particle Size alone does NOT affect porosity!!!!! (Shape, Packing, Sorting does) The porosity is the same for sorted particles, but not for unsorted particles.
 The porosity is the same for sorted particles, but not for unsorted particles.")
12
Look at the mixed sediment tube!
Why?

13
PERMEABILITY - the ability of rock material to allow water to pass through it.
PARTICLE SIZE (tap on the curved red arrow to see the graph!) Look at the arrows below!!!
 Look at the arrows below!!!")
14
Which one will drain the fastest?
Make your hypothesis

15
Which one is the fastest?
Permeability! Which one is the fastest? Which one drains the fastest?

17
Simulation #3 Permeability of Materials
Demo #3 Hypothesis Page Simulation #3 Permeability of Materials (Click on Simulation #3 above to see the demo)
")
18
Demo #4 Rates of Deposition
Click play below Demo #4 Rates of Deposition

20
CAPILLARITY – the process of water adhering to rock particles (cohesion) in small spaces, resulting in an UPWARD movement of the water through rock sediment.
 in small spaces, resulting in an UPWARD movement of the water through rock sediment.")
21
The height water will rise in a small cylinder (capillary tube) so it
is dependent on the diameter of the tube.

22
The effect of capillarity in soil pores can be seen between the glass beads above. Water was added to the beads when they were in contact, then the beads were separated. The water is adhering (sticking) to the beads, but cohesion keeps a strand of water between the beads. This is how water moves up a capillarity tube by water molecules attaching to each other.

23
Porosity does not depend on grain size HOWEVER…
A quick review Remember! Porosity does not depend on grain size HOWEVER… As particle size permeability As particle size capillarity

24
POORLY-SORTED PARTICLES: unsorted, mixed
sizes (not in layers) WELL-SORTED PARTICLES: same size (in layers)
 WELL-SORTED PARTICLES: same size (in layers)")
26
USING WHAT YOU LEARNED FROM VIEWING THE ABOVE SLIDES
ANSWER THE FOLLOWING 10 QUESTION QUIZ ON THE INDEX CARD PROVIDED BY YOUR TEACHER. 1. Put your name on the top of the lined side of the index card. 2. Number each question. 3. Skip a line in between each question. 4. Turn in Quiz by next class!

27
The diagrams below represent three containers, A, B, and C, which were filled with equal volumes of uniformly sorted plastic beads. Water was poured into each container to determine porosity and infiltration time. 1. Which data table best represents the porosity and infiltration time of the beads in containers A, B, C? A B D

28
2. Soil composed of which particle size usually has the greatest capillarity? A) fine sand C) silt B) pebbles D) coarse sand
 fine sand C) silt B) pebbles D) coarse sand.")
29
3. When rainfall occurs, the rainwater will most likely become surface runoff if the land surface is
impermeable C) sandy B) nearly flat D) covered with grass
 sandy. B) nearly flat D) covered with grass.")
30
A) silt and pebbles, only B) sand, pebbles, and the mixture, only
A student performed a laboratory activity in which water was poured slowly into four cups containing equal volumes of loosely packed sediment samples, as shown in the diagram below. All particles were spherical in shape and uniform in size within the container. After the water level reached the surface of each sample, the student determined the amount of water that had been added. 4. The results of the activity should have indicated that approximately equal amounts of water were added to the cups of A) silt and pebbles, only B) sand, pebbles, and the mixture, only C) pebbles and the mixture, only
 silt and pebbles, only. B) sand, pebbles, and the mixture, only. C) pebbles and the mixture, only.")
31
5. Which graph shows the effect of soil permeability on the amount of runoff in an area?

32
6. The diagrams below represent four permeable sediment samples
6. The diagrams below represent four permeable sediment samples. The sediments are composed of the same material, but differ in particle size and sorting. Which sediment sample will most likely have the fastest groundwater infiltration rate? And why?

33
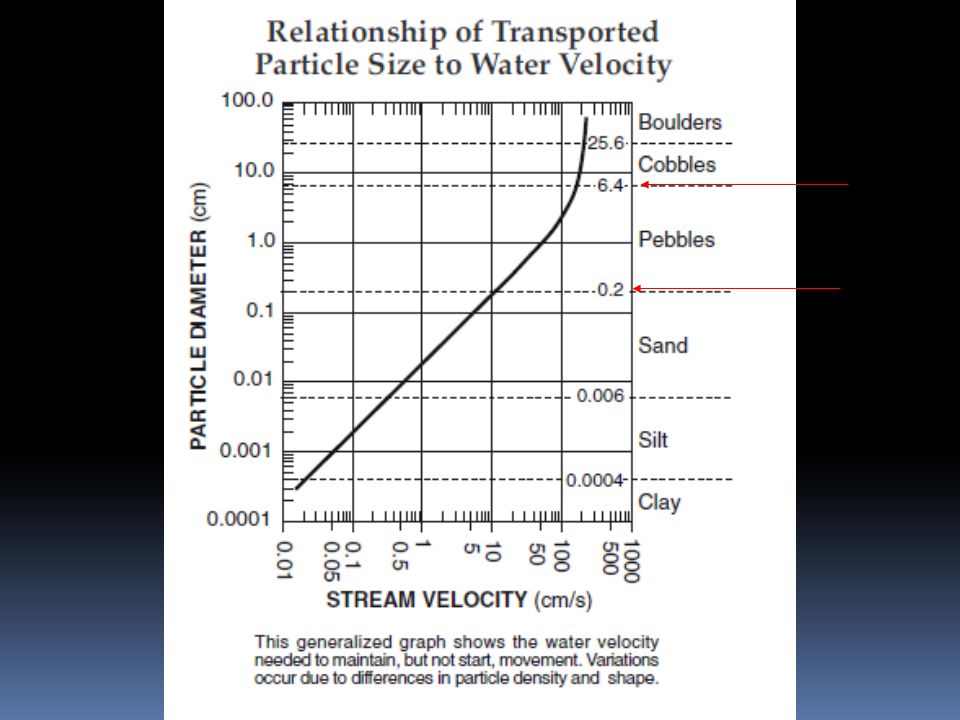
7. What size rock particle can be transported by a stream moving at a velocity of 100 cm/s?
A) fine sand B) pebbles C) silt D) coarse sand
 fine sand. B) pebbles. C) silt. D) coarse sand.")
34
8. The climate of Phoenix, NY, located in the northeastern part of the continent, ranges from warm and wet in the summer months to cold and snowy in the winter. What type of weathering do we experience according to the below climate graph? A) yellow--strong chemical B) green--moderate chemical with frost action C) blue--slight physical D) purple—strong physical
 yellow--strong chemical. B) green--moderate chemical. with frost action. C) blue--slight physical. D) purple—strong physical.")
35
9. If the amount of precipitation for an area was 125 cm/yr
9. If the amount of precipitation for an area was 125 cm/yr. and the average yearly temperature was 5oC, what type of weathering would be experienced in this region? A) moderate chemical B) strong chemical C) Very slight D) Moderate chemical with frost action
 moderate chemical. B) strong chemical. C) Very slight. D) Moderate chemical. with frost action.")
36
10 questions 10 pts. each 10. FOLLOW THE BELOW INSTRUCTIONS EXACTLY.
If your last name begins with letter A – M, answer the following question: QUESTION: If the porosity of a material decreases, how will the permeability be affected? (increases, decreases, or stay the same) If your last name begins with the letter N – Z, answer this question: QUESTION: Which of the following materials would have greater permeability? A) a gravel pit B) a sandy beach C) a muddy field D) an asphalt parking lot 10 questions 10 pts. each
 If your last name begins with the letter N – Z, answer this question: QUESTION: Which of the following materials would have greater permeability A) a gravel pit. B) a sandy beach. C) a muddy field. D) an asphalt parking lot. 10 questions. 10 pts. each.")
Similar presentations


 Cycle>")

 >")


>")


