Download presentation
Presentation is loading. Please wait.

1
Chapter 1 Understanding Life-Span Human Development

2
Three broad domains What is Development? Development Cognitive
Physical Cognitive Psychosocial Development

3
Other Developmental Definitions
Maturation: (nature) The biological unfolding of the individual genetic plan Learning: (nurture) Relatively permanent changes due to environmental experiences Development is due to interplay between nature and nurture
 The biological unfolding of the individual genetic plan. Learning: (nurture) Relatively permanent changes due to environmental experiences. Development is due to interplay between nature and nurture.")
4
Age Grade: Socially defined age groups
Statuses, roles, privileges, responsibilities Age Norms: Behavioral expectations by age Social Clock: When things should be done “Off time” vs. “On time” experiences

5
Figure 1.1 Aggression among children in four cultures.

6
Goals of Studying Life-Span Development
Description Normal development, individual differences Explanation Typical and individually different development Optimization Positive development, enhancing human capacities Prevention and overcoming difficulties

7
MODERN LIFE-SPAN PERSPECTIVE
Development is A lifelong process Involves both gain and loss Characterized by lifelong plasticity Shaped by its historical-cultural context Multiply influenced

8
The Scientific Research Approach
The scientific research approach is objective, systematic, and testable STEP 4 Revise Research Conclusions & Theory STEP 3 Draw Conclusions & create theory STEP 2 Collect Information Please Note: The content of this slide is not in the text. If you do not wish to use it in a presentation, you may either delete or hide it. STEP 1 Conceptualize the Problem

9
Figure 1.2 The Scientific Method in Action

10
Description Naturalistic Observation: Observing subjects in natural environments Researcher Jane Goodall studies the behavior of wild chimpanzees in their native habitat.

11
Descriptive Methods Laboratory Observation: Observing subjects in artificially controlled environments In this experiment, preschoolers’ reactions to the puppet are monitored.

12
Description Case Study Phineas Gage Is language uniquely human?

13
Survey A technique for ascertaining the self-reported attitudes, opinions or behaviors of people OBJECTIVE 3-2| Identify the advantages and disadvantages of surveys in studying behavior and mental processes, and explain the importance of wording effects and random sampling. Psychology 7e in Modules

14
Unrepresentative sample
Population Sampling procedure Representative sample

15
Survey Population – all the cases in a group Random Sampling
if each member has an equal chance of inclusion into a sample, we call that a random sample (unbiased). The fastest way to know about the marble color ratio is to blindly transfer a few into a smaller jar and count them.
. The fastest way to know about the marble color ratio is to blindly transfer a few into a smaller jar and count them.")
16
Random Sampling from Population
LO 1.9 Case studies and surveys Random Sampling from Population INFERENCE POPULATION SAMPLE

17
Descriptive Methods Laboratory observation –
Naturalistic and laboratory settings Descriptive Methods Laboratory observation – watching animals or humans behave in a laboratory setting.

18
(positive or negative)
Correlation When one trait or behavior accompanies another, we say the two correlate. Indicates strength of relationship (0.00 to 1.00) Correlation coefficient r = + 0.37 OBJECTIVE 3-4| Describe positive and negative correlations and explain how correlational measures can aid the process of prediction. Correlation Coefficient is a statistical measure of relationship between two variables. Indicates direction of relationship (positive or negative) Psychology 7e in Modules
 Correlation. coefficient. r = OBJECTIVE 3-4| Describe positive and negative correlations and explain how correlational measures can aid the process of prediction. Correlation Coefficient is a statistical measure of relationship between two variables. Indicates direction. of relationship. (positive or negative) Psychology 7e in Modules.")
19
Finding Relationships
Correlation coefficient ranges from 0 to 1.00 Closer to 1.00, the stronger the relationship between the variables. Positive correlation – variables are related in the same direction. Negative correlation – variables are related in opposite CORRELATION DOES NOT PROVE CAUSATION!!!

20
Figure 1.7 Correlation Correlation, a research method used for prediction, shows how two variables are related.

21
LO 1.10 Correlational technique
Menu

22
Correlation and Causation
OBJECTIVE 3-5| Explain why correlational research fails to provide evidence of cause-effect relationships. Psychology 7e in Modules

24
Correlation does NOT prove causation
LO Correlational technique Correlation does NOT prove causation Menu

25
Correlation Coefficient Interpretation
Range Strength of Relationship Very Low Low Moderate High Moderate High Very High

26
Figure 1.3 Plots of hypothetical correlations between the amount of TV children watch and the number of aggressive acts they display. Each dot represents a specific child who watches a high, medium, or low amount of TV and commits a high, medium, or low number of aggressive acts. Part A shows a positive correlation between television watching and aggression: The more TV a child watches the more aggressive he or she is. Part B shows a negative correlation: The more TV a child watches, the less aggressive he or she is. Finally, Part C shows a zero correlation: Amount of TV watched is unrelated to amount of aggression displayed. Figure 1.3

27
Height and Temperament of 20 Men
Correlation Height and Temperament of 20 Men 1 2 3 4 5 6 7 8 9 10 11 12 13 14 15 16 17 18 19 20 80 63 61 79 74 69 62 75 77 60 64 76 71 66 73 70 68 90 42 81 39 48 72 57 30 84 Subject Height in Inches Temperament

28
Scatterplot of Height and Temperament
Correlation 95 90 85 80 75 70 65 60 55 50 45 40 35 30 25 Temperament scores Height in inches Scatterplot of Height and Temperament

30
The Experiment Operational definition - definition of a variable of interest that allows it to be directly measured. Independent variable (IV) - variable in an experiment that is manipulated by the experimenter. Dependent variable (DV) - variable in an experiment that represents the measurable response or behavior of the subjects in the experiment. Definition: Hitting while playing IV: Violent TV DV: Aggressive play
 - variable in an experiment that is manipulated by the experimenter. Dependent variable (DV) - variable in an experiment that represents the measurable response or behavior of the subjects in the experiment. Definition: Hitting while playing. IV: Violent TV. DV: Aggressive play.")
31
Concept Check Operational definitions
Which of the following might be used as an operational definition of “attraction”? A feeling of affection when two people are together. (1) The number of minutes during which two people are touching each other over a four-hour period. (2)
 The number of minutes during which two people are touching each other over a four-hour period. (2)")
32
Concept Check Which of the following might be used as an
operational definition of “assertiveness?” The number of times a person makes requests or states his or her feelings over the course of a one-hour interaction. (1) An appearance of confidence and ease in social situations. (2)
 An appearance of confidence and ease in social. situations. (2)")
33
Evaluating Therapies Random Assignment
Assigning participants to experimental (Breast-fed) and control (formula-fed) conditions by random assignment minimizes pre-existing differences between the two groups. Sometime research participants out of enthusiasm or personal beliefs can affect the out come of an experiment. To control for such affects, a double-blind procedure is used, in which the participants and the experimenter’s assistants are not aware of which participants got real treatment and who got placebo. Psychology 7e in Modules
 and control (formula-fed) conditions by random assignment minimizes pre-existing differences between the two groups. Sometime research participants out of enthusiasm or personal beliefs can affect the out come of an experiment. To control for such affects, a double-blind procedure is used, in which the participants and the experimenter’s assistants are not aware of which participants got real treatment and who got placebo. Psychology 7e in Modules.")
34
Random Assignment LO 1.11 Experimental approach and terms
Experimental Group Test for Differences SAMPLE Control Group Menu Psychology 7e in Modules

35
Confounding Variables
LO Experimental approach and terms Effect of violent tv on aggression Experimental Group SAMPLE Are differences due to manipulation or confounding variable (mood)? Control Group Menu Psychology 7e in Modules
 Control Group. Menu. Psychology 7e in Modules.")
36
No Confounding Variables
LO Experimental approach and terms Effect of violent tv on aggression Experimental Group SAMPLE Differences due to manipulation, not an extraneous variable because mood randomly determined. Control Group Menu Psychology 7e in Modules

37
Scientifically compare performance of the two groups
Experimental Method Experimental group (noise condition) Measure amount of learning Scientifically compare performance of the two groups Sample of participants Control group (no-noise condition) Measure amount of learning The logic of designing an experiment. The experimenter manipulates the amount of noise to which participants are exposed, measures their learning, and attempts to treat them equally in every other way. This creates an experiment group and a control group.
 Measure amount of learning. Scientifically compare performance of the two groups. Sample of participants. Control group (no-noise condition) Measure amount of learning. The logic of designing an experiment. The experimenter manipulates the amount of noise to which participants are exposed, measures their learning, and attempts to treat them equally in every other way. This creates an experiment group and a control group.")
38
Figure 1.9 Elements of an Experiment
The two main ingredients of an experiment are (1) that the variables in the study are controlled or manipulated and (2) that participants are randomly assigned to the conditions of the study. When these two conditions have been met, causal conclusions may be drawn.
 that the variables in the study are controlled or manipulated and (2) that participants are randomly assigned to the conditions of the study. When these two conditions have been met, causal conclusions may be drawn.")
39
Claim: If kids eat large amounts of sugar, they become hyperactive.
Problem: How would you test the claim that sugar makes children hyperactive? 39 Copyright © Allyn and Bacon 2009

40
What is the relationship between sugar and behavior?
40

42
A summary of steps during experimentation.

43
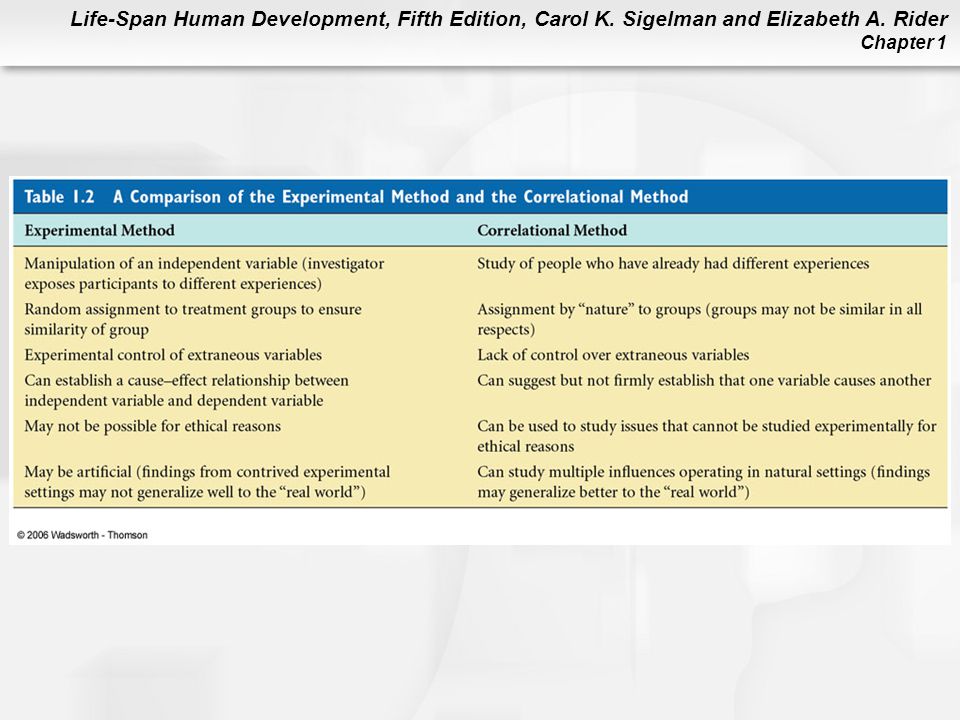
Below is a comparison of different research methods.

44
Concept Check A researcher wants to know if a particular herbal supplement is helpful for improving memory. She selects 100 college sophomores who achieved an average score on a memory test, gives half of them the herb for one month, half of them an inert pill, and the re-tests them all.

45
The Scientific Method An example of a claim that is NOT falsifiable:
The telephone psychic says “Next year, you will go through a big change.” This is not falsifiable because it is too vague.

46
The Scientific Method An example of a claim that is NOT parsimonious:
The sun goes around the earth. Little gnomes push it around the sky every day. We can’t see them because they are invisible to the human eye. This is not parsimonious because too many assumptions must be made in order for the claim to be accepted as fact.

47
Concept Check Is this claim falsifiable?
“You will encounter new challenges in your travels this week.”

48
Concept Check “An oversupply of dopamine in the human central
nervous system will eventually result in a decline in the number of receptors available for that neurotransmitter.”

49
Concept Check “On March 19th, 2006, you will meet a 30-year-old millionaire who will offer you an exciting entry-level job in a growing high-tech company in Austin, TX.”

50
Concept Check “Children whose parents divorce will eventually have serious emotional and relationship problems.”

52
Developmental Research Designs
Cross-Sectional Designs +1 cohorts (same generation) or age-groups studied 1 time of testing Studying age differences at any one time Longitudinal Designs 1 cohort (same generation) +1 time of testing Study changes across time in one cohort
 or age-groups studied. 1 time of testing. Studying age differences at any one time. Longitudinal Designs. 1 cohort (same generation) +1 time of testing. Study changes across time in one cohort.")
53
Figure 1.4 Cross-sectional and longitudinal studies of development from age 30 to age 70.

54
Age, Cohort, and Time of Measurement Effects
Age effects: Changes which occur due to age Cohort Effects: Born in one historical context Changes due to differences in society Disadvantage of cross-sectional design Time of measurement effects: Historical Take place at time of data collection Disadvantage of longitudinal design

55
Sequential Designs A combination of cross-sectional and longitudinal designs Advantages of both designs Gives information about Which age-related trends are age effects? Which age-related trends are truly cohort effects? Which age-related trends are a result of historical events?

56
Figure 1.6 A sequential research design combines the cross-sectional and longitudinal approaches. Here, we start with a cross-sectional study in 1980 and reassess the same people every 10 years. Figure 1.6

58
Protecting the Rights of Participants
Risk to benefit balance of the research Researcher responsibilities Informed consent Debriefing Protection from harm Confidentiality

Similar presentations


>")
 Chapter 1 Thinking Critically with Psychological Science James A. McCubbin, PhD Clemson University Worth Publishers.>")


