Download presentation
Presentation is loading. Please wait.

1
Pivot Design Oregon NRCS Engineering Meeting January 11-14, 2005
Natural Resources Conservation Service NRCS United States Department of Agriculture

2
Everything you need to know about Center Pivots, but didn’t really want to know

3
Topics Brief Overview Parts and Pieces
Water requirements – System flow rate Pressure requirements – Friction loss Nozzle type – Selection Application – Rate, Timing Runoff management

4
Who is Frank Zybach? Inventor of the Center Pivot in the year 1951

5
First Pivot

6
Valley - Model 1972

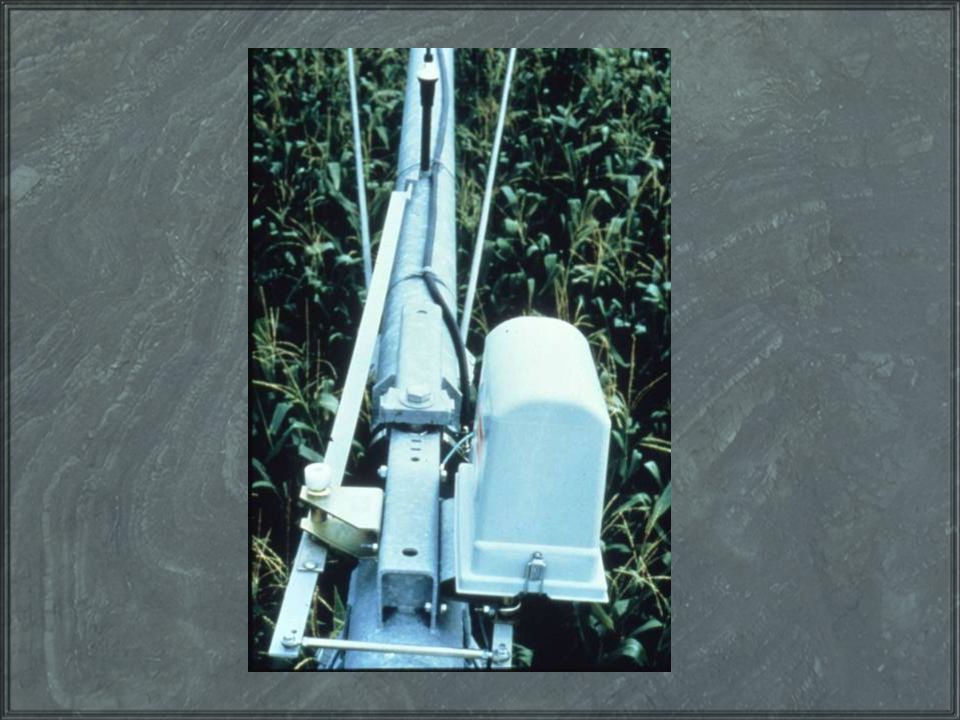
7
Hygromatic Raincat Olson Dowd

8
Towable pivot

9
Multi purpose Machines

10
Parts and Pieces Parts of a Pivot Physical Span Features
Span Crop Clearance Overhang Length Tire Type and Drive Unit Slope Limitations Options

11
Parts of the Pivot Pad Pivot point Pivot Span Add Span Transition Span
Last Span Over Hang End Gun

12
Pivot Pad

13
Pivot Point

14
Electric Collector Ring at Pivot

16
Pivot Point with Stop Device

17
Physical Span Features

18
Pipe size Pipe Diameter 5”, 6”, 65/8”, 85/8”, 10” Overhang 4” and 5”

19
The Tower

20
The Span

21
Span Type Span Length - depends on pipe size and Span type
Number of Trusses - based on length Other consideration: Shorter spans- less weight on wheels - less rutting problems Smaller pipe less weight

22
Slope Limitation Allowable Slope Crop clearance Slope absorption
depends on profile (low, standard high), span length, pipe diameter, and tire size range 7% to 18% Crop clearance Slope absorption Pivot Flex
, span length, pipe diameter, and tire size. range 7% to 18% Crop clearance. Slope absorption. Pivot Flex.")
23
Crop Clearance Slope Adsorption

25
Tower -Span connection

26
Joint Boot

27
Span Alignment

29
Alignment Switch

30
Drop/Outlet Connections

31
Span Crop Clearance Four Profiles
Low profile ’ depends on pipe size Standard Profile ’ High profile ’ Ultra high profile 15’

32
High profile with sugar cane

33
Overhangs

34
Overhang Length Depends some what on pipe size 18.1 - 82.3 ft
And manufacture

35
End Guns With Booster

36
With out Booster

37
Corner System

38
Corner Guidance System

39
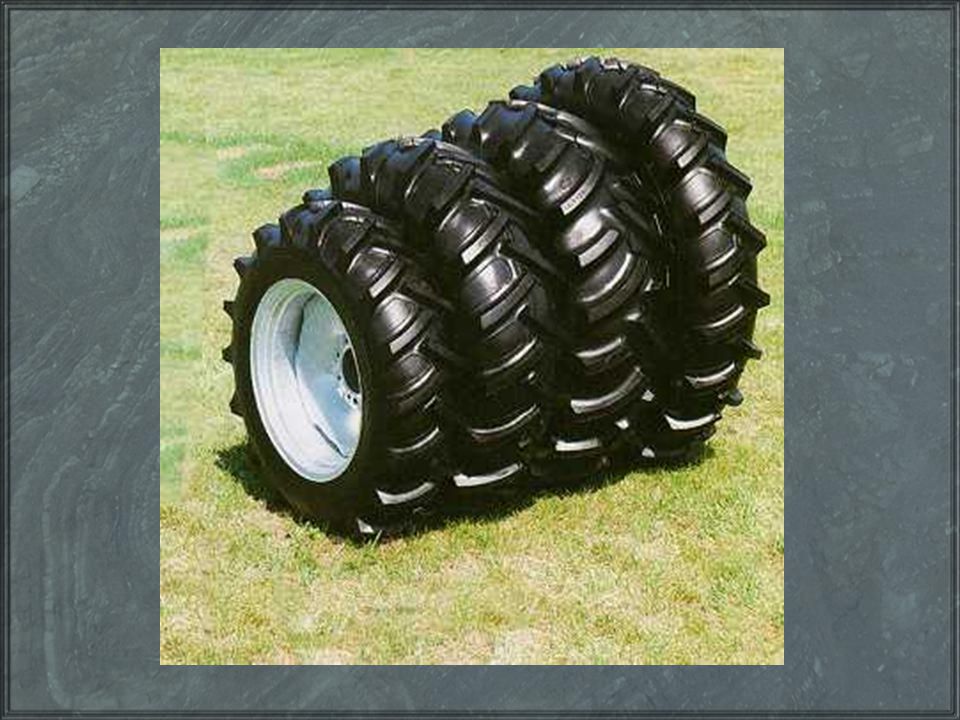
Tire Type & Drive Units Tire type Drive Units
Standard, Retread, High float, Maxi float, Track, 11.2x38 Drive Units Standard 30 rpm Optional 37 rpm Hi Speed 56 rpm

41
Large thin tires seem to be preferred

42
Additional add ons

43
Tire and Gear box

44
Motor and Driveline

45
Stop at the end

47
Panels

48
Remote control

49
Options & Accessories Pivot Flex Booster Transformer 45 amp package
Drive unit fuse packages Automatic Reverse Pivot stop-in-slot Auxiliary control ( for controlling other electrical devices) Automatic end gun shutoff End gun override Remote panel mount End-of-field stop Low pressure shut-offs High voltage surge protection Phase loss protection Slow down timer Low voltage monitor Modified alignment Flow Meter Check Valve
 Automatic end gun shutoff. End gun override. Remote panel mount. End-of-field stop. Low pressure shut-offs. High voltage surge protection. Phase loss protection. Slow down timer. Low voltage monitor. Modified alignment. Flow Meter. Check Valve.")
50
Options continued Automatic rain shut-off Severe duty gearboxes
Heavy duty pivot Hydraulic system control High or low profile High speed motors Motor covers Traction rim Drops - steel, PVC, flexible hose Dry wheel track packages End guns Booster pumps

51
Water requirements - System flow rate

52
What influences the System Flow rate?
Area irrigated Crop requirement Climatic Conditions Soil type Terrain Efficiency Leaching, germination, pre-water, harvest Treat Pivot, end gun, and corner systems as separate

53
Base Pivot flow rate Q = flow rate (gpm) A = Area of pivot (ac)
d = applied water (in/d) f = days between irrigation t = the fraction of time that the system is turned on for a typical day
 f = days between irrigation. t = the fraction of time that the system is turned on for a typical day.")
54
or

55
Methods of determining area

56
a FULL CIRCLE WITH CORNER SYSTEM For Example if the Angle during full
" L R $ H For Example if the Angle during full Corner Extension is 14.7 degrees, L = 1295 ft, R = 1636 ft and H = 2000 ft a

57
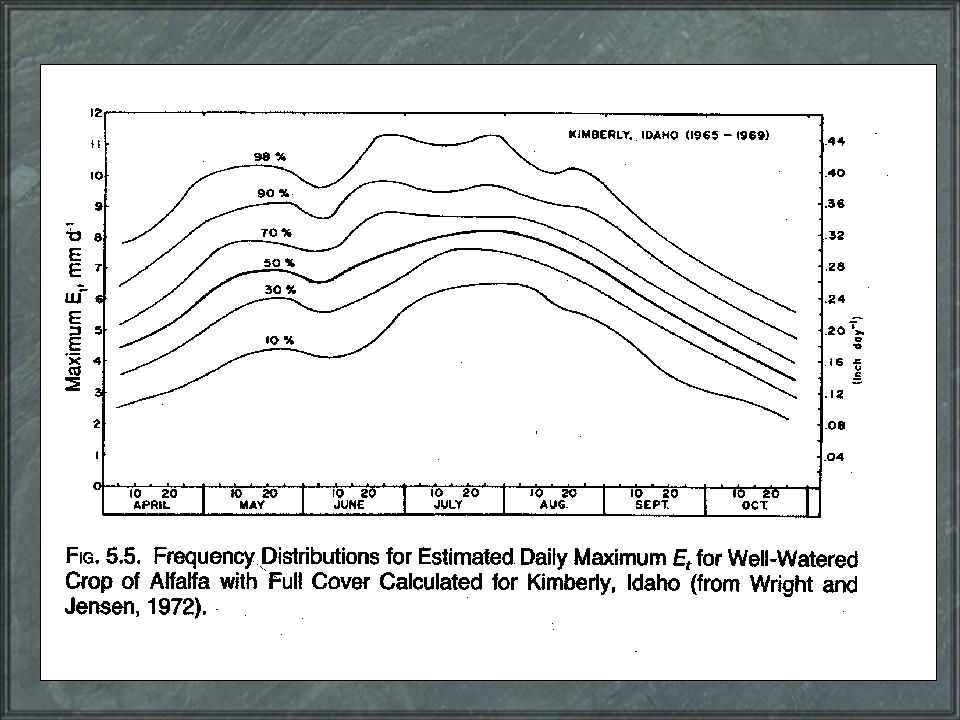
Depth to apply Need to determine daily crop water
NRCS endorses four methods Penman-Monteith Radiation method Temperature Method Class A evaporation pan

60
ET wetting adjustment factor Kf
Crop Type Irrigation interval, f, days Percentage of ET that is Transpiration 1 2 3 5 7 10 During Peak Period Vegetables and Fruit 1.15 1.1 1.05 1.02 1 80 Row Crops 1.07 90 Small Grains 100 Forage Crops Pasture For the Growing Season 1.2 70 95 1.06 1.04 1.01 1.03

61
Water Losses from Pivots
DRIFT DROPLET EVAPORATION CANOPY RUNOFF DEEP PERCOLATION CROP ROOT ZONE

62
Losses/Application efficiencies
Losses generally range between 5-20% Most accepted range is 5-10%

63
d or GIR value determined by
Gross peak daily depth =

64
t value In design, t=0.90 is often used
For example t=0.9 would indicate that the system operates for 21.6 hrs out of every 24 hrs. or 3.6 days out of a 4 day cycle

65
Total flow is calculated by
Show that total Flow Qt is calculated by taking the max radius when corner or end gun is on and calculating flow based on this

66
Example A 1320 ft pivot with no end gun irrigating alfalfa with a Etc = 0.33in/d, t=0.9, Irrigation frequency 3 days Find system flow rate

67
Solution: From Kf table Kf =1.04

68
Example 2 Same pivot only operator wants to add a corner system with a radius of 180ft and a end gun with radius of 120ft Find the system flow rate Etc = 0.33in/d, t=0.9, Irrigation frequency 3 days, 10% losses Increase radius by 300ft

69
Work Example 1512gpm

70
Frequency 2.5 days for sandier soils
3.5 to 4.5 days for medium textured soils Always use faction of a day

71
System Pressure Nozzle or base pressure Pressure regulators
Boom back losses Friction Loss Elevation change of field Height of pivot Local losses (valves, elbows, screens, etc.)
")
72
Base pressure Use operating pressure of nozzle obtained from manufacture literature If Pressure regulators are used, the base pressure of the regulator

73
Pressure Regulators Regulators have hysteresis
Regulators have friction losses For design use 5psi over the threshold pressure

74
Friction Loss Calculate outlet to outlet or use multiple outlet factor. For Center pivot use for Linear use 0.36 Several friction equation may be used. Hazen-Williams is most common Lh= equivalent hydraulic length

75
Friction Factors Hazen-Williams c factors range 130-148
Typical 140 Material roughness for galvanized pipe e= inches Use Swanee-Jain Equation to find f factor for Darcy-Weisbach

76
Friction Loss with two pipe sizes
where: Hf = total pipe-friction loss along the combined lateral, ft (or m) Hf smaller = total pipe-friction loss along the lateral when comprised only of the smaller pipe (from Equation 4-4 using Hf per 100 for the smaller pipe), ft (or m) Hf I-r smaller = pipe-friction loss between the pivot inlet and radial distance r for the smaller pipe (from Equation 4-9 or Figure 4-1 or Table 4-2 using Hf small), ft (or m) Hf I-r larger = pipe-friction loss between the pivot inlet and radial distance r for the larger pipe (from Equation 4-9 or Figure 4-1 or Table 4-2 using Hf large), ft (or m) r = distance from center pivot inlet to where the transition from large pipe to small pipe occurs, ft (or m)
 Hf smaller = total pipe-friction loss along the lateral when comprised only of the smaller pipe (from Equation 4-4 using Hf per 100 for the smaller pipe), ft (or m) Hf I-r smaller = pipe-friction loss between the pivot inlet and radial distance r for the smaller pipe (from Equation 4-9 or Figure 4-1 or Table 4-2 using Hf small), ft (or m) Hf I-r larger = pipe-friction loss between the pivot inlet and radial distance r for the larger pipe (from Equation 4-9 or Figure 4-1 or Table 4-2 using Hf large), ft (or m) r = distance from center pivot inlet to where the transition from large pipe to small pipe occurs, ft (or m)")
77
Simplified Method

78
More than two pipes

79
Topography

80
Elevation

81
Required Pressure at Pivot point
Pnoz + Preg (Hfbb + Hf+ ΔElf + Elp+ hflocal )
")
82
Example Given: Find: Required pressure at pivot point
1400ft pivot –8” pipe Qb=1200 gpm - Qg=120gpm Nozzle operating pressure psi 25psi regulators- Nozzle height 6’ ΔZ for field 50’ –local losses 5psi Find: Required pressure at pivot point Solution:

83
Solution

84
End Guns Effects on Pressure Flow Pump selection

85
Flat curve

86
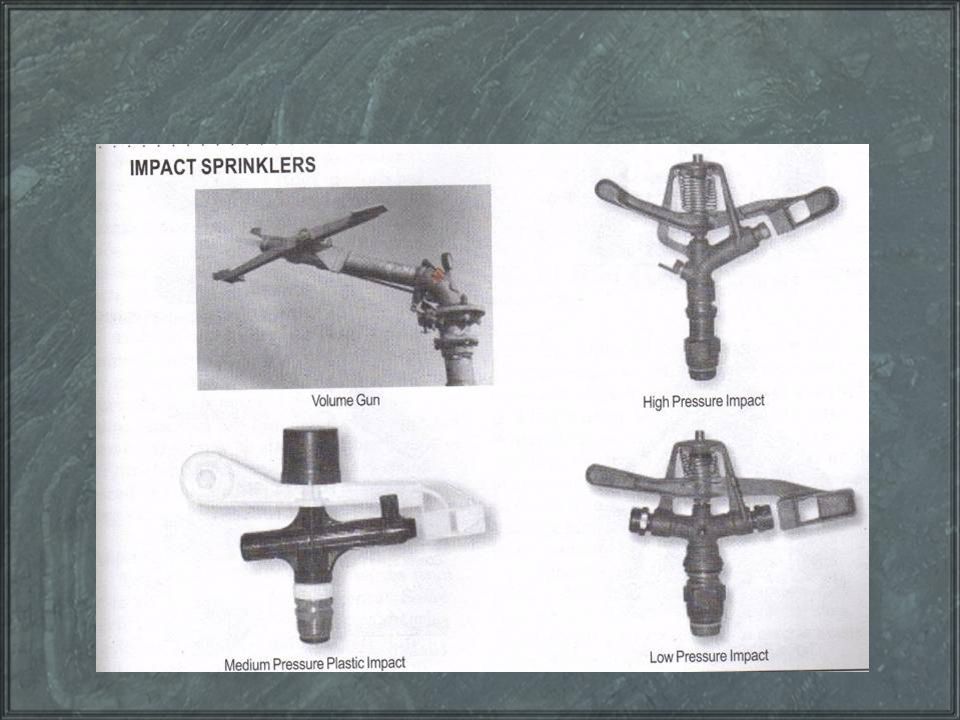
Sprinkler Nozzles

87
Distribution Patterns, Nozzle Spacing and Height.
Pivot system (Heermann-Hein) or Linear (Christensen) CU shall not be less than 85% (76% DU), except as noted in criteria for a Low Energy Precision Application (LEPA) system.
 or Linear (Christensen) CU shall not be less than 85% (76% DU), except as noted in criteria for a Low Energy Precision Application (LEPA) system.")
88
Selecting Nozzle Packages
Pressure requirements Wetted diameter Drop size Peak application rates

89
Sprinkler Discharge Sprinklers are sized using the following equation
r - distance from pivot Sr – sprinkler spacing

90
Sprinkler spacing Rule of Thumb
W/2 Sr W/4 W is the wetted diameter of the sprinkler

91
From a point midway between the first and second tower to the distal end of a center pivot, spray nozzle spacing along lateral lines shall not exceed 25% of the effective wetted diameter and impact sprinkler spacing shall not exceed 50 percent of the effective wetted diameter

92
Height above the Ground
New terms LEPA LESA LPIC MESA

93
Effects of height

94
Low pressure Low drift 6, 10, 15 psi end pressure Small atomized droplets are practically eliminated thus reducing evaporation Mainly spinner and spray types Placement height 3, 6, 9, 12 foot outlet spacing 30, 80, 90, 108 inches High application rates - Not good for heavy soils or steeper slopes

95
Sprays

96
Low Pressure LEPA Bubblers
Irrigation Mode Chemigation Mode

97
Small Droplet - High Uniformity
15 to 25 psi end pressure Droplets size can be adjusted with different pads fine droplets for heavy, flat soils and delicate crops where wind drift is minimal, or large droplets with good wind resistance for coarse soils Iwob, Spinners, some sprays Medium on application rate, wind fighting, and drop energy

98
Wobbler - Iwob

99
Spinner - Nutator

100
Large Droplet – High Uniformity
15 to 25 psi end pressure Droplets size can be adjusted with different pads Larger droplets further throw Good wind fighting Rotators Lower application rate, higher drop energy, and stream energy, may cause surface sealing

101
Rotator Style

102
Low pressure impact 25 to 35 psi end pressure
equal size nozzles spaced progressively closer 27, 18, and 9’ saves energy, controls drift, increases efficiency On lighter soils where adequate pressure is not available for high pressure or where spray nozzles would cause excessive runoff

103
Intermediate spaced impacts
50 to 55 psi end pressure High and low angle sprinklers spaced progressively closer 27,18, and 9’ on heavy soils and severe slopes where the system is used for supplemental irrigation

104
Variable Spaced Impacts
50 to 55psi end pressure smaller high and low angle sprinklers nearly equal size, spaced progressively closer On soils where the system is required to have maximum uniformity and rolling terrain with low intake rates, on rolling terrain where runoff could be a problem.

106
Distribution Pads Smooth Spray Pads smallest droplet
minimum soil disturbance or soil compaction infiltrates best on heavy soil susceptible to wind and evaporation psi

107
Medium Groove Spray Pads
larger drops, slightly wider spray pattern minimizes wind drift still infiltrates moderately heavy soils General propose average conditions and pressure less than 40 psi

108
Deep Grooved Spray Pads
large droplets in small direct streams greatest wind resistance reduces evaporation unsuitable for sensitive crops and light soils where water does not move laterally uniformity reduced under calm conditions pressures above 15 psi

109
Pad configurations Available in flat concave convex

110
Pad style

112
Application Rates shall be selected such that runoff, translocation, and unplanned deep percolation are minimized

113
Water Applied Just how much water are You putting on?
hours/revolution at 100% = (.105) (DLRDU) Speed DLRDU = Distance from Pivot to last regular drive unit (feet) Speed = Travel speed of Last Regular Drive Unit at 100% Applic.rate = _____________(GPM )x (735.3)_________ (Sys Length to last twr+O/H length+E.G.RAD)2 = x (In./Day) 24
 (DLRDU) Speed. DLRDU = Distance from Pivot to last regular drive unit (feet) Speed = Travel speed of Last Regular Drive Unit at 100% Applic.rate = _____________(GPM )x (735.3)_________. (Sys Length to last twr+O/H length+E.G.RAD)2. = x (In./Day) 24.")
114
Application Rates & Application
Instantaneous Average Total Application RATES

115
WATER APPLICATION RATE
4.0 3.5 3.0 PEAK APPLICATION RATE 2.5 RATES, inches / hour 2.0 1.5 1.0 0.5 0.0 0.0 0.2 0.4 0.6 0.8 1.0 TIME, hours TIME OF WETTING

116
Impact Sprinkler Pattern
Instantaneous Application Rate where water is hitting the ground Area being watered: Average Application Rate

117
Impact Sprinkler: Pattern Profile of Average Application Rate

118
Total Application for a Single Impact Sprinkler
Total Application = Average Rate x Run Time IF Nozzle q = 5 gpm Nozzle throw = 45 ft THEN The average application rate over the area to which water is applied (the green circle) is inches/hour (if all the water makes it to the ground) AND SO If the sprinkler is run for 10 hours TOTAL APPLICATION is 0.76 inches
 is inches/hour (if all the water makes it to the ground) AND SO. If the sprinkler is run for 10 hours TOTAL APPLICATION is 0.76 inches.")
119
Pivot & Linear-move Application Devices

120
Instantaneous Application Rate
Depends on Where The Evaluation Point is Serrated Deflection Plate

121
Instantaneous Application Rate
Flat Deflection Plate Nozzle Water hitting ground in most of outside part of area

122
Application Devices with Distinct Streams

123
Exaggerated Rotator-style Pattern w/ 4 individual streams
Instantaneous Application Rate Where water is Hitting the ground Area of Average Application Rate

124
Pattern Profile Illustrations

125
Total Application for a Single Applicator
Total Application = Average Rate x Run Time IF Nozzle q = 5 gpm Nozzle throw = 25 ft THEN The average application rate is inches/hour AND SO If the sprinkler is run for 10 hours TOTAL APPLICATION is 2.45 inches (if all the water makes it to the ground)
")
126
Consider Overlap & Sprinkler Movement
Individual Patterns are Overlapped for Uniformity Typical hand/wheel line spacing of 40’ (& 50’ or 60’ in solid sets) Adjacent applicators on a pivot/linear-move Consider the movement of the pattern as the pivot/linear-move advances the instantaneous application rate the soil “sees” will change because the overlapped pattern is not perfectly uniform Initially the soil “sees” a small rate, gradually getting more intense until it peaks, then gradually decreases again as the machine moves away
 Adjacent applicators on a pivot/linear-move. Consider the movement of the pattern as the pivot/linear-move advances. the instantaneous application rate the soil sees will change because the overlapped pattern is not perfectly uniform. Initially the soil sees a small rate, gradually getting more intense until it peaks, then gradually decreases again as the machine moves away.")
127
Instantaneous Application Rate Varies as Machine Moves over the field
Wetted Diameter Application Rate Soil One point in the field

128
Application Rate Summary
Instantaneous Application Rate is the rate “seen” by the soil at one point in the field at one point in time – NOT influenced by speed of machine Average Application Rate is the average rate “seen” by the soil at one point in the field over the time it receives water– NOT influenced by speed of machine Total Application is total “depth” of water received by the soil in the field. Equal average rate x time watered

129
Methods of calculating
True only for elliptically shaped application patterns

130
Newer nozzles Ra=0.26 *Q*Xp/W r= Rp/Ra, (1<r<2) M=qn√P W=a(HcM)b
Ra = average application rate Rp= peak application rate qn =nozzle flow P = nozzle pressure H = mounting height W = pattern width a, b, c, are empirical coefficients determined for each spray device type Ra=0.26 *Q*Xp/W r= Rp/Ra, (1<r<2) M=qn√P W=a(HcM)b
 M=qn√P. W=a(HcM)b.")
131
Reference “Application Rates from Center Pivot Irrigation with Current Sprinkler Types”. by Dennis Kincaid

132
Soil Sprinkler Interaction
Why is the application rate a concern?

134
Infiltration Rate Varies With Time
5.0 Initial Rate is high 4.0 3.0 Sandy soil INFILTRATION RATE, (in/hr) Rate Drops Rapidly 2.0 1.0 Silty soil 0.0 12 24 36 48 60 INFILTRATION TIME, (minutes)
 Rate Drops Rapidly Silty soil INFILTRATION TIME, (minutes)")
135
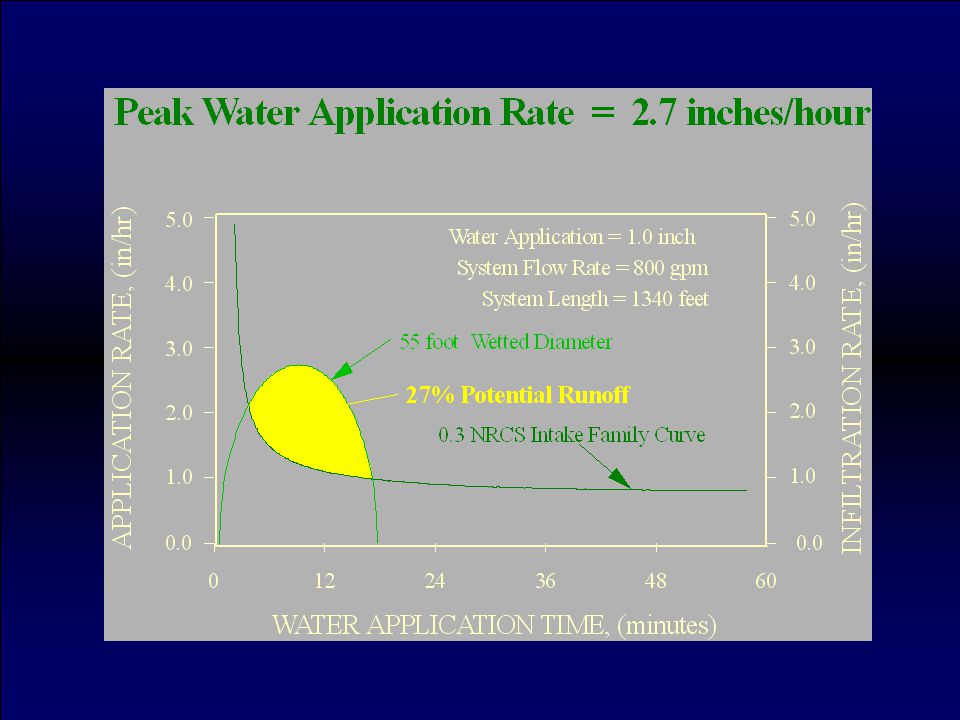
Application vs. Infiltration = Runoff ?
There is potential for runoff when Application Rate exceeds Infiltration Rate. Runoff will occur if “surface storage” cannot temporarily hold the water not being infiltrated.

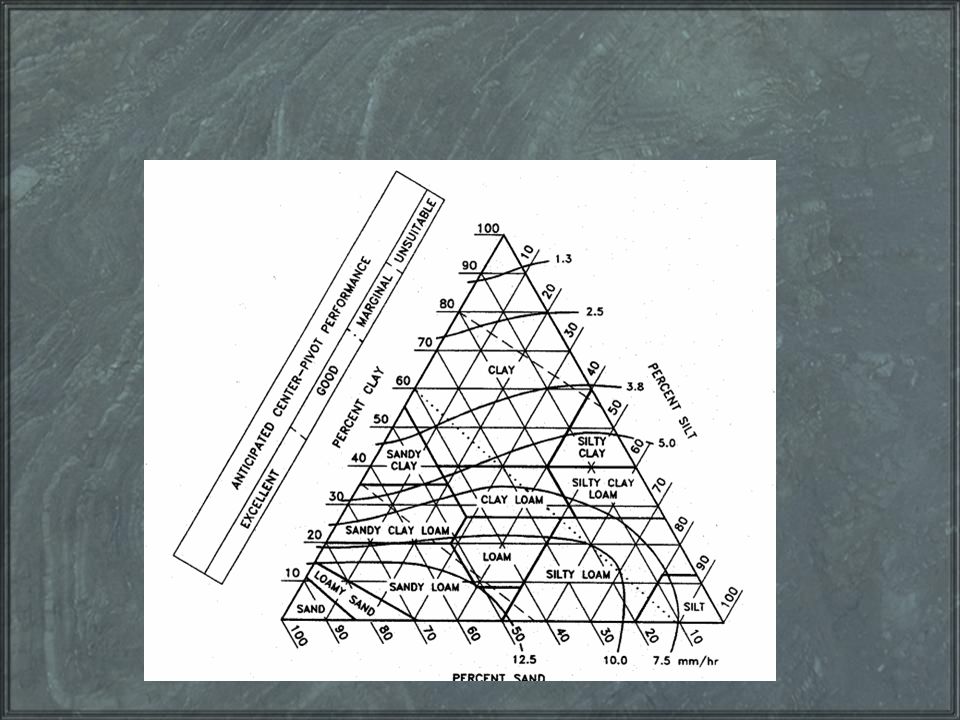
138
Runoff Potential 0.3 Intake Family Curve
Instantaneous App rate “seen” by soil Surface Storage Potential Runoff 12 24 36 48 60 5.0 4.0 3.0 2.0 1.0 0.0 INFILTRATION TIME, (minutes) INFILTRATION RATE, (in/hr) 0.3 Intake Family Curve
 INFILTRATION RATE, (in/hr) 0.3 Intake Family Curve.")
139
FACTORS AFFECTING RUNOFF
1. SYSTEM CAPACITY - GALLONS/MINUTE PER ACRE 780 GPM / 130 ACRES = 6 GPM/ACRE 2. DEPTH OF APPLICATION PER REVOLUTION - INCHES 3. SPRINKLER PACKAGE - SPRAY, IMPACT, LEPA 4. SOIL SURFACE CONDITIONS - AMOUNT OF WATER THE SOIL SURFACE WILL HOLD

140
EFFECT OF CAPACITY ON PEAK APPLICATION RATE
8 1300 ft from pivot WETTED DIAMETER: 7 20 ft 6 5 40 ft PEAK APPLICATION RATE, IN/HR 4 3 60 ft 2 100 ft 1 120 ft 1 2 3 4 5 6 7 8 SYSTEM CAPACITY, gpm / acre

141
Application Rates by Sprinkler Type
8.0 7.0 6.0 5.0 4.0 3.0 2.0 1.0 0.0 Low Pressure Spray Water Application Rate (in/hr) Rotating Spray Sand Low Pressure Impact Silt High Pressure Impact Water Application Time (min)
 Rotating Spray. Sand. Low Pressure Impact. Silt. High Pressure Impact Water Application Time (min)")
142
Rate also varies along machine
3 1300 feet 975 feet 2 APPLICATION RATE, inches/hour 1 650 feet 0.2 0.4 0.6 0.8 1.0 TIME OF APPLICATION, hours

143
EFFECT OF APPLICATION DEPTH ON RUNOFF
4.0 3.5 1.0 SCS INTAKE SOIL 3.0 2.5 RATES, inches / hour 2.0 1.5 1.2 in 1.6 in 2.4 in 1.0 0.8 in APPLICATION DEPTH 0.5 0.0 0.0 0.2 0.4 0.6 0.8 1.0 1.2 1.4 TIME, hr

144
SURFACE STORAGE SOIL DEPRESSIONS STORE WATER

145
HOW TO REDUCE RUNOFF?

146
1. REDUCE SYSTEM CAPACITY
- irrigate more hours per year - increase chances of getting behind

147
2. REDUCE APPLICATION DEPTH
make more revolutions per year

148
3. CHANGE SPRINKLER PACKAGE
increase wetted radius may need higher pressure make changes to pump

149
Offset Nozzles

150
Boom backs

151
Booms Behind Towers

152
Effects of Booms

153
Booms: Reduction of Peak Application Rate
Boom Offset from Pipe Zig-Zag Configuration Reduction* (%) 10 ft 5 – 15% 15 ft 15 – 30% 20 ft 30 – 40%
 10 ft. 5 – 15% 15 ft. 15 – 30% 20 ft. 30 – 40%")
154
4. INCREASE SURFACE STORAGE
extra tillage, fuel, time, weed control -

155
Methods of increasing Surface Storage
Basin Tillage Dammer-diker Subsoiler Field cultivator Rough cloddy ground (slope dependent) Organic residue
 Organic residue.")
156
Dammer-Diker

157
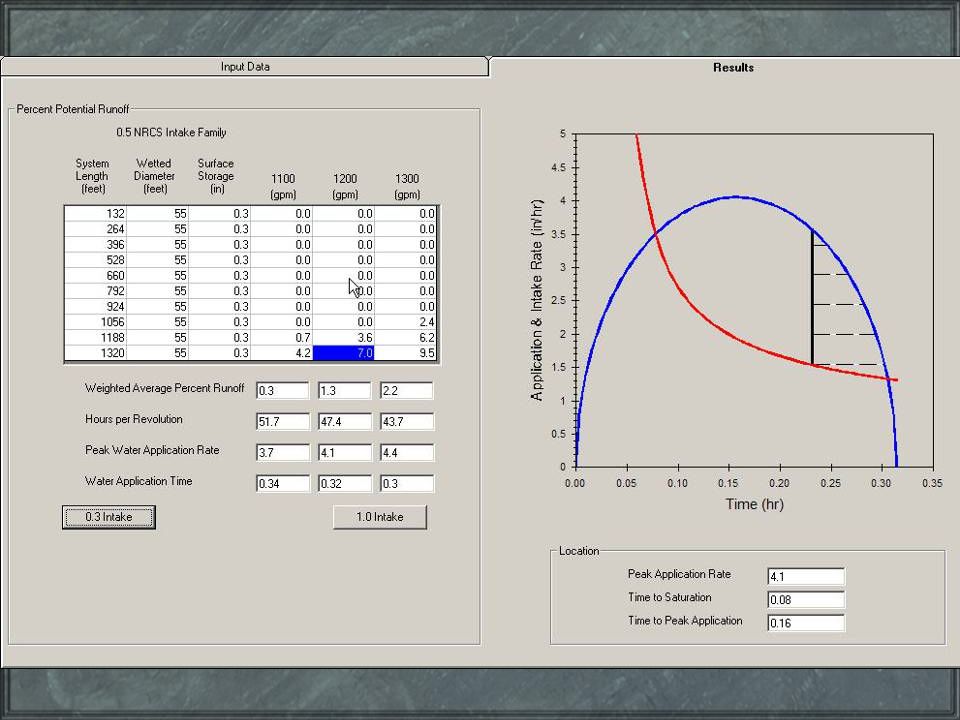
Ways to analyze Runoff Field test CPnozzle Guess?

159
Conditions that May Produce Surface Sealing
Salts Sodium tends to break down structure and produce “dispersed” conditions which lead to reduced infiltration rates Calcium tends to bind particles together, improving soil structure and, thus, infiltration rates These impacts typically seen in soils with large percentages of clay particles

160
Compaction/Sealing By Equipment By impact of water particles with soil
Intense rainstorm Application Rate & Energy of Sprinkler Droplet; energy is basically a function of size of droplet Silty soils more susceptible; aggregates broken down and the silt particles “float” on top, producing a seal Effect is progressive, getting worse throughout the irrigation season Organic or other material added to soil surface

161
Sealing Effect on Infiltration Rate
5.0 4.0 3.0 INFILTRATION RATE, (in/hr) 2.0 Soil before sealing 1.0 Soil after sealing 0.0 12 24 36 48 60 INFILTRATION TIME, (minutes)
 2.0. Soil before sealing Soil after sealing INFILTRATION TIME, (minutes)")
162
Special Application Fertilizer application Pesticide application
Waste Water Application

163
Linears or Laterals Require Guidance system Limited by water source
Harder to match frequency with crop and field limitations More problems with runoff More expensive

164
LEPA with Sock

165
Question?

166
Thanks

167
Electrical Electrical design of a system is dependent on a number of factors . These include length of system, number of drive units, options (hi-speed and or booster pump) and voltage available at the pivot. Electrically driven components (motors) require a certain quantity of electricity called Amps and the electricity must be a certain pressure (Volts) much the same as the hydraulic supply to a system.
 and voltage available at the pivot. Electrically driven components (motors) require a certain quantity of electricity called Amps and the electricity must be a certain pressure (Volts) much the same as the hydraulic supply to a system.")
168
Several things are needed for the electrical design of a Pivot
amp load voltage drop with given wire size voltage supply at the pivot and end tower voltage requirement System amperage is based on electrical load of the system, i.e., number of drive motors, hi speed, booster pumps, etc.

169
Example Given: Length - 5 spans X160 ft + 36ft overhang High speed
3 drive units high speed, 2 drive units standard No booster pump Helical gear center drive motors Solution: Amp Load = (1.8*A*0.85) + (1.1*B*0.60) +2.25 6.63 amps
 + (1.1*B*0.60) amps.")
170
Determining System Voltage Drop
Voltage drop for the system is calculated to insure a minimum of 440 volts on pivots at the last drive unit 440 + system voltage drop = Minimum pivot supply voltage

171
Example Given: High speed model with 2Hp booster pump, 180’ spans (1260’), 3 standard speed drive units, 4 high speed drive units, and a 13.7 amp load. Solution: from graph #2 for 12ga. wire voltage drop = 30 volts = 470 volts at pivot Probably need some 10ga wire to be safe How about voltage drop from Transformer out to the pivot point
, 3 standard speed drive units, 4 high speed drive units, and a 13.7 amp load. Solution: from graph #2 for 12ga. wire. voltage drop = 30 volts = 470 volts at pivot. Probably need some 10ga wire to be safe. How about voltage drop from Transformer out to the pivot point.")
Similar presentations