Download presentation
Presentation is loading. Please wait.

1
Responding in the Red Zone: Scientifically-Based Reading Instruction for Students with Significant Behavioral Challenges Louisiana PBS Conference Sessions 5A & 5B Gregory J. Benner, Ph.D. Associate Professor University of Washington, Tacoma Telephone: (253) Fax: (253)
 Fax: (253)")
2
Big Picture Objectives
The link between behavior and academic achievement Short chronicle of what we have learned What works to improve the responsiveness of students in the red zone to reading intervention Six keys to improved responsiveness

3
Potential Relationships
Achievement Problem Behavior Problem Behavior Achievement Problem Behavior Achievement Problem Behavior Achievement Hinshaw, S.P. (1992). Psychological Bulletin 3
. Psychological Bulletin. 3.")
4
Risk Factors: Why the relationships
Birth & Lifespan School Outcomes Adult Outcomes Poor Academic & Vocational Outcomes Child Factors Pre-natal, Natal, Post-Natal Early Externalizing Behavior Pattern Early Internalizing Behavior Pattern Childhood Maladjustment Childhood Maltreatment Academic Competence Problems Family Factors Antisocial & Psychiatric Family History Socioeconomic Status Family Functioning Maternal Depression Family Structure Classroom Deportment Problems Chronic Social Problems Risk Factors for Academic and Behavioral Problems at the Beginning of School ( 4

5
Coercion Theory (Patterson, 1982; 1995)
Problem Behavior Threat of Consequence Calm Surrender Non-Compliance Defiance Child Parent, Teacher, or Therapist Children become aware that if they continue to misbehave or respond to the parent’s coercive behavior with severe disruptive behavior they can shape parental (or teacher & therapists) behavior for their own benefit. 5
 behavior for their own benefit. 5.")
6
The relationship between problem behavior and language
Benner, Nelson, & Epstein (2002). Journal of Emotional and Behavioral Disorders. Nelson, Benner, & Cheney (2005). Journal of Special Education
. Journal of Emotional and Behavioral Disorders. Nelson, Benner, & Cheney (2005). Journal of Special Education.")
7
Effect Size Difference in Total Language
ED Population General Population ES=1.2

8
Regression Analyses for Externalizing and Internalizing Type Behaviors
Initial Entry ___________________________________ Entry in Last Position __________________________ Construct __________ df _______ Simple R ________ F p R2 Increment F Change Total Language Age of Onset 1 .01 0.01 .909 Externalizing 4 .31 4.01 .004 .12 6.58 .000 Internalizing 9 0.39 .887 .04 1.22 .305 Expressive Language .07 0.77 .988 .30 3.81 .006 .09 5.01 .002 .14 0.47 .832 .02 0.65 .659 Receptive Language .05 0.34 .560 .28 3.17 .016 .10 5.73 .001 0.53 .788 1.55 .178 8

9
The relationship between problem behavior and reading
Nelson, Benner, Lane, & Smith (2005). Exceptional Children
. Exceptional Children.")
10
Effect Size Difference in Broad Reading
ED Population General Population ES=0.95

11
Regression Analyses for Externalizing and Internalizing Type Behaviors
Initial Entry __________________________________ Entry in Last Position __________________________ Construct __________ df _______ Simple R F p R2 Increment ________ F Change _____ Broad Reading Age of Onset 1 .05 .41 .525 Externalizing 4 .35 6.97 .000 .24 7.74 Internalizing 9 .12 0.48 .790 .03 1.21 .303 11

12
Treatment nonresponders: Another way to look at the behavior reading linkage
Nelson, Benner, & Gonzalez (2003). Learning Disabilities: Research & Practice
. Learning Disabilities: Research & Practice.")
13
Leaner Characteristic Associated with Literacy Outcomes
Most Influential Rapid Naming/Serial Processing ES: .46 Behavior ES: .40 Literacy Outcomes Phonological ES: .39 Memory ES: .30 IQ ES: .28 Least Influential Demographic ES: -.01

14
What Moderates the problem behavior reading linkage?
(Benner, Nelson, Allor, Mooney, & Dai, 2008). Journal of Behavioral Education. (Benner, Allor, & Mooney, in press). Education and Treatment of Children. (Nelson, Benner, & Neill, 2006). Journal of Emotional and Behavioral Disorders.
. Journal of Behavioral Education. (Benner, Allor, & Mooney, in press). Education and Treatment of Children. (Nelson, Benner, & Neill, 2006). Journal of Emotional and Behavioral Disorders.")
15
Pathway Analysis (Nelson, Benner, & Neill, 2006)
")
16
Reading RTI Model and Students with Significant Behavior Problems
Tend to be less responsive to behavioral and academic interventions Students with EBD may have comorbid: Dyslexia VIQ > 90 Phonological Processing delay Language Learning Disability* VIQ < 90 Language difficulties in early childhood Comorbid ADD/H

17
Important Ideas! There is a small relationship between externalizing behavior and academic achievement and language Students with in the behavioral red zone need very high quality explicit instruction Instruction of reading skills should emphasize achieving fluency (regardless of grade level) Students with the red zone could have dyslexia or language-based learning disabilities that limit responsiveness. 17
 Students with the red zone could have dyslexia or language-based learning disabilities that limit responsiveness. 17.")
18
Improving Responsiveness to Reading Intervention
Six components give us the highest probability of improved responsiveness to instruction. The primary role of supplemental instruction is to increase access to core instruction programs by teaching high priority skills and concepts

19
Component 1: Clear Understanding of Literacy Needs
In-depth information about students’ skills and instructional needs help to pinpoint specific areas of reading that are “at grade level” Begin with the most foundational reading skill in need of improvement

23
Component 2: Target High Priority Reading Skills
Example of high priority pre-reading and beginning reading skills and concepts Pre-Reading Beginning Reading Print awareness Alphabet knowledge Phonemic awareness Rapid automatic naming Letter-sounds Decodable words and text Sight words Word families Mapping of sounds to print (spelling) Prefixes and suffixes Focus on Fluency or Automaticity
 Prefixes and suffixes. Focus on Fluency or Automaticity.")
24
Component 3: Well Designed Supplemental Instruction
High priority skills and concepts are organized into a sequential scope and sequence Progress systematically from prerequisite and easy skills and concepts to more complex ones Integrate skills and concepts within and across lessons to facilitate mastery Incorporate a mastery to fluency instruction sequence

26
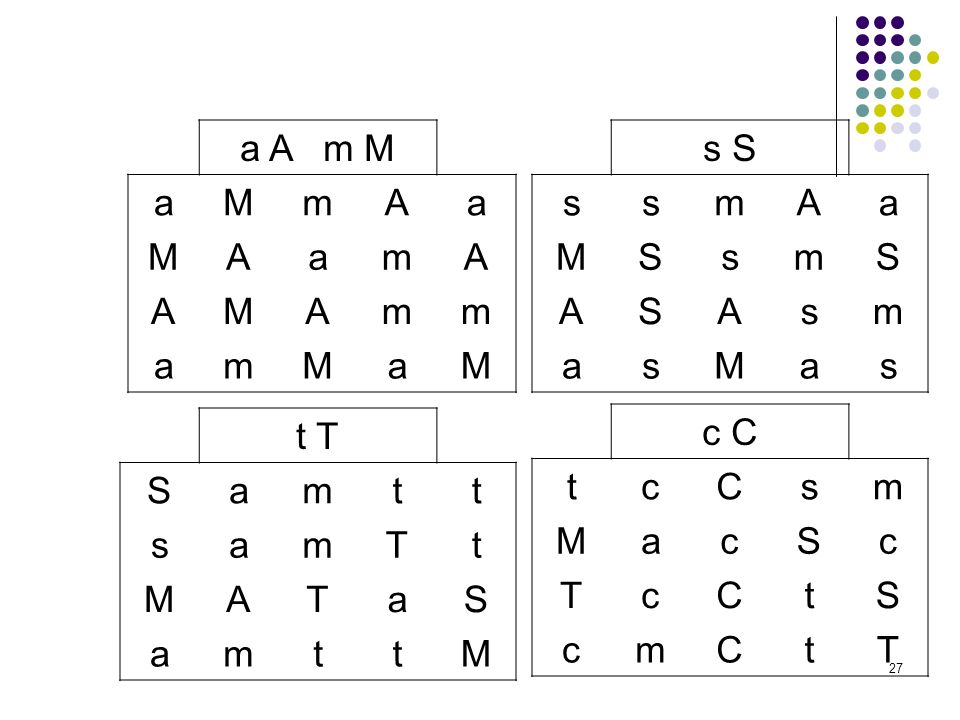
Instructional Design and Delivery Example Mastery to Fluency
a A m M a M m A s S s m A a M S 26 26

27
a A m M a M m A s S s m A a M S t T S a m t s T M A c C t c C s m M a
27 27
28
a M T A S 5 m 10 c 15 C 20 t 25 30 s 35 40 45 28 28

29
Where do I find Scientifically-Based Reading Interventions?
OSPI Materials Review Report: 4th-12th grades Florida Center for Reading Research What Works Clearinghouse Oregon Reading First Promising Practices that Work

30
Component 4: Explicit Delivery of Supplementary Instruction
Accountability and group alerting procedures Effective error correction Effect student questioning procedures

32
How Much Does Fidelity to Explicit Instruction Matter?
281 middle school students Screening criteria (conducted spring prior to intervention year) Median DIBELS ORF score fell in the “at-risk” category participated: 5th (<103), 6th (<104), 7th (<125), and 8th (<125). Corrective Reading Decoding Placement Test Ensure that the Corrective Reading Decoding strand was appropriate for addressing their word reading skill problems Establish homogenous groups and place students in the appropriate level (B1, B2, or C) Reference: Benner, G. J., Nelson, J. R., Stage, S. A., & Ralston, N. C. (2008). Fidelity of Implementation: Influence on the Effects of a Reading Intervention for Middle School Students Experiencing Reading Difficulties. Manuscript in Progress.
 Median DIBELS ORF score fell in the at-risk category participated: 5th (<103), 6th (<104), 7th (<125), and 8th (<125). Corrective Reading Decoding Placement Test. Ensure that the Corrective Reading Decoding strand was appropriate for addressing their word reading skill problems. Establish homogenous groups and place students in the appropriate level (B1, B2, or C) Reference: Benner, G. J., Nelson, J. R., Stage, S. A., & Ralston, N. C. (2008). Fidelity of Implementation: Influence on the Effects of a Reading Intervention for Middle School Students Experiencing Reading Difficulties. Manuscript in Progress.")
33
School Demographics School 1: Rural, 75 participants
Enrollment: 222 53% free/reduced, 14% special education services Ethnic breakdowns: 51% Caucasian, 46% American Indian/Alaskan Native, 3% Hispanic, 1% African American. School 2: Rural, 63 participants Enrollment: 250 60% free or reduced, 12% special education services, 10% ELL Ethnic breakdowns: 58% Caucasian, 24% Hispanic, 14% American Indian/Alaskan Native, 2% Asian American, 1% African American. School 3: Urban, 143 participants Enrollment: 585 59% free or reduced lunch, 14% special education services, 3% ELL Ethnic breakdowns: 55% Caucasian, 23% African American, 15% Hispanic, 5% Asian American, 3% American Indian/Alaskan Native.

34
CR Intervention Levels
Tier IV B1 (65 Lessons) then B2 (65 Lessons) Tier III B2 (65 Lessons) then C (125 Lessons) Tier II C (125 Lessons)
 then B2 (65 Lessons) Tier III. B2 (65 Lessons) then C (125 Lessons) Tier II. C (125 Lessons)")
35
Participating Teachers
School 1 (Rural) 3 general education teachers Mean years of teaching experience was 6.0 (SD = 3.6; Range = 2 to 9). Mean years teaching reading: 3.7 (SD = 2.9; Range= 2 to 7). School 2 (Rural) Two instructional specialists, 2 paraprofessionals Mean years of teaching or educational (in the case of the paraprofessionals) experience was 14.0 (SD = 5.0; Range = 8 to 20). Mean years teaching reading: 10.8 (SD = 8.1; Range= 3 to 20). School 3 (urban) 11 general education teachers, 2 special education teachers, 1 instructional specialist Mean years of teaching experience: 10.6 (SD = 9.0; Range = 2 to 34). Mean years teaching reading: 4.6 (SD = 6.2; Range= 0 to 16).
 3 general education teachers. Mean years of teaching experience was 6.0 (SD = 3.6; Range = 2 to 9). Mean years teaching reading: 3.7 (SD = 2.9; Range= 2 to 7). School 2 (Rural) Two instructional specialists, 2 paraprofessionals. Mean years of teaching or educational (in the case of the paraprofessionals) experience was 14.0 (SD = 5.0; Range = 8 to 20). Mean years teaching reading: 10.8 (SD = 8.1; Range= 3 to 20). School 3 (urban) 11 general education teachers, 2 special education teachers, 1 instructional specialist. Mean years of teaching experience: 10.6 (SD = 9.0; Range = 2 to 34). Mean years teaching reading: 4.6 (SD = 6.2; Range= 0 to 16).")
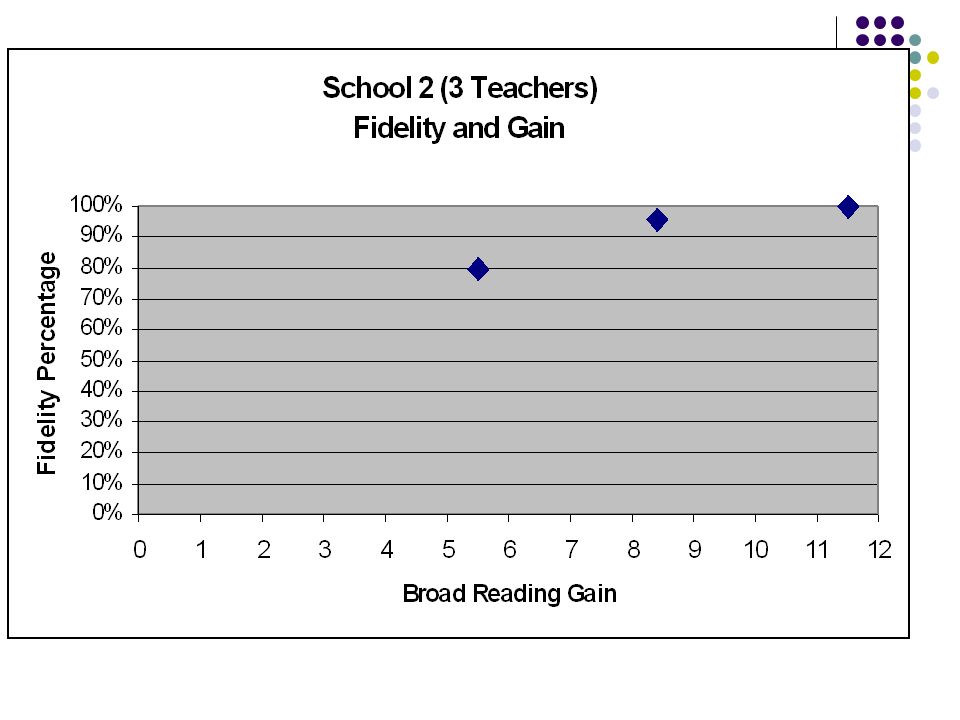
36
School 3 (14 Teachers) Fidelity and Gain 1 2 3 4 5 6 7 8
0% 10% 20% 30% 40% 50% 60% 70% 80% 90% 100% 1 2 3 4 5 6 7 8 Broad Reading Gain Fidelity Percentage

38
Table 1 Effects of the Corrective Reading Decoding Program on the Reading Skills of Students Fall Spring Baseline Post - Intervention Change t (1,280) _____________ _____________ _____________ _____________ Measure X SD X SD X SD _____________ ______ _____ ______ _____ ______ _____ B RS 90.07 8.4 8 93.99 9.65 3.92 4.60 12.87* PC 87.50 8.75 91.87 9.11 4.36 7.57 8.71* Note . BRS = Basic Reading Skills cluster. PC = Pa ssage Comprehension subtest. * p < .001 .
 _____________. _____________. _____________. _____________. Measure. X. SD. X. SD. X. SD. _____________. ______. _____. ______. _____. ______. _____. B. RS * PC * Note. . BRS = Basic Reading Skills cluster. PC = Pa. ssage Comprehension subtest. * p. <")
40
Component 5: Mastery and General Outcome Progress Monitoring
Ongoing progress monitoring General outcome Measures skills being taught over the entire year Relevant for short- and long-term goals Provides a measure of growth over an extended period of time Standardized administration and scoring Specific skills (mastery measurement) Measures a narrow band of skills being taught Most relevant for short-term goals Typically used with children with more significant learning problems Provides a measure of growth over a short specified period of time
 Measures a narrow band of skills being taught. Most relevant for short-term goals. Typically used with children with more significant learning problems. Provides a measure of growth over a short specified period of time.")
41
BAM-III

43
Component 6: Manage Behavior During Instruction
Supplemental instruction is integrated with behavioral interventions Implemented with fidelity Approaches PBS Self-management Student-Teacher Learning Game Think Time (Benner, in press). Journal of Direct Instruction. (Benner, Kinder, Beaudoin, Stein, & Hirschmann, 2005). Journal of Direct Instruction.
. Journal of Direct Instruction. (Benner, Kinder, Beaudoin, Stein, & Hirschmann, 2005). Journal of Direct Instruction.")
44
Example Expectations: Large and Small Group
Demonstrate learner position: Students’ backs are against the back of the chair, feet are on the floor in front of the chair, and hands are together on desk/lap. Look at the focus of instruction: Students’ eyes are on the instructional materials, teacher, or peer. Answer on signal: Students start and stop on teacher signal (group and individual). Responses are teacher-initiated and subject focused: Students’ responses are only teacher-initiated and subject focused. Use classroom voice: Students use six-inch voices.
. Responses are teacher-initiated and subject focused: Students’ responses are only teacher-initiated and subject focused. Use classroom voice: Students use six-inch voices.")
45
Teacher Students 15 pts. 30 pts.

46
Book Nelson, J. R., Benner, G. J., & Mooney, P. (2008). Instructional practices for students with behavioral disorders: Strategies for reading, writing, and math. New York: Gilford Press.
. Instructional practices for students with behavioral disorders: Strategies for reading, writing, and math. New York: Gilford Press.")
Similar presentations


 & The IST Process>")


 patients Policy.>")


 in Primary Grades>")