Download presentation
Presentation is loading. Please wait.

1
Population Ecology Part II HUMAN POPULATION DYNAMICS

2
Thomas Malthus “diminishing returns”
He argues that rising wages and improved well-being would lead to excess reproduction among the working class. A labor surplus would then cause wages to fall below subsistence levels, resulting in starvation, disease and crime. In his view, land for food production was the limiting factor in both population growth and economic development.

3
Was Malthus Right?

5
The Black Plague Also called the “black death” or Bubonic plague
Deadliest pandemic in human history 1340’s and 1350’s Thought to have been a bacterial infection carried by fleas Density dependent

6
Bubonic Plague 30%-75% mortality rate Bulbous swelling in lymph nodes
Turned black

7
Pneumatic Plague Caused a form of pneumonia Same bacterium
90%-95% mortality Victims died before reaching other places

8
Septicemic Plague 100% mortality High fever Skin turned purple

9
The Catholic Church Lost prestige and spiritual authority
Promised cures and treatments Said it was God’s will Could not explain so many deaths People abandoned the church

10
Effect on Europe

11
Why has the human population been able to continue exponential growth when other populations would have leveled off by now?

12
Humans Have Been Able To Overcome Environmental Resistance (Limiting Factors) to Sustain Growth
 to Sustain Growth")
13
Arable Land Land that can be used for growing crops
21% of earth’s surface is arable

15
Reasons for World Hunger Issues
Unequal distribution of available food Loss of arable land Increasing population growth rate Increasing poverty in developing countries

16
Arable Land Assume no arable land is being lost for the next 33 years.
2006, there was 1.15 acres of arable land per person, world-wide (i.e billion acres / 6.68 billion people).
.")
17
Arable Land 2039, there may be only 0.59 acres of arable land per person, world-wide i.e billion acres / 13 billion people arable land is being lost at the alarming rate of over24.7 million acres per year. 2039, there may be only 0.53 acres of arable land per person, world-wide

19
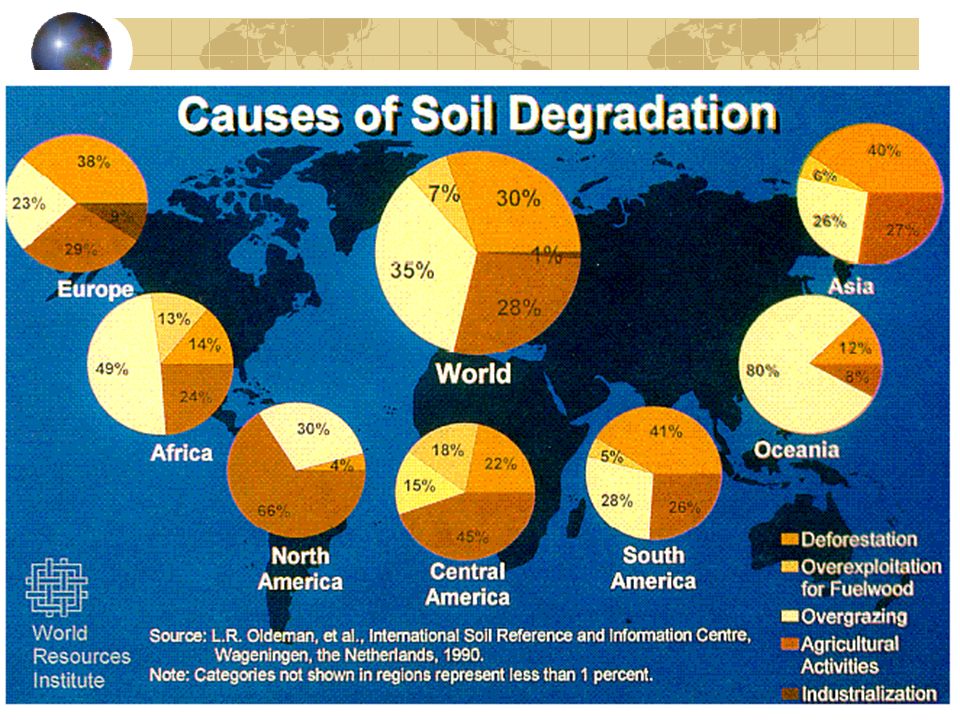
Reasons for Loss of Arable Land
Deforestation Over exploitation for fuel wood Overgrazing Over farming (deplete nutrients) Industrialization No rich sediment replacement due to flooding – controlled by dams
 Industrialization. No rich sediment replacement due to flooding – controlled by dams.")
20
How have we still managed to grow enough food to feed the world
How have we still managed to grow enough food to feed the world? Who grows most of the food? What affect could global warming have on this scenario?

24
Ways to Increase Crop Production
Modern farm equipment Return nutrients to soil (fertilizers) Irrigation New genetically modified crops Hydroponics
 Irrigation. New genetically modified crops. Hydroponics.")
25
Strategies for ensuring adequate nutrition for a growing population:
Increase the number of new food crops from a diversity of plant species Distribute food more equitably Increase land are that is dedicated to grain production rather than meat production Assist developing countries in efficient crop irrigation systems.

26
How many people can the earth feed on our arable land
How many people can the earth feed on our arable land? What about over-fishing our oceans? What is the earth’s carrying capacity?

27
Factors Affecting Human Population Size

28
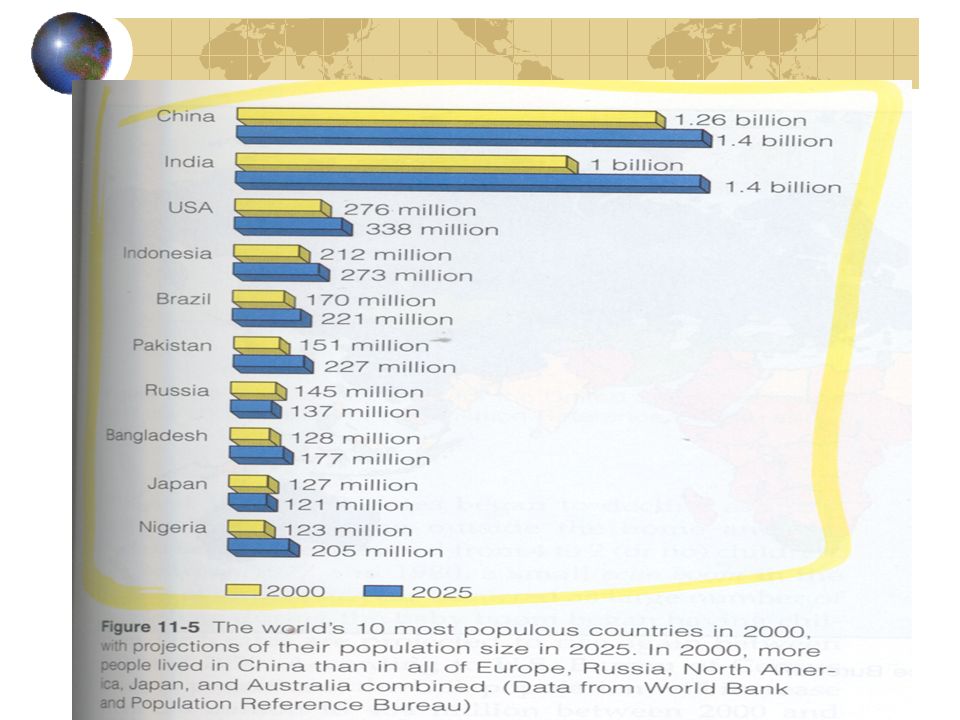
#1 – Birth vs. Death Rates Birth rate - # live births per 1,000 people
Death rate - # of deaths per 1,000 people Top 5 most populated countries: China, India, U.S., Indonesia, Brazil

29
Annual Rate of Natural Population Change (%)=
Birth rate – Death rate 1,000 people x 100

30
#2 - Fertility Rate # children born to a woman in her lifetime
Replacement-level fertility rate = # children a couple must have to replace themselves (2.1 to 2.5) Total fertility rate = average # children a woman has during reproductive years (global average is 2.7, developed countries 1.6)
 Total fertility rate = average # children a woman has during reproductive years (global average is 2.7, developed countries 1.6)")
31
#3 – Factors Related to Children
Importance of children to labor force Cost of raising and educating a child ($250,000 in U.S. to age 18 vs. minimal in developing countries)
")
32
#4 – Religion and Culture
View of the family Rights of women Beliefs concerning birth control Age at marriage Sex preference for children

33
#5 - Pension System If retirement plans are available and adequate – less children No retirement – more children, particularly males to support them in old age

34
#6 - Urbanization Better access to family planning services
More job opportunities Higher standard of living All generally promote smaller families

35
#7 – Opportunities for Women
Education Family Planning options Job opportunities Best way to reduce fertility rates

36
#8 – Infant Mortality Rate
Better medicine and health care = lower infant mortality The more likely infants are to survive, the more fertility rates drop

37
#9 – Average Age at Marriage
Developing countries = 14 or 15 Developed countries = 25

38
#10 – Life Expectancy Rapid rise in world population in last 100 years is due to increased life expectancy Modern medicine means infants do not die and people live to much older ages 67 years globally, 78 years in U.S. Poorest countries with HIV = 49 years

39
What factors affect death rates?
Increased food supplies and distribution Better nutrition Improvements in medical & public health technology (ex. immunizations and antibiotics) Improvements in sanitation & personal hygiene Safer water supplies to stop spread of infectious disease
 Improvements in sanitation & personal hygiene. Safer water supplies to stop spread of infectious disease.")
40
#11– Net Migration Immigration vs. Emigration
Countries like the U.S. continue to grow due to Immigration Countries like Russia are decreasing due to emigration

41
#12 – Age Structure

42
Growth Rate- includes birth rate, death rate, immigration and emigration Gross National Product- The most commonly used measure of the economic growth of a country.

43
Population Change Growth Rate
Population change = (Crude birth rate + Immigration) – (Crude death rate + Emigration) If a population of 10,000 experiences 100 births, 40 deaths, 10 immigrants and 30 emigrants in a year, what is the net annual percentage growth rate?
 – (Crude death rate + Emigration) If a population of 10,000 experiences 100 births, 40 deaths, 10 immigrants and 30 emigrants in a year, what is the net annual percentage growth rate")
44
Answer ( ) – ( ) = 40 40/10,000 X 100 = 0.4%
 – ( ) = 40 40/10,000 X 100 = 0.4%")
46
Zero Population Growth- When the number of births, equals the number of deaths. No growth in the population. .

47
Rule of 70’s – Doubling Time
Doubling time - # years it takes a population to double 70/ growth rate = doubling time (daily) 72/ growth rate = doubling time (years) If a population of a country grows at a rate of 5% a year, the number of years required for the pop to double is what?
 72/ growth rate = doubling time (years) If a population of a country grows at a rate of 5% a year, the number of years required for the pop to double is what")
48
Demographics of Countries

49
Developing Countries-
China is the largest but has taken drastic population control methods. By 2050, India is predicted to pass it. Pakistan is projected to become 3rd with Iran and Ethiopia following. However, Russia is losing 600,000 people a year, after being the 4th largest country in This is because of environmental pollution, hyperinflation, crime, corruption, disease and despair.

50
Developed countries Usually don’t have such population problems. It can be linked to poverty level even in developed countries.

51
Demographic Transition As countries becomes industrialized their birth rates decline.

52
Pre-industrial Harsh living conditions lead to a high birth rate and high death rate. Thus, there is little population growth.

53
Transitional As industrialization begins, food production rises and health care improves. Death rates drop and birth rates remain high The population grows rapidly

54
Industrial Industrialization is wide spread
Birth rate drops and eventually approaches the death rate. This is because of: better access to birth control decline in the infant mortality rate increased job opportunities for women the high cost of raising children who don’t enter the work force until after high school or college.

55
The Industrial Revolution Modern Medicine
Reasons human population growth has been so dramatic in the last century The Industrial Revolution Modern Medicine

56
Postindustrial The birth rate declines even further, equaling the death rate and thus reaching zero population growth. Then, the birth rate falls below the death rate and the total population size slowly decreases. (Cont….)
")
57
37 countries have reached this stage. (mainly in W. Europe)
To most population experts, the challenge is to help the remaining 88% of the world to get to this stage.

58
Demographic Transition

59
Demographic Transition in Japan

60
U.S. Statistics Because of the ‘Baby Boom’ the US has a bulge in the pyramid with people in their 50’s-60’s. There are also more women than men in the older age group because of differences in longevity between the sexes. (Cont…)
")
61
The US has a high % of retired people because of long life expectancy
The US has a high % of retired people because of long life expectancy. This makes us realize the importance of social security, etc. The US is considered a slow growth population.

62
Some countries, including China, penalize couples who have more than one or two children by:
Raising their taxes Charging other fees Eliminating income tax deductions for a couple’s third child Loss of health-care benefits, food allotments and job options

63
In China couples who pledge to have no more than one child receive
Extra food Larger pensions Better housing Free medical care Salary bonuses Free school tuition for their one child Preferential treatment in employment when their child enters the job market.

64
However, according to some studies, there is a strong preference for male children.
Girls are aborted at a higher rate than boys Some infant girls are killed Male children sometimes are fed better than female children.

65
Environmental Impact Equation (Paul Ehrlich Formula)
Population X affluence X technology = Environmental impact

66
Developed Countries High rates of resource use
Result in high levels of pollution and environmental degradation per person These are believed to be the key factors determining overall environmental impact. (Cont….)
")
67
It is estimated that a US citizen consumes 35 X’s as much as the average citizen of India and 100 X’s as much as the average person in the world’s poorest countries. (Cont…)
")
68
Thus, poor parents in a developing country would need kids to have the same lifetime environmental impact as 2 typical US kids.

69
Urbanization Urban areas must import food, water, energy, minerals, & other resources. They produce enormous quantities of wastes that can pollute the air, water & land. 44% of the world’s people live in urban areas that occupy only 5% of the world’s land & they consume 75% of the world’s resources.

70
1994 Global Summit on Population & Development
Cairo, Egypt Encouraged action to stabilized the world’s population at 7.8 billion by 2050, instead of the projected billion.

71
The major goals are to: Provide universal access to family-planning services. Improve the health care of infants, children & pregnant women Encourage development of national population policies Improving the status of women by expanding education & job opportunities

72
Major goals continued:
Increase access to education for girls Increase men’s involvement in child-rearing responsibility & family planning Take steps to eradicate poverty Reduce & eliminate unsustainable patterns of production & consumption.

Similar presentations