Download presentation
Presentation is loading. Please wait.

1
ArcGIS Data Models: Marine Data Model
Dawn Wright - Oregon State University Pat Halpin - Duke University Michael Blongewicz - DHI Joe Breman - ESRI

2
Polling Questions What is your name, organization, and email?
(Add yourself to a data models user group list, and you will be sent notifications about webcasts, design studios, etc.) Which of the following ESRI data types do you most commonly use? a) Coverage b) Shapefile c) Geodatabase feature class Are you interested in seeing a data model webcast, participating in a design studio, and for which data model? Where on the web do you get data? Polling Question Anyway, our question is… “Which of the following ESRI data types do you most commonly use?” Read answers A, B, & C from slide and then click your answer in your browser control. I’ll review the answer and your responses in a few minutes.
 Which of the following ESRI data types do you most commonly use a) Coverage. b) Shapefile. c) Geodatabase feature class. Are you interested in seeing a data model webcast, participating in a design studio, and for which data model Where on the web do you get data Polling Question. Anyway, our question is… Which of the following ESRI data types do you most commonly use Read answers A, B, & C from slide and then click your answer in your browser control. I’ll review the answer and your responses in a few minutes.")
3
Agenda Marine data model overview and tools Model elements
The use of schema and templates Tools designed and tested with marine data model case studies. Multidimensional modeling. Model elements Feature Datasets Object classes Relationships Historical Iterations Subclasses versus Subtypes Current Status Ready to be used Book coming next year Presentation of tools and uses of a Marine Geodatabase

4
Thematic Content - layer stack Thematic groupings of marine and oceanographic data sets
Weather your working with Shapefiles, Coverages, or Feature classes in the Geodatabase, Identifying the thematic groupings of the GIS ‘layer stack’ is a useful initial step towards giving names to the common elements that will be most important in the database. The layer stack is often the result of collaboration with many different people and organizations to assess the most useful layers that will be a part of the GIS analysis.

5
The Data Modeling Cycle Conceptual, logical, and physical models
Real World Objects and Relationships Conceptual Model Sketches, Flow Diagrams, etc. The data modeling cycle can be divided into phases that have an iterative workflow. We will often move from the real world elements that are the subject of data capture, to a conceptual model, usually a diagram composed of the relevant features and objects. We identify the most useful relationships and refined elements to the UML diagram (Unified Modeling Language) format called the Logical Model, and then from that create a physical database using Computer-aided software engineering tools, or ‘Case Tools’. There is often a cyclical iterative process to create a physical Geodatabase, often once we test a prototype data base we see the things that we want to change in Logical model, leading to recreation of the database. It is OK if you aren’t familiar with all of these terms, we will be showing you the best ways to work with the data model templates later in the demo. Physical Model Database Schema Business Rules Logical Model Diagram in CASE Tool ArcCatalog Tools
 format called the Logical Model, and then from that create a physical database using Computer-aided software engineering tools, or ‘Case Tools’. There is often a cyclical iterative process to create a physical Geodatabase, often once we test a prototype data base we see the things that we want to change in Logical model, leading to recreation of the database. It is OK if you aren’t familiar with all of these terms, we will be showing you the best ways to work with the data model templates later in the demo. Physical Model. Database Schema. Business Rules. Logical Model. Diagram in CASE Tool. ArcCatalog Tools.")
6
What is a Data Model? A practical working template
A starting point for creating a geodatabase An aid to simplify the integration of similar datasets A way to facilitate the exchange of data A support to existing standards Feature ObjectID Geometry LandObject LandObjectID TransactionID SystemStartDate OfficialStartDate OfficialEndDate SurveyPoint SurveyBoundary Point Measurement Computation Coordinate Project Geodatabase * The data models that ESRI works to create are a practical template for implementing a GIS project. They serve as a good starting point to help you create a geodatabase, or to use as a reference in refining your data model. When multiple people or organizations use the same data model the resulting databases have similar feature names and attributes, providing for easier interoperability. A good datamodel design can be key to making better decisions based on available data or geographic information, While supporting existing standards.

7
What’s in a Data Model Template?
A pre-designed schema of Objects Feature classes Tables Relationships Domains Subtypes Not all elements of the template are needed for each individual project. You can think of schema as a skeleton of the database. It is the description of the feature classes, tables and their attributes, relationships, domains, and subtypes. For example,you may start with a schema that has 10 relationships defined and select the 2 that are relevant to your data, and delete the rest.

8
Using a Design Template Schema Wizard reads repository or template to create a geodatabase
The ‘Schema wizard’ is the CASE tool we demonstrated in ArcCatalog that is used to move the schema from an xml or a repository to a physical geodatabase. The first step before using this tool is to create an empty Geodatabase, or use an existing database as the starting point into which you will create or add new schema.

9
ArcGIS Data Models Web site http://support.esri.com/datamodels
Over 25 industry-specific data models Conceptual and logical diagrams Case studies, Tips and Tricks documents These data models are hosted at the support center website where you can find a description of the industry model, links to interest groups, forums, and key points of contact. In addition, at the website you will find available for download all of the case studies and design template documents that result from the collaborations that ESRI has with external groups to create these models.

10
Path forward for multiD modeling
Extend existing functionality to support time and other variables of multidimensional data. Animation manager used to control variables such as time to set the animation sequence. Improve quality and interaction of charting and include as an animation object. Added support for the NetCDF data format building on existing layer capabilities. 3D interpolation Although many 3D interpolation methods are available, one of the major problems is searching for the neighboring points before applying the 3D interpolation algorithm. One of the approaches that can help speeding up the searching of neighboring points is performing the 3D tessellation and building up relationships between neighboring points to be used for interpolation. Voronoi tessellation is an algorithm that divides space based on the influence zone of each point in space. In 2D, Voronoi neighbors help forming a triangulation network, while in 3D they help forming a tetrahedral network. Both triangulation network and tetrahedral network are networks of simplest geometric primitives in 2D and 3D respectively. A triangle or a tetrahedral can be used as an interpolation unit. Each vertex of these geometric shapes carry coordinates of the measurement location and one or more measurement values. Given a location without the measurement value anywhere within the interpolation unit (a triangle or a tetrahedral), one can calculate the new attribute value (in the same domain of the measurements) using various algorithms, e.g. linear interpolation, inverse distance weight (IDW), etc. Depending on the distribution and format of the output, the results may yield, e.g. a point set or regular grid. Given an attribute value, one can also calculate the location associate with the given value (e.g. isolines, isosurfaces). The 3D interpolation engine performs a fast 3D Voronoi tessellation using a raster approach. A (Delauney) tetrahedral network (TetNet) is formed to maintain relationships between neighboring points in 3D space to cut down time for searching for neighboring points. The TetNet facilitates quick interpolation into 3D point set, raster stack (Voxels), and isosurfaces. Currently only linear interpolation algorithm is used for simplicity.
, one can calculate the new attribute value (in the same domain of the measurements) using various algorithms, e.g. linear interpolation, inverse distance weight (IDW), etc. Depending on the distribution and format of the output, the results may yield, e.g. a point set or regular grid. Given an attribute value, one can also calculate the location associate with the given value (e.g. isolines, isosurfaces). The 3D interpolation engine performs a fast 3D Voronoi tessellation using a raster approach. A (Delauney) tetrahedral network (TetNet) is formed to maintain relationships between neighboring points in 3D space to cut down time for searching for neighboring points. The TetNet facilitates quick interpolation into 3D point set, raster stack (Voxels), and isosurfaces. Currently only linear interpolation algorithm is used for simplicity.")
11
Tools - netCDF at 9.2

12
NetCDF in ArcGIS Can be accessed as: Raster Feature Table Direct read and write GIS data to netCDF

13
Make netCDF Raster, Feature (point), and table layers
, and table layers")
14
Behaves the same as any layer or table in:
Using NetCDF as a feature, raster or table in the GIS (network common data format) Behaves the same as any layer or table in: Display Same display tools for raster and feature layers will work on netCDF raster and netCDF feature layers. Charting Driven by the table just like any other chart. Animation Multidimensional data can be animated through a variable (e.g. time, pressure, elevation) Geoprocessing Tool A netCDF raster layer will work just like any other raster layer, same for feature layers and tables.
 Behaves the same as any layer or table in: Display. Same display tools for raster and feature layers will work on netCDF raster and netCDF feature layers. Charting. Driven by the table just like any other chart. Animation. Multidimensional data can be animated through a variable (e.g. time, pressure, elevation) Geoprocessing Tool. A netCDF raster layer will work just like any other raster layer, same for feature layers and tables.")
15
Geoprocessing Models Model Builder diagrams for workflow
Raster in WGS84 extract_west Shifted_west Output grid name Extract_east Extract by Rectangle (2) Extent Shift Rectangle (3) Rectangle Mosaic Geoprocessing models can be used to create schema, and are most commonly used to store work flow processes. Once you have a data model design that you are happy with, the work flow, or GIS functionality that you employ on the data, it can be preserved in this environment, and more easily shared with others. Notice the toolbox storing the Geoprocessing model can be represented and appended to the Geodatabase itself.
 Extent. Shift. Rectangle (3) Rectangle. Mosaic. Geoprocessing models can be used to create schema, and are most commonly used to store work flow processes. Once you have a data model design that you are happy with, the work flow, or GIS functionality that you employ on the data, it can be preserved in this environment, and more easily shared with others. Notice the toolbox storing the Geoprocessing model can be represented and appended to the Geodatabase itself.")
16
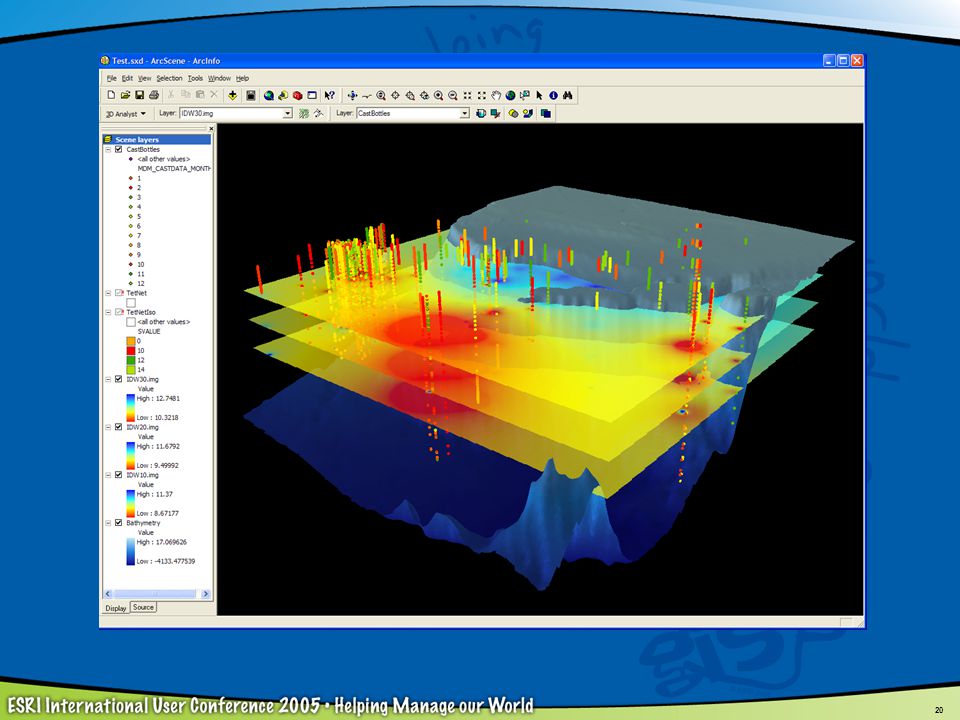
3D points displayed in volume space

17
3D Interpolation tool Sample resulting from collaboration between data models and ESRI developer Network (EDN) New tools based on data model prototypes and case study testing.

21
Demo Marine Data Model 3D interpolation tool

22
Marine Data Model Overview -Model elements Historical Iterations
Feature Datasets and feature classes Object classes Relationships Historical Iterations Subclasses versus Subtypes Current Status Ready to be used Book coming next year Presentation of tools and uses of a Marine Geodatabase

23
Feature Data Sets and Feature Classes
The Feature data set Stores the spatial reference for all feature classes it contains, including the extents of their m and z values Feature Classes Marine Features TimeSeries Points InstantaneousPoints Instant, Survey, Sounding,LocationSeries ProfileLine Shoreline Track TimeDurationArea Mesh Features MeshPoints GridPoint, NodePoint MeshElements indicates classes covered in detail

24
Object Classes (Tables)
SurveyInfo - stores parameters of a survey Series - stores the parameters of a series of locations MeasuringDevice - stores the parameters of a measuring device Vehicle - stores information about the vehicle being used Cruise - stores information associated to a cruise Parameter - stores the properties of a given parameters ScalarQuantity - stores magnitude data values VectorQuantity - stores directional data values Measurement - storing depths related to a specific Measurements MeasuredData - storing data values associated to locations indicates classes covered in detail

25
Relationships in the model (You may only need to use one or two of these for your individual project) Relationships One Survey can have many Points One ProfileLine can have many Surveys One Cruise can have many Tracks One MeshPoint can have many VectorQuantities One MeshPoint can have many ScalarQuantities Many VectorQuantities can have one Parameter Many ScalarQuantities can have one Parameter indicates classes covered in detail

26
Classification Historical Iterations Subclasses versus Subtypes

27
and uses of the data model
Presentation of tools and uses of the data model Varying uses and means of adapting the data model

28
Instantaneous Points X :00:00 a subclass of MeasurementPoint for representing features that are a single observation in time and space the X, Y coordinates plus a time-stamp create the unique point feature can have multiple Z locations an InstantaneousPoint has 4 Subtypes Instant - default value Sounding Survey LocationSeries Example: Bathymetric Survey, CTD Drops, Y Z

29
InstantaneousPoints.Survey
X SurveyID - foreignkey relating to SurveyInfo SurveyInfo - stores properties about the survey StartDate EndDate Description DeviceID TrackID :00:00 Z Y

30
Demo of the Marine Data Model Survey Point Example

31
ProfileLine a feature class designated for deriving additional along a line. Properties HasM and HasZ are set to TRUE has a many-to-many relationship with SurveyInfo via SurveyKey one ProfileLine can be associated to many Surveys many Survey can be associated to many ProfileLines Example: Transects, Coastline Evolution

32
The Design and Intent of ProfileLine
Inheritance

33
Demo of Marine Data Model ProfileLine Example

34
TimeSeriesPoint a subclass of MeasurementPoint fixed in space (X,Y)
multiple Z Values via Measurement Table Example: Moored Buoy, ADCP

35
TimeSeriesPoint with Measurements
1 *

36
Design and Intent of Mesh Features
includes feature classes: MeshElement (polygon) MeshPoint (points) includes object classes: Mesh - identifies the features making up a Mesh VectorQuantity - vector values for each point for each time step ScalarQuantity - scalar values for each point for each time step Parameter - information about a given parameter Example: 2D Model results
 MeshPoint (points) includes object classes: Mesh - identifies the features making up a Mesh. VectorQuantity - vector values for each point for each time step. ScalarQuantity - scalar values for each point for each time step. Parameter - information about a given parameter. Example: 2D Model results.")
37
Relationships

38
Demo Marine Data Model MeshPoint Example

39
Geodatabase Diagrammer Create graphical representation of geodatabase once complete
The Geodatabase Diagrammer can be used to document the Geodatabase once it is complete.The resulting output is a set of graphic elements representing the content of the database. These can be used to diagram the database or create a poster. It is important to note the difference between this model diagram that can not be used to automatically create a data model, only to represent one.

40
Framework and Publication of: ArcMarine Marine data model book

41
ArcMarine Purpose Your Geodatabase Template
Data collection at sea/shore … to final geoprocessing, analysis Control of required data fields, common data structure Simplify enterprise GIS project implementation E.g., cruises, MPA networks, habitat mapping Program Coding/Application Development Common/shared tool development Rapid prototyping Linkage to processing models Common data structure Data Sharing/Networking “Schooling” in the Gdb

42
ArcMarine Design Strategy
As generic as possible… As exhaustive as possible… As temporally dynamic as possible… Image modified from original by P. Halpin, Duke

43
Implementation Process
Design Engineering Database Engineering Deployment/Rollout Since Oct 2001: 3 workshops, 3 ESRI UC sessions ArcMarine Interest List: over 350 people, 32 countries Approaching final UML: feature classes, attributes, rules/behaviors Case studies/tool development in 2005 ESRI Press Book in 2006 More info at dusk.geo.orst.edu/djl/arcgis/about.html Agency “buy-in” - Tie in with other model efforts

44
ArcMarine: A Geospatial Framework for Ocean and Coastal Analysis
ESRI Press, 2006 By Wright, Blongewicz, Halpin, Breman Full background documentation with ~10 case studies Chapter 1 - Introduction (Why ArcMarine?) Chapter 2 - Conceptual Framework and Common Marine Data Types
 Chapter 2 - Conceptual Framework and Common Marine Data Types.")
46
ArcMarine Thematic Layers

47
ArcMarine Thematic Layers

48
ArcMarine … Chapters 3-6 Marine Marine Marine Marine Data Model. Shows the spatial relationships between the feature classes and the tables. After a user’s GIS layers are placed in the model, the associated relationship and tables are created and populated using either the data loader or ArcCatalog data loader utility.

49
Ch. 3 - Marine Surveys e. g. , Inst
Ch. 3 - Marine Surveys e.g., Inst. Points, Time Duration Line, Survey & Cruise object tables Essex MG&G Survey Brian Andrews, USGS-Woods Hole, MA Louisiana Subsidence Heather Mounts, PhotoScience, FL We start with this because of the initial and critical role of the collection of data in a survey.All case studies have idea of characterizing regional geological framework. Geological data collection and interpretation are primary goals to aid in subsequent sampling (usually biological).
.")
50
Ch. 4 - Marine Animal Tracking e. g
Ch. 4 - Marine Animal Tracking e.g., Location Series Points, Time Duration Lines and Areas, object tables and rasters OBIS, Pat Halpin et al., Duke U. Sea Turtle Tracks (Caretta caretta) Sea Surface Temperature (WCR) Source: Source: (Read & McClellan2004)
![]()
51
Ch. 5 - Time Series & Measurements e. g
Ch. 5 - Time Series & Measurements e.g., Time Series Points, Profile Line, Time Series/Meas object tables North Atlantic, Irish Sea Martina Hennesey et al., Marine Institute, Galway, IRELAND Eamonn Doyle, Rob Morrison, ESRI-IRELAND Marine Institute is Ireland’s national marine agency - “90% of Ireland is undeveloped, undiscovered, and underwater.”

52
Ch. 6 - Nearshore & Coastal Analysis e. g
Ch. 6 - Nearshore & Coastal Analysis e.g., Shorelines, ProfileLines, Marine Areas, object tables Martin County, FL Artificial Reefs, Hurricane Tracking Rob Hudson, PhotoScience; Kathy Fitzpatrick et al., Martin County Govt.

53
Hawaiian Reef Fish and MPAs Alyssa Aaby, UH; Dawn Wright, OSU
Ch. 6 - Nearshore & Coastal Analysis e.g., Shorelines, ProfileLines, Marine Areas, object tables Hawaiian Reef Fish and MPAs Alyssa Aaby, UH; Dawn Wright, OSU

54
Ch. 7 - Model Meshes e.g., finite element Mesh Points, Mesh Elements, Scientific Mesh Juergen Schulz-Olberg, BSH (Federal Maritime & Hydrographic Agency of Germany) Michael Blongewicz, DHI Ch. 8 - Multidimensional GIS e.g., linking ArcMarine with ArcHydro and other DMs Joe Breman, ESRI; Michael Blongewicz, DHI; Pat Halpin, Duke Ch. 9 - Customizing ArcMarine especially tools for data import, filter, extraction, synching, modeling ArcMarine Poster, UML/XMI, Tool Suite on accompanying web site
 Michael Blongewicz, DHI Ch. 8 - Multidimensional GIS e.g., linking ArcMarine with ArcHydro and other DMs Joe Breman, ESRI; Michael Blongewicz, DHI; Pat Halpin, Duke Ch. 9 - Customizing ArcMarine especially tools for data import, filter, extraction, synching, modeling ArcMarine Poster, UML/XMI, Tool Suite on accompanying web site.")
55
dusk.geo.orst.edu/djl/arcgis includes downloads, new tutorial
More information dusk.geo.orst.edu/djl/arcgis includes downloads, new tutorial support.esri.com/datamodels

56
Marine Modeling Applications Implications:
ArcMarine Data Model Marine Modeling Applications Implications: Allows explicit spatial & temporal relationships to be used in geoprocessing and analysis Allows for advanced tool development P.N. Halpin 2005

57
ArcGIS 9.2… Developments ModelBuilder Geodatabase Raster Support
NetCDF support Python Scripting P.N. Halpin 2005

58
Turtles: Cayman Islands
Geospatial tools for marine apps will need to model multiple dimensions with variable data quality… Turtles: Cayman Islands Dive Profiles: ~4D Data (X,Y,Z,T m…m) Z X Y T m P.N. Halpin 2005
 Z. X. Y. T. m. P.N. Halpin")
59
temperature gradients
Geospatial tools for marine apps will need to model time lags… Spatio-Temporal Models Marine animal distribution At large spatial scales: Temporal lags Oceanography (winds,currents) Primary productivity At finer spatial scales: Bathymetric and water temperature gradients Prey availability Marine mammal distribution P.N. Halpin 2005
 Primary. productivity. At finer spatial scales: Bathymetric and water. temperature gradients. Prey. availability. Marine mammal. distribution. P.N. Halpin")
60
“Persistent” SST Event
Geospatial tools for marine apps will need to model events… Spatio-Temporal Models Marine mammal distribution SST in Mid-Atlantic Time “Persistent” SST Event Statistical modeling approach will allow for “antecedent” oceanographic conditions to be used to more accurately predict potential habitat. Space P.N. Halpin 2005

61
Geospatial tools for marine apps will need to forecast…
The emerging management applications are at these finer temporal scales… P.N. Halpin 2005

62
Integrating statistical models
Geospatial tools for marine apps will need to integrate multivarite statistical models… Integrating statistical models ArcRstats Multivariate Modeling Script for ArcGIS This script can be used with ArcGIS to produce predictive maps based on different techniques using the free and robust R statistical package: Generalized Linear Model (GLM) Generalized Additive Model (GAM) Classification and Regression Tree (CART) Best, B. D., S. Loarie, S. Qian, P. Halpin, D. Urban, ArcRstats - multivariate habitat modeling with ArcGIS and R statistical software. Available at .
 Generalized Additive Model (GAM) Classification and Regression Tree (CART) Best, B. D., S. Loarie, S. Qian, P. Halpin, D. Urban, ArcRstats - multivariate habitat modeling with ArcGIS and R statistical software. Available at .")
63
Benthic habitat affinity models
Geospatial tools for marine apps will need to integrate multivarite statistical models… Benthic habitat affinity models Predicted Blue Rockfish habitat area P.N. Halpin 2005

64
Sampling through time and data layers…
Geospatial tools for marine apps will need to automate time series data acquisition & processing… Sampling through time and data layers… Observation data Python script NetCDF or HDF imagery SST Chl Depth time P.N. Halpin 2005

65
ArcMarine Data model and tool development
Geodatabase model structure will help with… Multivariate statistical models Temporally dynamic data acquistion & sampling Time sensitive predictions Data model standardization will promote usability of common tools and extensions… P.N. Halpin 2005

Similar presentations


 1.Set PowerPoint to work in Outline. View/Normal click.>")


