Download presentation
Presentation is loading. Please wait.

1
The basics for simulations

2
What is a Simulation? Simulation is a way to model random events, such that simulated outcomes closely match real-world outcomes. By observing simulated outcomes, researchers gain insight on the real world.

3
Why a Simulation? Some situations do not lend themselves to precise mathematical treatment. Others may be difficult, time-consuming, or expensive to analyze. In these situations, simulation may approximate real-world results; yet, require less time, effort, and/or money than other approaches.

4
The steps to creating a Simulation
1- Describe the possible outcomes. 2- Link each outcome to one or more random numbers. 3- Choose a source of random numbers (random # table / calculator). 4- Choose a random number. 5- Based on the random number, note the "simulated" outcome. 6- Repeat steps 4 and 5 multiple times; preferably, until the outcomes show a stable pattern. 7- Analyze the simulated outcomes and report results.
. 4- Choose a random number. 5- Based on the random number, note the simulated outcome. 6- Repeat steps 4 and 5 multiple times; preferably, until the outcomes show a stable pattern. 7- Analyze the simulated outcomes and report results.")
5
1- Describe the possible outcomes.
The Problem: On average, suppose a baseball player hits a home run once in every 10 times at bat, and suppose he gets exactly two "at bats" in every game. Using simulation, estimate the likelihood that the player will hit 2 home runs in a single game. 1- Describe the possible outcomes. He gets a home run or he doesn’t. A success would be 2 homeruns in a single game and everything else would be classified as a failure because we are interested in him getting 2 homeruns in a game.

6
2- Link each outcome to one or more random numbers.
The Problem: On average, suppose a baseball player hits a home run once in every 10 times at bat, and suppose he gets exactly two "at bats" in every game. Using simulation, estimate the likelihood that the player will hit 2 home runs in a single game. 2- Link each outcome to one or more random numbers. He is a 20% hitter so assign 01–20 as a hit and as an out. There are 100 numbers between 00 and 99 so each number represents 1%. A success is 2 homeruns in a game. A game is defined as 2 pair of random digits where each pair represents an “at bat”

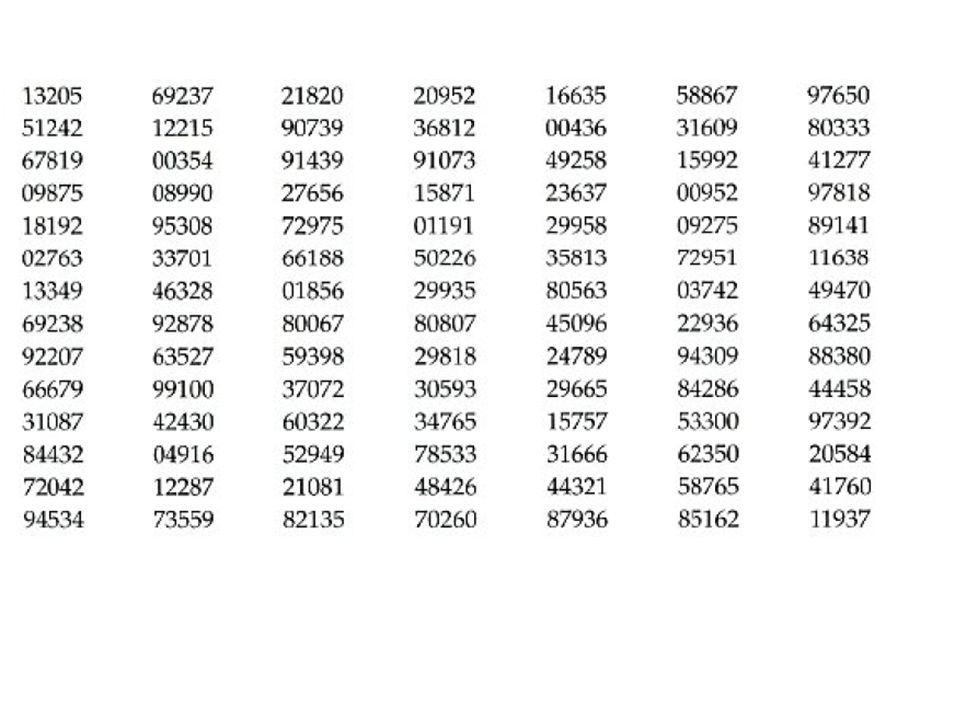
7
The Problem: On average, suppose a baseball player hits a home run once in every 10 times at bat, and suppose he gets exactly two "at bats" in every game. Using simulation, estimate the likelihood that the player will hit 2 home runs in a single game. 3- Choose a source of random numbers (random # table / calculator).
.")
8
4- Choose a random number.
The Problem: On average, suppose a baseball player hits a home run once in every 10 times at bat, and suppose he gets exactly two "at bats" in every game. Using simulation, estimate the likelihood that the player will hit 2 home runs in a single game. 4- Choose a random number. He is a 10% hitter so assign 01–10 as a hit and as an out. A success is 2 homeruns in a game. A game is defined as 2 pair of random digits. He gets 2 homeruns in a game: He does not get 2 home runs

9
The Problem: On average, suppose a baseball player hits a home run once in every 10 times at bat, and suppose he gets exactly two "at bats" in every game. Using simulation, estimate the likelihood that the player will hit 2 home runs in a single game. 5- Based on the random number, note the "simulated“ outcome.

10
The Problem: On average, suppose a baseball player hits a home run once in every 10 times at bat, and suppose he gets exactly two "at bats" in every game. Using simulation, estimate the likelihood that the player will hit 2 home runs in a single game. 6- Repeat steps 4 and 5 multiple times (lets run it 100 times) preferably, until the outcomes show a stable pattern.
 preferably, until the outcomes show a stable pattern.")
11
The Problem: On average, suppose a baseball player hits a home run once in every 10 times at bat, and suppose he gets exactly two "at bats" in every game. Using simulation, estimate the likelihood that the player will hit 2 home runs in a single game. He is a 10% hitter so assign 01–10 as a hit and as an out.

12
7- Analyze the simulated outcomes and report results.
The Problem: On average, suppose a baseball player hits a home run once in every 10 times at bat, and suppose he gets exactly two "at bats" in every game. Using simulation, estimate the likelihood that the player will hit 2 home runs in a single game. 7- Analyze the simulated outcomes and report results. Find the percent of games with homeruns or success / total games where success is defined as 2 home runs in a single game. Or you can graph each result like we did with the red lights example.

13
The Problem: You want each of the pictures of Lebron, Payton and Serena. Remember last class? When you check your wallet you find you can only afford 4 boxes of cereal. What is the probability that you will get all 3 pictures? Run the simulation at least 20 times.

Similar presentations


 Grants Chapter 6.>")