Download presentation
Presentation is loading. Please wait.

1
Population Growth, Distribution, and Density
Population Geography Population Growth, Distribution, and Density

2
POPULATION > It took until the year 1850 for the world to have a population of one billion. We will have over 9 billion by 2050.

3
By the year 2000, the world went over six billion!
> There are over 1 billion people in both China and in India, and India is catching up to China fast!!!

5
World and Country Population Totals
Distribution and Structure: 3/4 of people live on 5% of earth's surface! Total: 6,400,000,000 as of 3/04/04 (Real Time Pop Clock) Five most populous regions and countries REGION POPULATION COUNTRY POPULATION East Asia 1.5 billion China billion S.Asia 1.2 billion India 986 million Europe 750 million U.S million SE Asia 500 million Indonesia 206 million East N. A. 120 million Brazil 168 million
 Five most populous regions and countries. REGION POPULATION COUNTRY POPULATION. East Asia 1.5 billion China billion. S.Asia 1.2 billion India 986 million. Europe 750 million U.S. 274 million. SE Asia 500 million Indonesia 206 million. East N. A. 120 million Brazil 168 million.")
6
Geographical Statistics
The birthrate is the number of live births per thousand population. The highest birthrate is in Niger.

7
Geographical Statistics
The fertility rate shows the average number of children a woman of childbearing years will have in her lifetime. The worldwide fertility rate is 3.0.

8
Doubling Times The doubling time is the number of years before a population will be twice as large as it is today. World = 50 U.S. = 34 MDC = 543 LDC = 40 Honduras = 22 Belize = 19 Denmark = 700 Russia = never?

9
Fertility Rates 2.1 is generally regarded as a replacement rate (the rate at which a population neither grows nor shrinks) in the developed world. In less developed countries this rate should be higher (2.8?). Iran Mexico 2.57 USA Haiti 4.3 Italy India 3.0 Russia China 1.82 Why do women choose to have so many children in some countries and not it others? High infant mortality No Social Security Cultural preferences and fashion
 in the developed world. In less developed countries this rate should be higher (2.8 ). Iran 4.7 Mexico USA 2.0 Haiti 4.3. Italy 1.2 India 3.0. Russia 1.3 China Why do women choose to have so many children in some countries and not it others High infant mortality. No Social Security. Cultural preferences and fashion.")
10
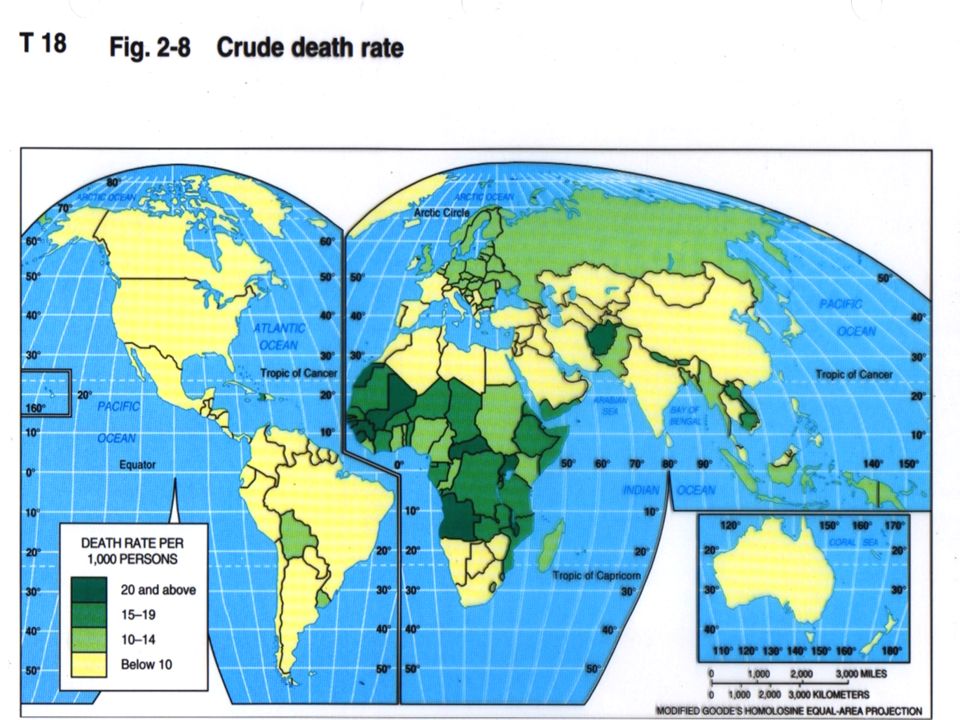
Geographic Statistics
The mortality rate, or death rate, is the number of deaths per thousand people. Nations with high mortality rates often have a large number of elderly people.

11
Geographic Statistics
The infant mortality rate shows the number of deaths among infants under age one per thousand live births. To find out the rate of population growth, subtract the mortality rate from the birthrate.

12
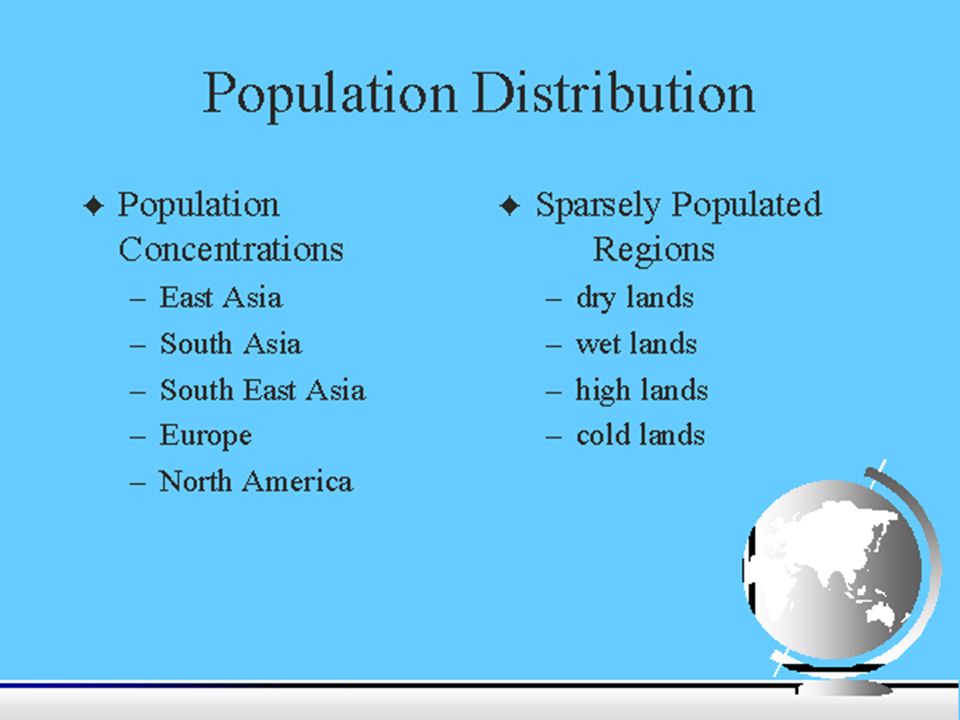
Population Distribution
Not all of the earth is suitable for human habitation. Ex: Tundra, desert, rain forest. Almost 90% of the Earth’s population lives in the Northern Hemisphere. One in four people lives in East Asia, and one half of the World’s population lives in East or South Asia.

13
Habitable Lands Habitable lands include lands that can support a dense human population. Weather is warm and wet enough to support agriculture. Concentrated along coasts and river valleys.

14
Urban-Rural Mix: More than half of the world’s population lives in rural areas. There are 26 giant cities, or megacities, home to more than 250 million people total. Tokyo is the largest with 28 million inhabitants

15
Migration Migration refers to the large-scale movement of people from one location to another. Reasons for migration are called push-pull factors. Push factors: reasons that cause people to leave Pull factors: draw or attract people to another location.

16
Population Density To understand how heavily populated an area is, geographers use a figure called population density. It refers to the average number of people who live in a measurable area, like a square mile.

17
Population Density Number can be misleading, especially in large nations. Ex: United States has a population density of 70.3 people per square mile. Alaska has a population density of one person per square mile, while New Jersey has 1,098 people per square mile.

20
Carrying Capacity Another component of population density is carrying capacity. Refers to number of organisms a piece of land can support.

21
Carrying Capacity Factors that affect carrying capacity: Fertile Soil
Technology Wealth Industry

24
Rates of Natural Increase

25
Infant Mortality

26
Population Pyramids a.k.a.
Population Diagrams Population Structures Age-Sex Diagrams Age-Sex Structures Age-Sex Pyramids

27
Population Pyramid Another way to analyze populations is to use a population pyramid. A population pyramid is a graphic device that shows sex and age distribution of a population Allows geographers the ability to analyze the effects of wars, famines, or epidemics on a population

28
High, Slow & Negative Growth

29
Developed vs Developing http://www. zo. utexas

30
Population Pyramid for the US:

31
Population Pyramid for Nigeria:

32
Look at what else one can ‘see’ in these diagrams

34
What does a ‘Baby Boom’ look like over time. http://www. nd

35
How will the population growth of the world and the USA affect you?

Similar presentations


 How does climate impact the population of a region? B) What climatic regions have the greatest populations? C) What climatic regions.>")


