Download presentation
Presentation is loading. Please wait.

1
Climate Literacy Session: Causes Peter Coombe August 5, 2015

2
{ Causes: Anthropogenic Climate Change

3
{ The “Keeling Curve”

4
1. Energy from the Sun – Radiation 2. Albedo – How Much Reflectivity 3. Atmospheric Composition SUN Mercury VenusMarsEarth What Factors Influence Climate?

5
1. Energy from the Sun – Radiation 2. Albedo – How Much Reflectivity 3. Atmospheric Composition MercuryVenusMars Earth What Factors Influence Climate? Equilibrium T (°F) Actual Surface T (°F) 324 356 14 847 -2 59 -67 -45
 Actual Surface T (°F)")
6
{

7
IceOceanLand Sub-surface Earth Atmosphere Heat from Surface About 31% reflected into space 69% absorbed at surface Solar radiation Earth’s Climate System Greenhouse Gases 59°F Sun

8
Land Sub-surface Atmosphere Heat from Surface Extract and burn fossil fuels add CO 2 to atmosphere More greenhouse gases, more radiation absorbed Additional heat retained, higher surface temperatures Earth’s Climate System Enhanced Greenhouse Effect “Anthropogenic Climate Change” Ocean Ice

9
More greenhouse gases, more radiation absorbed Compound Formula Contribution Approx. (%) Water vapor and Clouds H2OH2O 50% Water Vapor 25% Clouds Carbon dioxideCO 2 20% MethaneCH44% Other GHGs 1% When ranked by their direct contribution to the greenhouse effect, the most important GHGs are:
 Water vapor and Clouds H2OH2O 50% Water Vapor 25% Clouds Carbon dioxideCO 2 20% MethaneCH44% Other GHGs 1% When ranked by their direct contribution to the greenhouse effect, the most important GHGs are:.")
10
More greenhouse gases, more radiation absorbed Compound Formula Global Warming Potential- (GWP) Carbon dioxideCO 2 1 MethaneCH 4 25 Nitrous oxideN2ON2O298 Chlorofluorocarbons(CFCs)1,000- 10,000s Greenhouse Gases Anthropogenic Sources: GWP is used to calculate Carbon Dioxide Equivalents [CO2e] for emissions reporting
![More greenhouse gases, more radiation absorbed Compound Formula Global Warming Potential- (GWP) Carbon dioxideCO 2 1 MethaneCH 4 25 Nitrous oxideN2ON2O298 Chlorofluorocarbons(CFCs)1, ,000s Greenhouse Gases Anthropogenic Sources: GWP is used to calculate Carbon Dioxide Equivalents [CO2e] for emissions reporting](http://images.slideplayer.com/25/8113847/slides/slide_10.jpg "More greenhouse gases, more radiation absorbed Compound Formula Global Warming Potential- (GWP) Carbon dioxideCO 2 1 MethaneCH 4 25 Nitrous oxideN2ON2O298 Chlorofluorocarbons(CFCs)1, ,000s Greenhouse Gases Anthropogenic Sources: GWP is used to calculate Carbon Dioxide Equivalents [CO2e] for emissions reporting")
11
{ Changes in GHG Concentrations Image created by Robert A. Rohde

12
{ CO 2 Changes since the Industrial Revolution Image created by Robert A. Rohde

13
{

14
Visualization of the history of CO 2

15
{ So we’ve reached 400 ppm.… Now what happens? https://scripps.ucsd.edu/programs/keelingcurve/

16
Carbon Dioxide (CO 2 ) Absorption Emission
 Absorption Emission")
17
Greenhouse Gases trap heat because they absorb radiation in the infrared range, according to specific bond geometries and vibrational modes (ex CO 2 below)
")
18
IPCC(2007) Warming from increases in greenhouse gases
 Warming from increases in greenhouse gases")
19
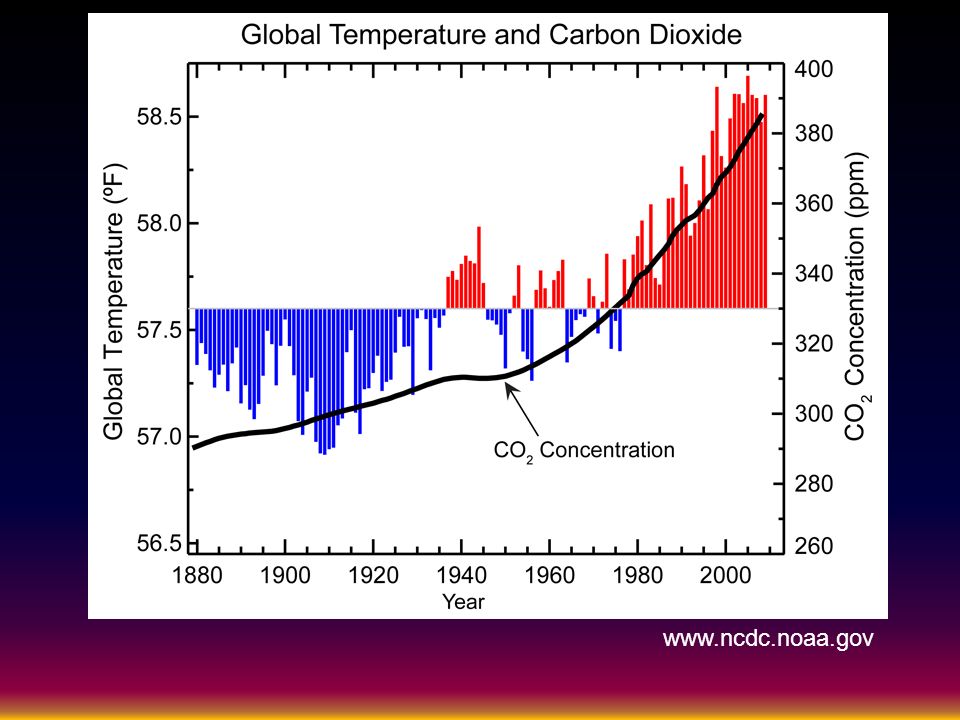
www.ncdc.noaa.gov
20
What do models tell us? Meehl et al. (2004)
")
21
The dominant mechanisms (to which recent climate change has been attributed) are anthropogenic: Increasing atmospheric concentrations of greenhouse gases Global changes to land surface, such as deforestation Increasing atmospheric concentrations of aerosols What about natural mechanisms? Changes in solar activity Volcanic activity What do models tell us?

22
Meehl et al. (2004)
")
23
Global Temperature and CO 2 CO 2 level today > 400 ppm

24
Take Home Points A basic physical understanding of the climate system: greenhouse gas concentrations have increased and their warming properties are well-established. Historical estimates of past climate changes suggest that the recent changes in global surface temperature are unusual. Computer-based climate models are unable to replicate the observed warming unless human greenhouse gas emissions are included.

Similar presentations


