Download presentation
Presentation is loading. Please wait.

1
The Impact of Learning Analytics on eLearning Design Patrick Devey, Ph.D. Chief Learning Officer KnowledgeOne Inc. Montréal, Québec, Canada

2
THE MISSING STUDENTS CAPER

3
“I seem to be missing a significant number of students at the final exam…” -FINA 200 Professor

4
“help…?” -FINA 200 Professor

5
WHERE DO WE BEGIN?

6
Student Logs (from LMS) Over 50,000 entries!!!
 Over 50,000 entries!!!")
7
Hazard Rate using Registration Data

8
Assignment 1 Assignment 2Assignment 3 Hazard Rate using Registration Data

9
THE MISSING STUDENTS CAPER …will return after these informative messages!

12
Learning Analytics Data must be: relevant to the learners and to the instructors, focuses on individual learners or a course, leads to informed decisions to improve learning services or products at the learner/course level. “The measurement, collection, analysis and reporting of data about learners and their contexts, for purposes of understanding and optimizing learning and the environments in which it occurs.” -The Society for Learning Analytics Research (SoLAR)
.")
13
Pascarella & Chapman (1983) 13 R 2 =.120
 13 R 2 =.120")
14
Data Sources LMS Google Analytics Surveys Industry Statistics & Reports Enrolment HR System xAPI Custom

15
INDUSTRY STATISTICS & REPORTS Easy to get, but do they apply to your situation?

16
http://en.wikipedia.org/wiki/Usage_share_of_operating_systems

20
How could this data be used? What are the main browsers used by our learners? – Quality assurance testing – Compatibility (HTML5, plug-ins, etc…) What are the primary operating systems being used by your learners? Are your learners making use of mobile devices? What are the trends? – Should you be making preparations because of them?
 What are the primary operating systems being used by your learners. Are your learners making use of mobile devices. What are the trends. – Should you be making preparations because of them .")
21
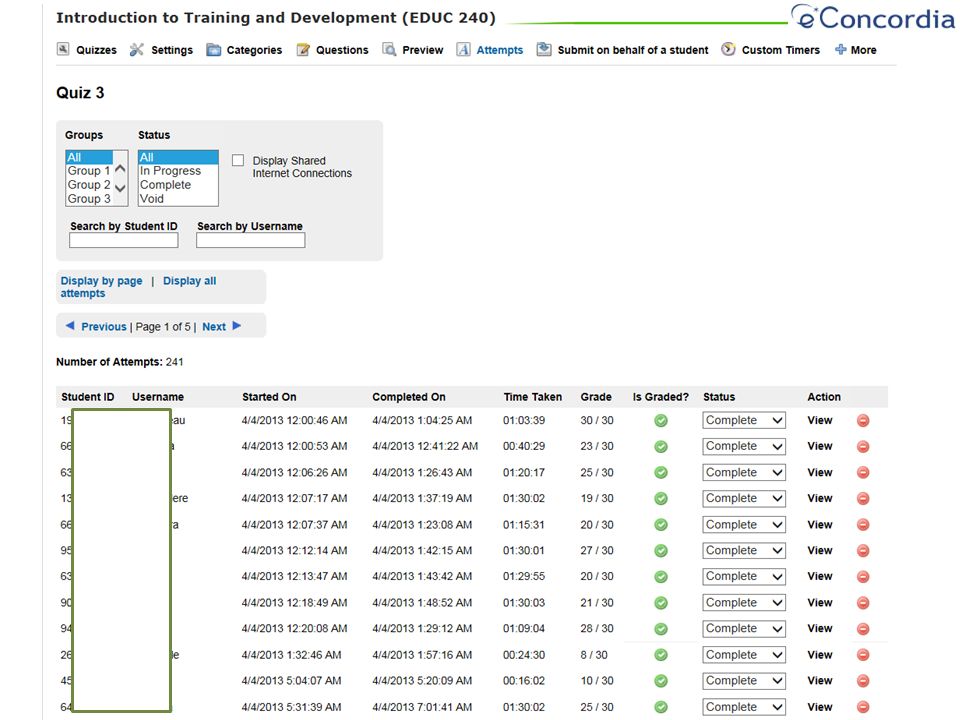
LEARNING MANAGEMENT SYSTEM It’s already being collected, might as well use it!

26
How could this data be used? When are learners most likely to be active? – Schedule live office hours – Schedule server maintenance Are learners achieving the learning objectives? – Adjustments to assessments – Adjustments to existing content – Addition of remedial content Is time-on-task correlated with performance? – Log-ins vs. performance – Identifying learners who have “stopped out”

27
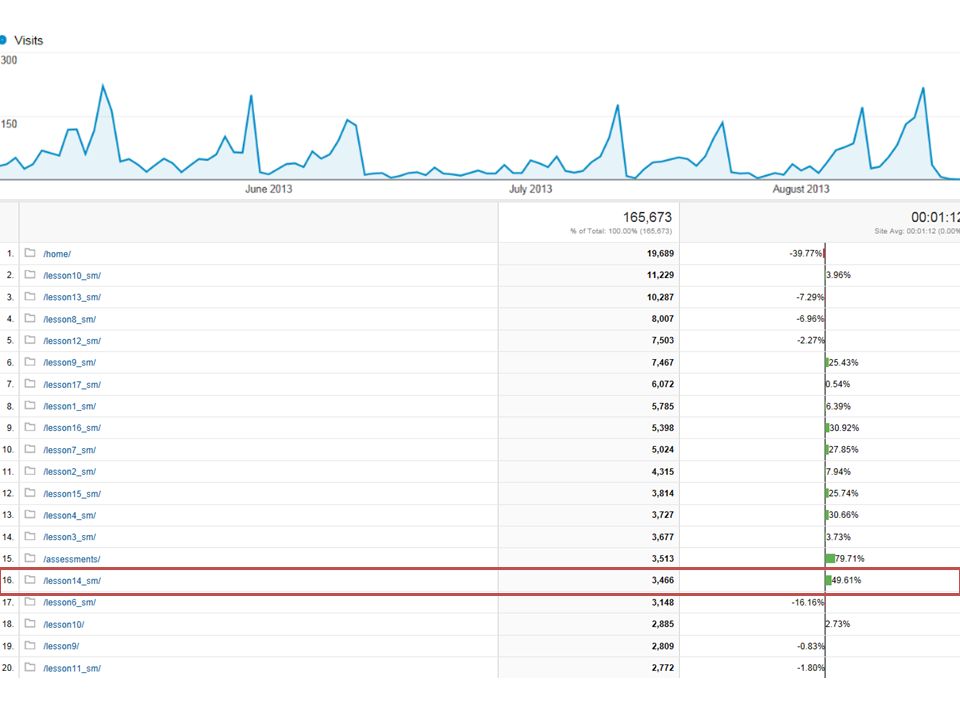
GOOGLE ANALYTICS Tuning in to the “Greatest Hits”

28
Demographic Data Browser Statistics, OS, Mobile, etc…

33
Quiz 1Quiz 2Quiz 3 Final Exam

36
Quiz 1Assignment 1 Orientation SessionAssignment 2Quiz 2Assignment 3Quiz 3Final Exam Midterm Break

39
031.aspx042.aspx

40
How could this data be used? Is my visual design effective? – Do I have buttons that are not being used? Can the site be optimized? How are learners navigating through the course website? – Are the navigation buttons being used as designed? Can they be improved or adapted? When are learners using particular course materials? – Is there an opportunity to send remedial content when it is relevant? How long are learners spending on individual sections? – Is there an opportunity to improve the content?

41
DESIGN YOUR OWN DATA COLLECTION If the data you want is not being collected, design a way to get it!

42
Who are the students enrolling in online courses at Concordia University? How do they compare to the general student population at Concordia as well as to the distance education literature? Why are students enrolling in online courses? What expectations do they have about their online course? Why do students drop out of online courses? Are there demographic, attitudinal, integration, and/or behavioural variables related to persistence? When do students drop out of online courses? What interventions can the institution make to curtail attrition in their online courses? What Patrick wanted to know

43
Timeframe of the Study 12345678910111213 Weeks of the Semester 1. Web-Based Learning Questionnaire 4. Registration Data 3. Exit Survey DNEDISC Dropout Zone 2. Weekly Survey

44
44

46
THE MISSING STUDENTS CAPER …and now, back to:

47
Finance: Course Satisfaction

48
Finance: Hazard Rate/Satisfaction 48 Assignment 1 Assignment 2Assignment 3

49
The Facts Significant portion of the class were non- business students – Struggling with basic concepts such as time value of money calculations Older, worked full-time, studied part-time – Did not have time to seek out instructor “in- between classes” or to go to campus Dropping out because of a fear of poor performance in the course

50
Interventions Live virtual office hours and tutorials scheduled when they were most needed – Dealt with the assignments – Sessions were recorded and posted on the course website Development of additional remedial content to address problem areas Provided links to the remedial content in the course content when they were relevant Altered assessments (rubric) for non-business students CASE CLOSED (kind of)
 for non-business students CASE CLOSED (kind of)")
51
WHAT DO YOU WANT TO IMPROVE?

52
What do you want to improve? Retention rate Transfer of training Achievement of learning objectives Performance on assessments Usability of the course website Services to instructors and learners ???

53
Take Action 1.Go beyond pass/fail to validate your learning solution. 2.Don’t let the system limit you. 3.Design the instruments you need to collect the metrics you want. 4.Don’t be intimidated by the numbers. 5.Continuously seek ways to improve.

54
Thank you! Merci! Questions? patrick.devey@knowledgeone.ca @patrickdevey http://survivingelearning.blogspot.ca http://www.knowledgeone.ca

Similar presentations


 Usability Study Website Visitor Study There Are Generally 3 Different.>")


