Download presentation
Presentation is loading. Please wait.

1
Action Research Deployment Teams September, 2006

2
Welcome! Housekeeping Items Housekeeping Items Workshop Materials/Binder Workshop Materials/Binder Meeting Dates Meeting Dates How are things different at your school this year compared to last year (in the context of continuous improvement?) How are things different at your school this year compared to last year (in the context of continuous improvement?) What kinds of things did you think about/plan for? What kinds of things did you think about/plan for?
 How are things different at your school this year compared to last year (in the context of continuous improvement ) What kinds of things did you think about/plan for. What kinds of things did you think about/plan for .")
4
Last Years Focus… Setting and Communicating Direction Setting and Communicating Direction District Strategic Plan (on a page) District Strategic Plan (on a page) A focus on the School Improvement Plan (SIP) A focus on the School Improvement Plan (SIP) 4 Quality Levels 4 Quality Levels Establishing structure/common language Establishing structure/common language Building Leadership Teams (BLTs) Building Leadership Teams (BLTs) Action Research Deployment Teams Action Research Deployment Teams Quality Liaisons Quality Liaisons
 District Strategic Plan (on a page) A focus on the School Improvement Plan (SIP) A focus on the School Improvement Plan (SIP) 4 Quality Levels 4 Quality Levels Establishing structure/common language Establishing structure/common language Building Leadership Teams (BLTs) Building Leadership Teams (BLTs) Action Research Deployment Teams Action Research Deployment Teams Quality Liaisons Quality Liaisons")
5
This Years Focus… This Years Focus… Utilize the School Improvement Plan (SIP) to align efforts Utilize the School Improvement Plan (SIP) to align efforts Deeper understanding of PDSA Deeper understanding of PDSA Practice each step of PDSA Practice each step of PDSA Learn the tools used Learn the tools used Connect all employees to School Improvement Plans and the District strategic plan Connect all employees to School Improvement Plans and the District strategic plan
 to align efforts Utilize the School Improvement Plan (SIP) to align efforts Deeper understanding of PDSA Deeper understanding of PDSA Practice each step of PDSA Practice each step of PDSA Learn the tools used Learn the tools used Connect all employees to School Improvement Plans and the District strategic plan Connect all employees to School Improvement Plans and the District strategic plan")
7
Action Research Is… Professional Learning Communities working together to solve problems Professional Learning Communities working together to solve problems Utilization of the 7 step, data-driven process of Plan-Do-Study-Act Utilization of the 7 step, data-driven process of Plan-Do-Study-Act Implementation of research-based best practices/improvement theory based root causes Implementation of research-based best practices/improvement theory based root causes A focus on continuous improvement by practitioners closest to the problem A focus on continuous improvement by practitioners closest to the problem

8
What do we really mean… Professional Learning Communities (PLC) In a professional learning community, there are deep collaborative discussions about current practices that might be hindering student academic success. - DuFour and Eaker

9
Action Research; The Vehicle Professional Learning Communities Use To Implement Change

10
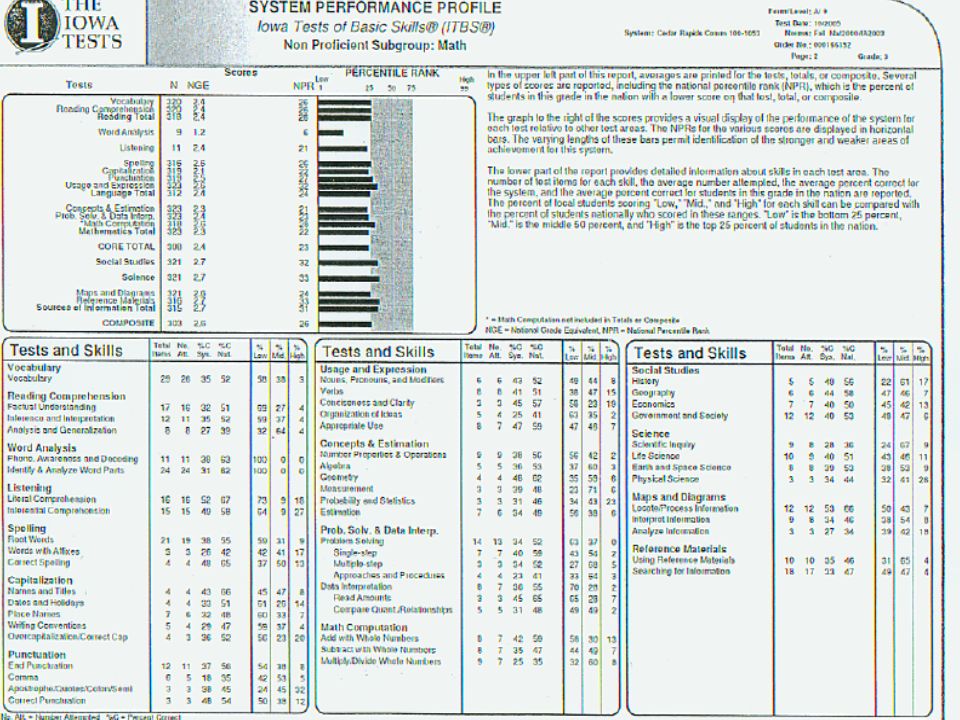
ITBS Language Total Scores This data shows the big picture of language proficiency …

11
This data digs deeper through sub test areas of language skills…

12
This data digs deeper through disaggregation of student subgroups & non-proficient groups… Vocabulary

13
Non-Proficient Subgroups: African American American Indian IEP Low Income Data Review- A Laser Like Focus!

14
Next Steps… The Building Leadership Team writes a SMART Goal that is included in the School Improvement Plan (SIP) The Building Leadership Team writes a SMART Goal that is included in the School Improvement Plan (SIP) Then, the Action Research Team utilizes the PDSA process to work on the goal Then, the Action Research Team utilizes the PDSA process to work on the goal
 The Building Leadership Team writes a SMART Goal that is included in the School Improvement Plan (SIP) Then, the Action Research Team utilizes the PDSA process to work on the goal Then, the Action Research Team utilizes the PDSA process to work on the goal")
15
So.. After reviewing vocabulary assessment data, teachers discuss options at a team meeting and use the PDSA process They define how they are currently teaching vocabulary (flowcharts) The team determines what other in-process measures they could use to see how students are doing in vocabulary and they collect data (run charts & pareto diagrams) to get baseline The team reviews the baseline data they collected and discuss root causes for the results they see (cause & effect diagrams & relations diagrams) Once root causes are identified, each member researches articles and best practices related to vocabulary instruction and submits the best to the group (improvement theory)
 The team determines what other in-process measures they could use to see how students are doing in vocabulary and they collect data (run charts & pareto diagrams) to get baseline The team reviews the baseline data they collected and discuss root causes for the results they see (cause & effect diagrams & relations diagrams) Once root causes are identified, each member researches articles and best practices related to vocabulary instruction and submits the best to the group (improvement theory).")
16
The team writes an action plan to carry out the improvement theory in their classrooms. Members practice newly-learned strategies (improvement theory), and measure the effectiveness of the strategies Members coach each other & may go into each others classroom to observe and provide feedback Members monitor student data to determine effectiveness of strategies (compare to baseline) Members reflect, observe, practice, receive feedback, gain expertise and standardize the new vocabulary instruction practice (new flowchart) Teams continue to use the PDSA cycle to make improvements in the realm of their professional learning community
, and measure the effectiveness of the strategies Members coach each other & may go into each others classroom to observe and provide feedback Members monitor student data to determine effectiveness of strategies (compare to baseline) Members reflect, observe, practice, receive feedback, gain expertise and standardize the new vocabulary instruction practice (new flowchart) Teams continue to use the PDSA cycle to make improvements in the realm of their professional learning community.")
17
Pre Planning: Identification of Need 1. Develop/Review Student Learning Expectations 2. Examine alignment of learning expectations with assessments 3. Review assessment data 4. Identify areas of need based on assessment Plan: 1. Describe the current process for addressing the identified area of need (flow chart) 2. Review data to determine baseline performance in the specific area identified (Run Chart/Pareto Diagram) 3. Identify potential root causes contributing to the identified area of need (Cause & Effect Diagram, 5 Whys, Relations Diagram) 4. Study research-based best practice/improvement theory addressing areas of need DO 1. Plan for implementation of improvement theory (Force Field Analysis, Action Plan) 2. Implement research-based best practices improvement theory based on root causes according to the Action Plan 3. Monitor the implementation of research-based best practice/improvement theory to insure integrity and fidelity 4. Assess student learning Study: 1. Examine student assessment results (compare to baseline) 2. Assess the impact of research-based best practice/improvement theory on student achievement Act: 1. Standardize the implementation of research- based best practice (improvement theory) that improved student learning (revise the flow chart to reflect changes made to the system) 2. If improvement theory was unsuccessful continue the PDSA cycle (try another improvement theory based on the next identified root causes) Action Research Overview for Professional Learning Communities
 2. Review data to determine baseline performance in the specific area identified (Run Chart/Pareto Diagram) 3. Identify potential root causes contributing to the identified area of need (Cause & Effect Diagram, 5 Whys, Relations Diagram) 4. Study research-based best practice/improvement theory addressing areas of need DO 1. Plan for implementation of improvement theory (Force Field Analysis, Action Plan) 2. Implement research-based best practices improvement theory based on root causes according to the Action Plan 3. Monitor the implementation of research-based best practice/improvement theory to insure integrity and fidelity 4. Assess student learning Study: 1. Examine student assessment results (compare to baseline) 2. Assess the impact of research-based best practice/improvement theory on student achievement Act: 1. Standardize the implementation of research- based best practice (improvement theory) that improved student learning (revise the flow chart to reflect changes made to the system) 2. If improvement theory was unsuccessful continue the PDSA cycle (try another improvement theory based on the next identified root causes) Action Research Overview for Professional Learning Communities.")
18
Pre Planning: Identification of Need 1. Develop/Review Student Learning Expectations 2. Examine alignment of learning expectations with assessments 3. Review assessment data 4. Identify areas of need based on assessment Plan: 1. Describe the current process for addressing the identified area of need (flow chart) 2. Review data to determine baseline performance in the specific area identified (Run Chart/Pareto Diagram) 3. Identify potential root causes contributing to the identified area of need (Cause & Effect Diagram, 5 Whys, Relations Diagram) 4. Study research-based best practice/improvement theory addressing areas of need DO 1. Plan for implementation of improvement theory (Force Field Analysis, Action Plan) 2. Implement research-based best practices improvement theory based on root causes according to the Action Plan 3. Monitor the implementation of research-based best practice/improvement theory to insure integrity and fidelity 4. Assess student learning Study: 1. Examine student assessment results (compare to baseline) 2. Assess the impact of research-based best practice/improvement theory on student achievement Act: 1. Standardize the implementation of research- based best practice (improvement theory) that improved student learning (revise the flow chart to reflect changes made to the system) 2. If improvement theory was unsuccessful continue the PDSA cycle (try another improvement theory based on the next identified root causes) Action Research Overview for Professional Learning Communities
 2. Review data to determine baseline performance in the specific area identified (Run Chart/Pareto Diagram) 3. Identify potential root causes contributing to the identified area of need (Cause & Effect Diagram, 5 Whys, Relations Diagram) 4. Study research-based best practice/improvement theory addressing areas of need DO 1. Plan for implementation of improvement theory (Force Field Analysis, Action Plan) 2. Implement research-based best practices improvement theory based on root causes according to the Action Plan 3. Monitor the implementation of research-based best practice/improvement theory to insure integrity and fidelity 4. Assess student learning Study: 1. Examine student assessment results (compare to baseline) 2. Assess the impact of research-based best practice/improvement theory on student achievement Act: 1. Standardize the implementation of research- based best practice (improvement theory) that improved student learning (revise the flow chart to reflect changes made to the system) 2. If improvement theory was unsuccessful continue the PDSA cycle (try another improvement theory based on the next identified root causes) Action Research Overview for Professional Learning Communities.")
20
Pre Planning: Identification of Need 1. Develop/Review Student Learning Expectations 2. Examine alignment of learning expectations with assessments 3. Review assessment data 4. Identify areas of need based on assessment Plan: 1. Describe the current process for addressing the identified area of need (flow chart) 2. Review data to determine baseline performance in the specific area identified (Run Chart/Pareto Diagram) 3. Identify potential root causes contributing to the identified area of need (Cause & Effect Diagram, 5 Whys, Relations Diagram) 4. Study research-based best practice/improvement theory addressing areas of need DO 1. Plan for implementation of improvement theory (Force Field Analysis, Action Plan) 2. Implement research-based best practices improvement theory based on root causes according to the Action Plan 3. Monitor the implementation of research-based best practice/improvement theory to insure integrity and fidelity 4. Assess student learning Study: 1. Examine student assessment results (compare to baseline) 2. Assess the impact of research-based best practice/improvement theory on student achievement Act: 1. Standardize the implementation of research- based best practice (improvement theory) that improved student learning (revise the flow chart to reflect changes made to the system) 2. If improvement theory was unsuccessful continue the PDSA cycle (try another improvement theory based on the next identified root causes) Action Research Overview for Professional Learning Communities
 2. Review data to determine baseline performance in the specific area identified (Run Chart/Pareto Diagram) 3. Identify potential root causes contributing to the identified area of need (Cause & Effect Diagram, 5 Whys, Relations Diagram) 4. Study research-based best practice/improvement theory addressing areas of need DO 1. Plan for implementation of improvement theory (Force Field Analysis, Action Plan) 2. Implement research-based best practices improvement theory based on root causes according to the Action Plan 3. Monitor the implementation of research-based best practice/improvement theory to insure integrity and fidelity 4. Assess student learning Study: 1. Examine student assessment results (compare to baseline) 2. Assess the impact of research-based best practice/improvement theory on student achievement Act: 1. Standardize the implementation of research- based best practice (improvement theory) that improved student learning (revise the flow chart to reflect changes made to the system) 2. If improvement theory was unsuccessful continue the PDSA cycle (try another improvement theory based on the next identified root causes) Action Research Overview for Professional Learning Communities.")
21
Plan- Define The System What is the current way that the process is done or handled? What is the current way that the process is done or handled? Tool: Flow Chart Tool: Flow Chart

23
Flow Chart What is it? - A picture of any process - Drawn with standard symbols representing different types of activities - Different styles available: - Deployment - Process

24
Flow Chart Purpose - Defines the system being studied - Gets agreement - Identifies value added activities - Identifies dead wood activities - Documents changes to the process

25
Deployment Flow Chart How is it made? 1. Define the process boundaries (starting point / stopping point). 2. Describe the process in operation. 3. Draw the People Coordinate. 4. List major steps in the process. 5. Draw the flow chart, using symbols 6. Study the flow chart.
. 2. Describe the process in operation. 3. Draw the People Coordinate. 4. List major steps in the process. 5. Draw the flow chart, using symbols 6. Study the flow chart..")
26
Start Task Make a Decision YesNo Conduct a Meeting Report Out End of Process

27
Flow Chart Example

28
KidsParents Bed Time Initiate Bed Time Procedures Are Kids Ready For Bed? Begin Bed Time Routine Brush TeethGo Potty Put On P.J.s YES NO Meet Need So Kids Are Ready For Bed Read Story Say Prayers Tuck In Kids Gets Into Bed

29
Flow Chart Lets practice the Flow Chart tool At your table, create a flow chart for the teachers lunch break routine –Describe the process and key steps involved

30
Team Time! 1. Define the process boundaries (starting point / stopping point). 2. Describe the process in operation. 3. Draw the People Coordinate. 4. List major steps in the process. 5. Draw the flow chart, using symbols 6. Study the flow chart.

31
Pre Planning: Identification of Need 1. Develop/Review Student Learning Expectations 2. Examine alignment of learning expectations with assessments 3. Review assessment data 4. Identify areas of need based on assessment Plan: 1. Describe the current process for addressing the identified area of need (flow chart) 2. Review data to determine baseline performance in the specific area identified (Run Chart/Pareto Diagram) 3. Identify potential root causes contributing to the identified area of need (Cause & Effect Diagram, 5 Whys, Relations Diagram) 4. Study research-based best practice/improvement theory addressing areas of need DO 1. Plan for implementation of improvement theory (Force Field Analysis, Action Plan) 2. Implement research-based best practices improvement theory based on root causes according to the Action Plan 3. Monitor the implementation of research-based best practice/improvement theory to insure integrity and fidelity 4. Assess student learning Study: 1. Examine student assessment results (compare to baseline) 2. Assess the impact of research-based best practice/improvement theory on student achievement Act: 1. Standardize the implementation of research- based best practice (improvement theory) that improved student learning (revise the flow chart to reflect changes made to the system) 2. If improvement theory was unsuccessful continue the PDSA cycle (try another improvement theory based on the next identified root causes) Action Research Overview for Professional Learning Communities
 2. Review data to determine baseline performance in the specific area identified (Run Chart/Pareto Diagram) 3. Identify potential root causes contributing to the identified area of need (Cause & Effect Diagram, 5 Whys, Relations Diagram) 4. Study research-based best practice/improvement theory addressing areas of need DO 1. Plan for implementation of improvement theory (Force Field Analysis, Action Plan) 2. Implement research-based best practices improvement theory based on root causes according to the Action Plan 3. Monitor the implementation of research-based best practice/improvement theory to insure integrity and fidelity 4. Assess student learning Study: 1. Examine student assessment results (compare to baseline) 2. Assess the impact of research-based best practice/improvement theory on student achievement Act: 1. Standardize the implementation of research- based best practice (improvement theory) that improved student learning (revise the flow chart to reflect changes made to the system) 2. If improvement theory was unsuccessful continue the PDSA cycle (try another improvement theory based on the next identified root causes) Action Research Overview for Professional Learning Communities.")
32
In Process Measures Data that can be collected frequently How much data is needed? How many data points? Measurement instrument may need to be created if one is not readily available Need an apples to apples comparison to determine if improvement theory worked At your table… Brainstorm possible measures for each SIP goal

33
In-Process Measure Example

34
Assess The Situation Once in-process measures have been identified and data collected… What does the baseline data look like? –This shows the current state of the area being studied Tools: Run Chart & Pareto Diagram

36
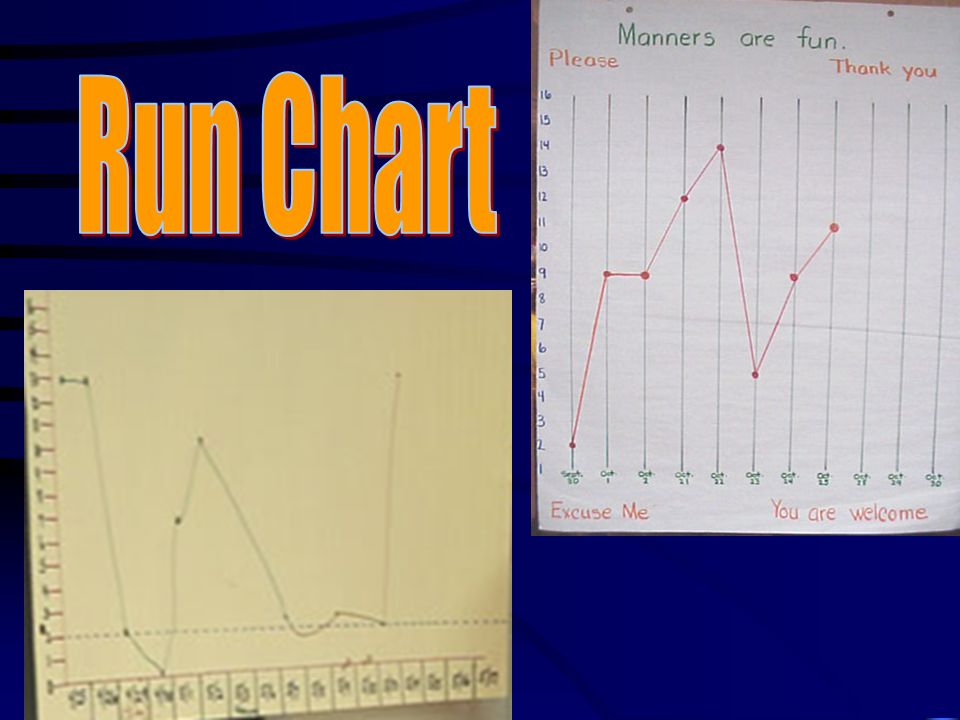
Run Chart What is it? A line graph (data plotted over time) Looks at the systems behavior over time Used by teams when gathering baseline data at the beginning of a PDSA project and again after the improvement theory has been tried
 Looks at the systems behavior over time Used by teams when gathering baseline data at the beginning of a PDSA project and again after the improvement theory has been tried.")
37
Estimation Check Sheet Weekly Class Errors Hour 1 - Mr. Albert Strategy123456 Total 1-6 Week12-Sep19-Sep29-Sep3-Oct10-Oct17-Oct Addition 2211006 Subtraction 22312111 Multiplication 78787744 Division 10111011121064 Application 11 101112 67 28 students Total Errors 323431323330192 Number of Students 28

39
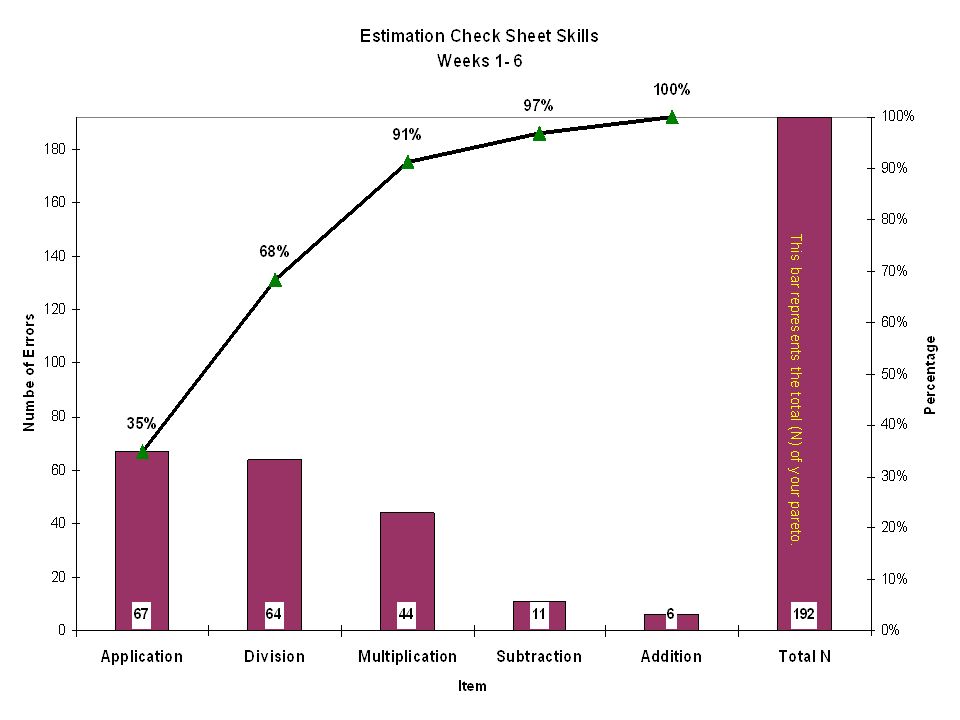
Next… Pareto Diagram Paretos Law 80/20 Run chart = data over time Pareto Diagram = discrepancy data

40
Pareto Diagram What is it? - A bar chart which ranks related measures in decreasing order of occurrence - A tool to separate the significant aspects from the trivial ones

41
Pareto Diagram How is it made? 1. Collect the data. 2. Construct a frequency table. 3. Draw and scale the horizontal and vertical axes. 4. Draw and label the bars for each category 5. Draw the cumulative percentage line. 6. Review the results of the Pareto.

42
Pareto Diagram Sample Collect The Data CategoryTotal Unexcused Absences35 Drug & Alcohol Abuse7 Tardiness47 Illegal Parking2 Dress Code Violation1 Vandalism2 Class Disruption19 Fighting & Assault10 Total123 Raw Data

43
Construct Frequency Table CategoryFrequency Cumulative Frequency 1.Tardiness47 2. Unexcused Absences3582 3. Class Disruption19101 4. Fighting & Assault10111 5. Drug & Alcohol Abuse 7118 6. Illegal Parking2120 7. Vandalism2122 8. Dress Code Violation 1123 Total 123 Data In Order

44
Draw & Scale Horizontal & Vertical Axes 123 0 100% 75% 50% 25% 0

45
Draw & Label The Bars Draw Cumulative % Line

49
PDSA Tidbits! Time to implement/deploy varies by team and content area Doesnt happen necessarily in a school year The entire school doesnt have to implement all improvement theories at once Multiple grades/departments could be working on individual aspects of the issue Is a PROCESS and a work in progress!

50
In Closing… Workshop Evaluation Next steps… Focus each PDSA team on the SMART goal of the SIP Consult the PDSA guides for help Work on Define the System ( Flow Chart) Work on Assess the Situation (In-Process Measures, Run Chart, Pareto Diagram) Set and communicate direction!
 Work on Assess the Situation (In-Process Measures, Run Chart, Pareto Diagram) Set and communicate direction!")
51
Action Research Deployment Teams September, 2006

Similar presentations