Download presentation
Presentation is loading. Please wait.

1
Action Research Deployment Teams November 29/30, 2006

2
Please Sit By SIP Goal Area Table Tents Indicate Goal Area

3
Welcome! Introductions around the table Introductions around the table Sharing PDSA progress Sharing PDSA progress How are PDSA efforts going at your school? How are PDSA efforts going at your school? Place a sticky dot in section of PDSA that represents where you are at in the process (review the Action Research Overview PDSA diagram from session 1/binder) Place a sticky dot in section of PDSA that represents where you are at in the process (review the Action Research Overview PDSA diagram from session 1/binder)
 Place a sticky dot in section of PDSA that represents where you are at in the process (review the Action Research Overview PDSA diagram from session 1/binder).")
4
Where did we leave off again? A quick review of last session

5
Pre Planning: Identification of Need 1. Develop/Review Student Learning Expectations 2. Examine alignment of learning expectations with assessments 3. Review assessment data 4. Identify areas of need based on assessment Plan: 1. Describe the current process for addressing the identified area of need (flow chart) 2. Review data to determine baseline performance in the specific area identified (Run Chart/Pareto Diagram) 3. Identify potential root causes contributing to the identified area of need (Cause & Effect Diagram, 5 Whys, Relations Diagram) 4. Study research-based best practice/improvement theory addressing areas of need DO 1. Plan for implementation of improvement theory (Force Field Analysis, Action Plan) 2. Implement research-based best practices improvement theory based on root causes according to the Action Plan 3. Monitor the implementation of research-based best practice/improvement theory to insure integrity and fidelity 4. Assess student learning Study: 1. Examine student assessment results (compare to baseline) 2. Assess the impact of research-based best practice/improvement theory on student achievement Act: 1. Standardize the implementation of research- based best practice (improvement theory) that improved student learning (revise the flow chart to reflect changes made to the system) 2. If improvement theory was unsuccessful continue the PDSA cycle (try another improvement theory based on the next identified root causes) Action Research Overview for Professional Learning Communities
 2. Review data to determine baseline performance in the specific area identified (Run Chart/Pareto Diagram) 3. Identify potential root causes contributing to the identified area of need (Cause & Effect Diagram, 5 Whys, Relations Diagram) 4. Study research-based best practice/improvement theory addressing areas of need DO 1. Plan for implementation of improvement theory (Force Field Analysis, Action Plan) 2. Implement research-based best practices improvement theory based on root causes according to the Action Plan 3. Monitor the implementation of research-based best practice/improvement theory to insure integrity and fidelity 4. Assess student learning Study: 1. Examine student assessment results (compare to baseline) 2. Assess the impact of research-based best practice/improvement theory on student achievement Act: 1. Standardize the implementation of research- based best practice (improvement theory) that improved student learning (revise the flow chart to reflect changes made to the system) 2. If improvement theory was unsuccessful continue the PDSA cycle (try another improvement theory based on the next identified root causes) Action Research Overview for Professional Learning Communities.")
7
Pre Planning: Identification of Need 1. Develop/Review Student Learning Expectations 2. Examine alignment of learning expectations with assessments 3. Review assessment data 4. Identify areas of need based on assessment Plan: 1. Describe the current process for addressing the identified area of need (flow chart) 2. Review data to determine baseline performance in the specific area identified (Run Chart/Pareto Diagram) 3. Identify potential root causes contributing to the identified area of need (Cause & Effect Diagram, 5 Whys, Relations Diagram) 4. Study research-based best practice/improvement theory addressing areas of need DO 1. Plan for implementation of improvement theory (Force Field Analysis, Action Plan) 2. Implement research-based best practices improvement theory based on root causes according to the Action Plan 3. Monitor the implementation of research-based best practice/improvement theory to insure integrity and fidelity 4. Assess student learning Study: 1. Examine student assessment results (compare to baseline) 2. Assess the impact of research-based best practice/improvement theory on student achievement Act: 1. Standardize the implementation of research- based best practice (improvement theory) that improved student learning (revise the flow chart to reflect changes made to the system) 2. If improvement theory was unsuccessful continue the PDSA cycle (try another improvement theory based on the next identified root causes) Action Research Overview for Professional Learning Communities
 2. Review data to determine baseline performance in the specific area identified (Run Chart/Pareto Diagram) 3. Identify potential root causes contributing to the identified area of need (Cause & Effect Diagram, 5 Whys, Relations Diagram) 4. Study research-based best practice/improvement theory addressing areas of need DO 1. Plan for implementation of improvement theory (Force Field Analysis, Action Plan) 2. Implement research-based best practices improvement theory based on root causes according to the Action Plan 3. Monitor the implementation of research-based best practice/improvement theory to insure integrity and fidelity 4. Assess student learning Study: 1. Examine student assessment results (compare to baseline) 2. Assess the impact of research-based best practice/improvement theory on student achievement Act: 1. Standardize the implementation of research- based best practice (improvement theory) that improved student learning (revise the flow chart to reflect changes made to the system) 2. If improvement theory was unsuccessful continue the PDSA cycle (try another improvement theory based on the next identified root causes) Action Research Overview for Professional Learning Communities.")
9
Pre Planning: Identification of Need 1. Develop/Review Student Learning Expectations 2. Examine alignment of learning expectations with assessments 3. Review assessment data 4. Identify areas of need based on assessment Plan: 1. Describe the current process for addressing the identified area of need (flow chart) 2. Review data to determine baseline performance in the specific area identified (Run Chart/Pareto Diagram) 3. Identify potential root causes contributing to the identified area of need (Cause & Effect Diagram, 5 Whys, Relations Diagram) 4. Study research-based best practice/improvement theory addressing areas of need DO 1. Plan for implementation of improvement theory (Force Field Analysis, Action Plan) 2. Implement research-based best practices improvement theory based on root causes according to the Action Plan 3. Monitor the implementation of research-based best practice/improvement theory to insure integrity and fidelity 4. Assess student learning Study: 1. Examine student assessment results (compare to baseline) 2. Assess the impact of research-based best practice/improvement theory on student achievement Act: 1. Standardize the implementation of research- based best practice (improvement theory) that improved student learning (revise the flow chart to reflect changes made to the system) 2. If improvement theory was unsuccessful continue the PDSA cycle (try another improvement theory based on the next identified root causes) Action Research Overview for Professional Learning Communities
 2. Review data to determine baseline performance in the specific area identified (Run Chart/Pareto Diagram) 3. Identify potential root causes contributing to the identified area of need (Cause & Effect Diagram, 5 Whys, Relations Diagram) 4. Study research-based best practice/improvement theory addressing areas of need DO 1. Plan for implementation of improvement theory (Force Field Analysis, Action Plan) 2. Implement research-based best practices improvement theory based on root causes according to the Action Plan 3. Monitor the implementation of research-based best practice/improvement theory to insure integrity and fidelity 4. Assess student learning Study: 1. Examine student assessment results (compare to baseline) 2. Assess the impact of research-based best practice/improvement theory on student achievement Act: 1. Standardize the implementation of research- based best practice (improvement theory) that improved student learning (revise the flow chart to reflect changes made to the system) 2. If improvement theory was unsuccessful continue the PDSA cycle (try another improvement theory based on the next identified root causes) Action Research Overview for Professional Learning Communities.")
10
In-Process Measure Example

11
Estimation Check Sheet Weekly Class Errors Hour 1 - Mr. Albert Strategy123456 Total 1-6 Week12-Sep19-Sep29-Sep3-Oct10-Oct17-Oct Addition 2211006 Subtraction 22312111 Multiplication 78787744 Division 10111011121064 Application 11 101112 67 28 students Total Errors 323431323330192 Number of Students 28

14
More on In- Process Measures Assessment of learning Vs. assessment for learning –Rick Stiggins

15
From High Stakes Assessment to In-Process Measures Mistaken Belief: Its the adults who use assessment results to make the most important instructional decisions… Mistaken Belief: The most important decisions are made annually based on annual high-stakes tests

16
What Do Your In-Process Measures Look Like? Talk about what in-process measures your team is using How are things going? –What is working well? –What is your team struggling with?

17
What are we doing today? Continuing the PDSA Cycle

18
Pre Planning: Identification of Need 1. Develop/Review Student Learning Expectations 2. Examine alignment of learning expectations with assessments 3. Review assessment data 4. Identify areas of need based on assessment Plan: 1. Describe the current process for addressing the identified area of need (flow chart) 2. Review data to determine baseline performance in the specific area identified (Run Chart/Pareto Diagram) 3. Identify potential root causes contributing to the identified area of need (Cause & Effect Diagram, 5 Whys, Relations Diagram) 4. Study research-based best practice/improvement theory addressing areas of need DO 1. Plan for implementation of improvement theory (Force Field Analysis, Action Plan) 2. Implement research-based best practices improvement theory based on root causes according to the Action Plan 3. Monitor the implementation of research-based best practice/improvement theory to insure integrity and fidelity 4. Assess student learning Study: 1. Examine student assessment results (compare to baseline) 2. Assess the impact of research-based best practice/improvement theory on student achievement Act: 1. Standardize the implementation of research- based best practice (improvement theory) that improved student learning (revise the flow chart to reflect changes made to the system) 2. If improvement theory was unsuccessful continue the PDSA cycle (try another improvement theory based on the next identified root causes) Action Research Overview for Professional Learning Communities
 2. Review data to determine baseline performance in the specific area identified (Run Chart/Pareto Diagram) 3. Identify potential root causes contributing to the identified area of need (Cause & Effect Diagram, 5 Whys, Relations Diagram) 4. Study research-based best practice/improvement theory addressing areas of need DO 1. Plan for implementation of improvement theory (Force Field Analysis, Action Plan) 2. Implement research-based best practices improvement theory based on root causes according to the Action Plan 3. Monitor the implementation of research-based best practice/improvement theory to insure integrity and fidelity 4. Assess student learning Study: 1. Examine student assessment results (compare to baseline) 2. Assess the impact of research-based best practice/improvement theory on student achievement Act: 1. Standardize the implementation of research- based best practice (improvement theory) that improved student learning (revise the flow chart to reflect changes made to the system) 2. If improvement theory was unsuccessful continue the PDSA cycle (try another improvement theory based on the next identified root causes) Action Research Overview for Professional Learning Communities.")
19
Identifying Root Cause! 3 Quality Tools –Cause and Effect Diagram –Relations Diagram –5 Whys

21
Cause & Effect Diagram How is it made? 1. Identify the problem. 2. Record the problem statement. 3. Draw and label the main bones. 4. Brainstorm for problem causes. 5. Identify the most likely cause candidates.

22
PeopleInstructional Materials State/National Requirements Methodology Low Integration of State Test Objectives Across Curriculum Areas Internal resistance to change Lack of knowledge Lack of information Teachers have no knowledge on how to integrate Time Worksheets & games isolate skills State tests divided by content area Identified Problem (effect) Backbone Primary Causal Categories Cause Sub Cause
 Backbone Primary Causal Categories Cause Sub Cause")
24
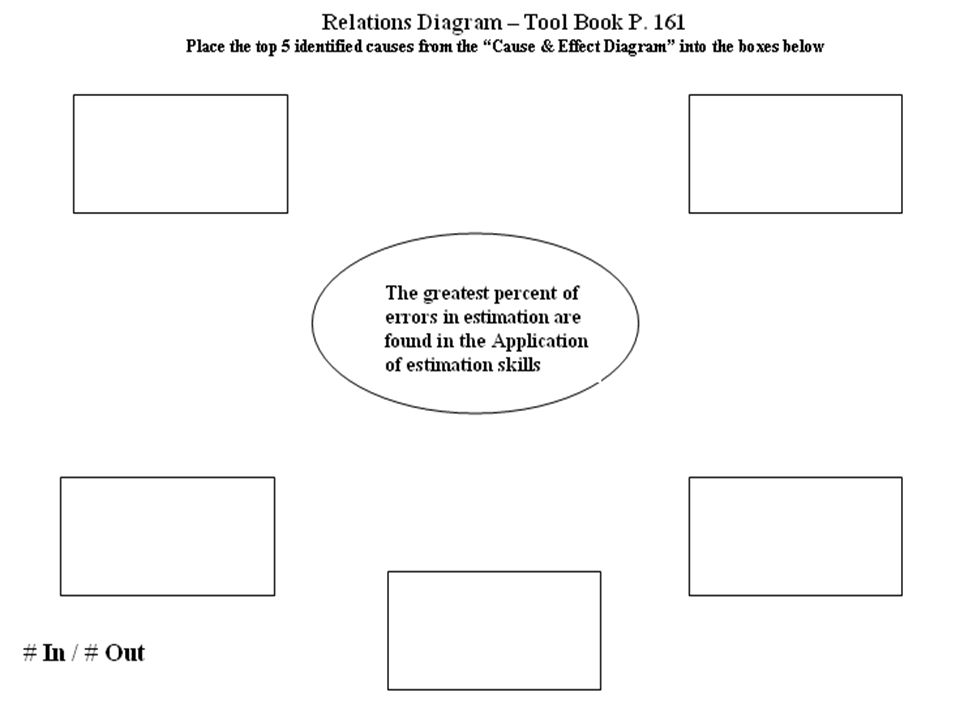
Whats Next? After completing the Cause and Effect Diagram, the Relations Diagram can help identify root causes

25
Relations Diagram

26
How is it made? 1. Clearly define the issue or problem. 2. Construct the diagram layout. 3. Analyze the relationships. 4. Count the arrows. 5. Identify the root causes and effects. 6. Study the final diagram.

27
Problems in Physical Education) The Teacher Was Mean Some Students Were Not Listening To The Teacher The Teacher Yelled At Us Some Students Were Not Behaving #In / #Out 2 / 1 3 / 0 0 / 3 1/ 2 Root causes are those factors or aspects of a problem which primarily influence other factors (arrows out)
 The Teacher Was Mean Some Students Were Not Listening To The Teacher The Teacher Yelled At Us Some Students Were Not Behaving #In / #Out 2 / 1 3 / 0 0 / 3 1/ 2 Root causes are those factors or aspects of a problem which primarily influence other factors (arrows out)")
29
Root Cause Identified Once root cause is identified… it is time to select a research-based improvement theory

30
Pre Planning: Identification of Need 1. Develop/Review Student Learning Expectations 2. Examine alignment of learning expectations with assessments 3. Review assessment data 4. Identify areas of need based on assessment Plan: 1. Describe the current process for addressing the identified area of need (flow chart) 2. Review data to determine baseline performance in the specific area identified (Run Chart/Pareto Diagram) 3. Identify potential root causes contributing to the identified area of need (Cause & Effect Diagram, 5 Whys, Relations Diagram) 4. Study research-based best practice/improvement theory addressing areas of need DO 1. Plan for implementation of improvement theory (Force Field Analysis, Action Plan) 2. Implement research-based best practices improvement theory based on root causes according to the Action Plan 3. Monitor the implementation of research-based best practice/improvement theory to insure integrity and fidelity 4. Assess student learning Study: 1. Examine student assessment results (compare to baseline) 2. Assess the impact of research-based best practice/improvement theory on student achievement Act: 1. Standardize the implementation of research- based best practice (improvement theory) that improved student learning (revise the flow chart to reflect changes made to the system) 2. If improvement theory was unsuccessful continue the PDSA cycle (try another improvement theory based on the next identified root causes) Action Research Overview for Professional Learning Communities
 2. Review data to determine baseline performance in the specific area identified (Run Chart/Pareto Diagram) 3. Identify potential root causes contributing to the identified area of need (Cause & Effect Diagram, 5 Whys, Relations Diagram) 4. Study research-based best practice/improvement theory addressing areas of need DO 1. Plan for implementation of improvement theory (Force Field Analysis, Action Plan) 2. Implement research-based best practices improvement theory based on root causes according to the Action Plan 3. Monitor the implementation of research-based best practice/improvement theory to insure integrity and fidelity 4. Assess student learning Study: 1. Examine student assessment results (compare to baseline) 2. Assess the impact of research-based best practice/improvement theory on student achievement Act: 1. Standardize the implementation of research- based best practice (improvement theory) that improved student learning (revise the flow chart to reflect changes made to the system) 2. If improvement theory was unsuccessful continue the PDSA cycle (try another improvement theory based on the next identified root causes) Action Research Overview for Professional Learning Communities.")
31
Introduction To Research-Based Improvement Theories

32
NCLB and the Quest for Scientifically Based Research NCLB encourages - Instructional strategies shown to be effective through sound scientific research. Systematic, empirical methods Rigorous data analysis Meeting the highest standards of research in your discipline

33
Iowa Department of Education Content Network Best practice research in: – Reading – Math – Science

34
Pyramid Continuum

35
LEVEL 5Gold Standard Randomly assigning subjects to treatments yields findings that generate the greatest confidence in treatment effect.

36
LEVEL 4Strong Evidence Research designs that do not randomly assign subjects to treatments. With these designs a logical rather than a statistical argument is used to support the validity of the results. LEVEL 3Promising Studies A combination of studies, consistent across time and subjects, that shows some promise even though the individual studies do not meet the requirements for levels 4 and 5.

37
LEVEL 2Marginal These are case studies, conducted by individual investigators. Such reports are by no means worthless, but it is difficult to assess the validity and generalizability of the treatment. LEVEL 1No Empirical Evidence Reports are anecdotal, testimonial, etc.

38
IOWA Content Network http://www.iowa.gov/educate/prodev/main.html

41
ASCD is the Association for Supervision & Curriculum Development Mission statement: ASCD, a community of educators advocating sound policies and sharing best practices to achieve the success of each learner. http://www.ascd.org/portal/site/ascd

42
Educational Leadership Magazine As legislators contemplate reauthorizing and revising the No Child Left Behind Act (NCLB), the authors in this issue of Educational Leadership offer the following recommendations: use multiple assessments to inform instruction; design valid accountability measures for schools; support teachers with resources and training; make sure regulations don't have the unintended consequence of limiting the curriculum; and, finally, consider how NCLB is affecting the students - it is meant to help. Educational Leadership

43
ASCD ASCD SmartBrief is a FREE daily news briefing delivered directly to you through e- mail. Each ASCD SmartBrief takes you straight to the most salient news and trends affecting education today. This FREE service will help you break through the information overload and provide quick, easy-to-read summaries of top news in areas important to you. http://www.smartbrief.com/ascd/

44
National Science Teachers Association www.nsta.org www.nsta.org

45
State Approved Research Based Strategies Web Resources for Reading/Thinking Strategies Excellent starting point: http://www.netc.org/focus/strategies/ PreP Prereading Plan http://literacy.kent.edu/eureka/strategies/prep.pdf http://www.justreadnow.com/strategies/prep.htm Advanced Organizer http://scied.gsu.edu/Hassard/mos/2.10.html http://www.glnd.k12.va.us/resources/graphicalorganizers/ http://www.ncrel.org/sdrs/areas/issues/students/learning/lr100.htm Anticipation Guides http://www.indiana.edu/%7el517/anticipation_guides.htm http://www.greece.k12.ny.us/instruction/ela/6- 12/Reading/Reading%20Strategies/anticipation%20guide.htmhttp://www.greece.k12.ny.us/instruction/ela/6- 12/Reading/Reading%20Strategies/anticipation%20guide.htm

46
Mathematics - Great Resources National Council of Teachers of Mathematics NCTM Principles and Standards (free) Curriculum Focal Points (free) Journals (some articles are free down loads) Iowa Council of Teachers of Mathematics State meetings State contacts AEA contacts U.S. Dept. of Math and Science Professional Development Reports Math Forum Ask Dr. Math Your friendly math facilitator

47
Learning From Dramatically Improved Schools!

48
40% 50% 60% 70% 80% 90% 100% 91–9292–9393–9494–9595–9696–9797–9898–9999–00 Reading Test Scores - Brazosport ISD African American All Students Hispanic White Economically Disadvantaged 98% 96.6% 93.9% 93.8% 92.3% 82% 70% 64% 60% 50%

49
40% 50% 60% 70% 80% 90% 100% 91–9292–9393–9494–9595–9696–9797–9898–9999–00 Writing Test Scores - Brazosport ISD African American 80% 70% 60% 59% 57% 98% 96.7% 95.6% 94.1% 93.2% Economically Disadvantaged Hispanic White All Students

50
Math - Aldine ISD 93–9494–9595–9696–9797–9898–9999–00 30% 40% 50% 60% 70% 80% 90% 100% African American Whit e 56.2% 49.4% 47.2% 42.2% 55.0% 93.5% 90.9% 89.1% 88.1% 84. 4% Economically Disadvantaged Hispanic All Students

51
What The Successes Have in Common A total systems framework Aligned processes Data-driven decisions Strong leadership A customer focus Implementation of PDSA

52
When school districts apply the principles and techniques of continuous improvement over time, positive and lasting changes in all parts of the system (including student learning) are dramatic.
 are dramatic.")
53
Why Quality and Continuous Improvement? Answer: Its Research Based! Answer: Its Research Based!

54
Next steps… Ensure that youve completed work on Define the System ( Flow Chart and Assess the Situation (In-Process Measures, Run Chart, Pareto Diagram) Once baseline data has been collected (in-process measure), identity Root Cause (Cause & Effect Diagram and Relations Diagram), ready for improvement theory Set and communicate direction!
 Once baseline data has been collected (in-process measure), identity Root Cause (Cause & Effect Diagram and Relations Diagram), ready for improvement theory Set and communicate direction!")
55
Team Time & Table Evaluation

Similar presentations