Download presentation
Presentation is loading. Please wait.

1
PDSA in the Classroom http://quality.cr.k12.ia.us/PDSA/ar_research_index.html

2
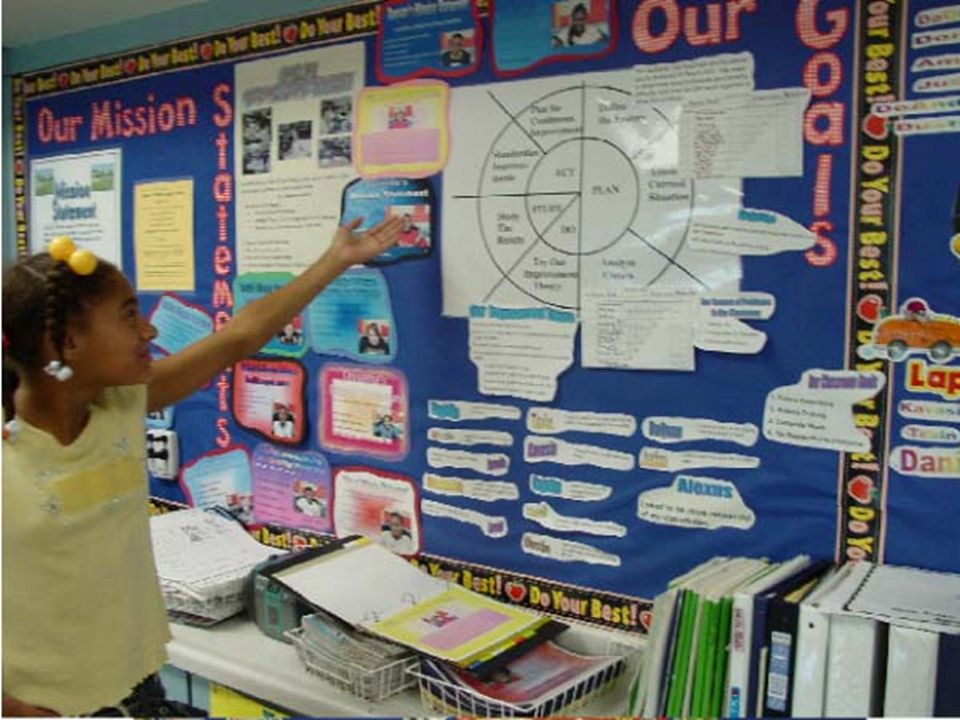
Ground rules created by students Classroom mission statements Classroom and student measurable goals Quality tools and PDSA used regularly The Continuous Improvement Classroom Classroom data centers Classroom meetings facilitated by students Student-led conferences Student data folders

3
PDSA; The Vehicle Professional Learning Communities Use To Implement Change

4
Crucial Questions What do we want each student to learn? What evidence do we have of the learning? How will we respond when some students dont learn?

5
Students Ask What do I need to know or do? Where am I now? How will I get there? What happens if I struggle?

6
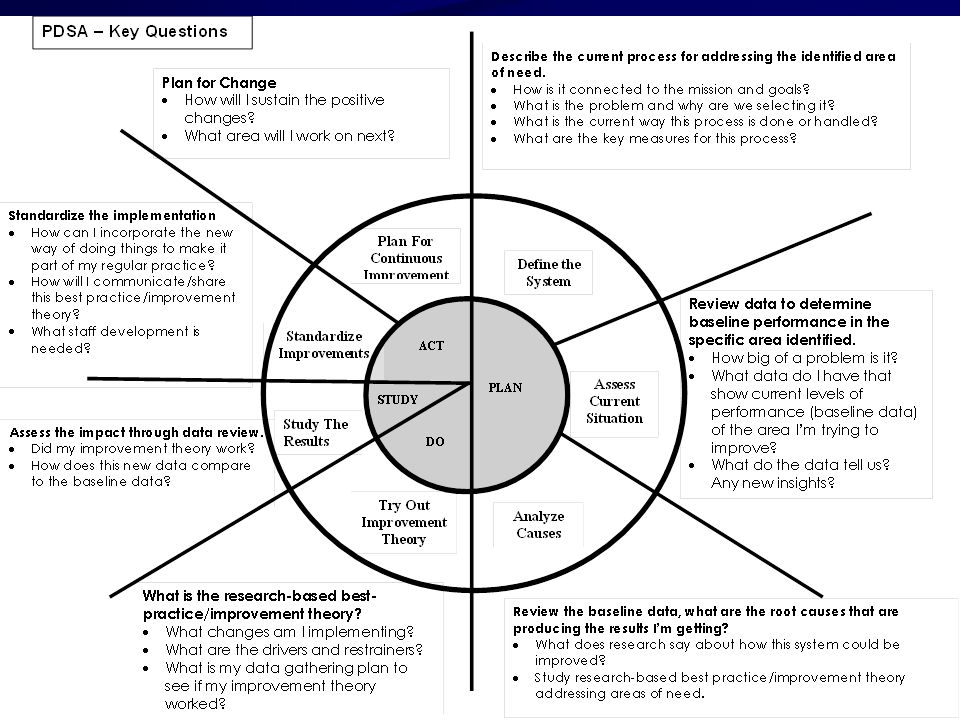
Pre Planning: Identification of Need 1. Develop/Review Student Learning Expectations 2. Examine alignment of learning expectations with assessments 3. Review assessment data 4. Identify areas of need based on assessment Plan: 1. Describe the current process for addressing the identified area of need (flow chart) 2. Review data to determine baseline performance in the specific area identified (Run Chart/Pareto Diagram) 3. Identify potential root causes contributing to the identified area of need (Cause & Effect Diagram, 5 Whys, Relations Diagram) 4. Study research-based best practice/improvement theory addressing areas of need DO 1. Plan for implementation of improvement theory (Force Field Analysis, Action Plan) 2. Implement research-based best practices improvement theory based on root causes according to the Action Plan 3. Monitor the implementation of research-based best practice/improvement theory to insure integrity and fidelity 4. Assess student learning Study: 1. Examine student assessment results (compare to baseline) 2. Assess the impact of research-based best practice/improvement theory on student achievement Act: 1. Standardize the implementation of research- based best practice (improvement theory) that improved student learning (revise the flow chart to reflect changes made to the system) 2. If improvement theory was unsuccessful continue the PDSA cycle (try another improvement theory based on the next identified root causes) Action Research Overview for Professional Learning Communities Identify areas of strength and weakness? What do we want students to know? What do they know? What have they learned? Most effective/best practice teaching and learning strategies? Have they learned it? What do we do if they dont? How do we respond if they dont? HOW do we know if they have learned it? What evidence do we have of the learning?
 2. Review data to determine baseline performance in the specific area identified (Run Chart/Pareto Diagram) 3. Identify potential root causes contributing to the identified area of need (Cause & Effect Diagram, 5 Whys, Relations Diagram) 4. Study research-based best practice/improvement theory addressing areas of need DO 1. Plan for implementation of improvement theory (Force Field Analysis, Action Plan) 2. Implement research-based best practices improvement theory based on root causes according to the Action Plan 3. Monitor the implementation of research-based best practice/improvement theory to insure integrity and fidelity 4. Assess student learning Study: 1. Examine student assessment results (compare to baseline) 2. Assess the impact of research-based best practice/improvement theory on student achievement Act: 1. Standardize the implementation of research- based best practice (improvement theory) that improved student learning (revise the flow chart to reflect changes made to the system) 2. If improvement theory was unsuccessful continue the PDSA cycle (try another improvement theory based on the next identified root causes) Action Research Overview for Professional Learning Communities Identify areas of strength and weakness. What do we want students to know. What do they know. What have they learned. Most effective/best practice teaching and learning strategies. Have they learned it. What do we do if they dont. How do we respond if they dont. HOW do we know if they have learned it. What evidence do we have of the learning .")
7
Long term (What do I need to Know) Long term (What do I need to Know) Short Term (How will I get there) Short Term (How will I get there) Build confidence Build confidence I can learn this! I can learn this! Track in classroom data center Track in classroom data center Students set & track goals in data folder Students set & track goals in data folder I can see my progress I can see my progress Set short term targets that step up to long term goal! Classroom SMART Goals

8
Scaffold skills Deconstruct into scaffolding Deconstruct into scaffolding What are the enabling skills? What are the enabling skills? Reading comprehension Reading comprehension Main ideaMain idea Cause & effectCause & effect SequencingSequencing

9
PDSA Cycle Review

12
So.. After reviewing vocabulary assessment data, teachers discuss options at a team meeting and use the PDSA process They define how they are currently teaching vocabulary (flowcharts) The team determines what other in-process measures they could use to see how students are doing in vocabulary and they collect data (run charts & pareto diagrams) to get baseline The team reviews the baseline data they collected and discuss root causes for the results they see (cause & effect diagrams & relations diagrams) Once root causes are identified, each member researches articles and best practices related to vocabulary instruction and submits the best to the group (improvement theory)
 The team determines what other in-process measures they could use to see how students are doing in vocabulary and they collect data (run charts & pareto diagrams) to get baseline The team reviews the baseline data they collected and discuss root causes for the results they see (cause & effect diagrams & relations diagrams) Once root causes are identified, each member researches articles and best practices related to vocabulary instruction and submits the best to the group (improvement theory).")
13
The team writes an action plan to carry out the improvement theory in their classrooms. Members practice newly-learned strategies (improvement theory), and measure the effectiveness of the strategies Members coach each other & may go into each others classroom to observe and provide feedback Members monitor student data to determine effectiveness of strategies (compare to baseline) Members reflect, observe, practice, receive feedback, gain expertise and standardize the new vocabulary instruction practice (new flowchart) Teams continue to use the PDSA cycle to make improvements in the realm of their professional learning community
, and measure the effectiveness of the strategies Members coach each other & may go into each others classroom to observe and provide feedback Members monitor student data to determine effectiveness of strategies (compare to baseline) Members reflect, observe, practice, receive feedback, gain expertise and standardize the new vocabulary instruction practice (new flowchart) Teams continue to use the PDSA cycle to make improvements in the realm of their professional learning community.")
14
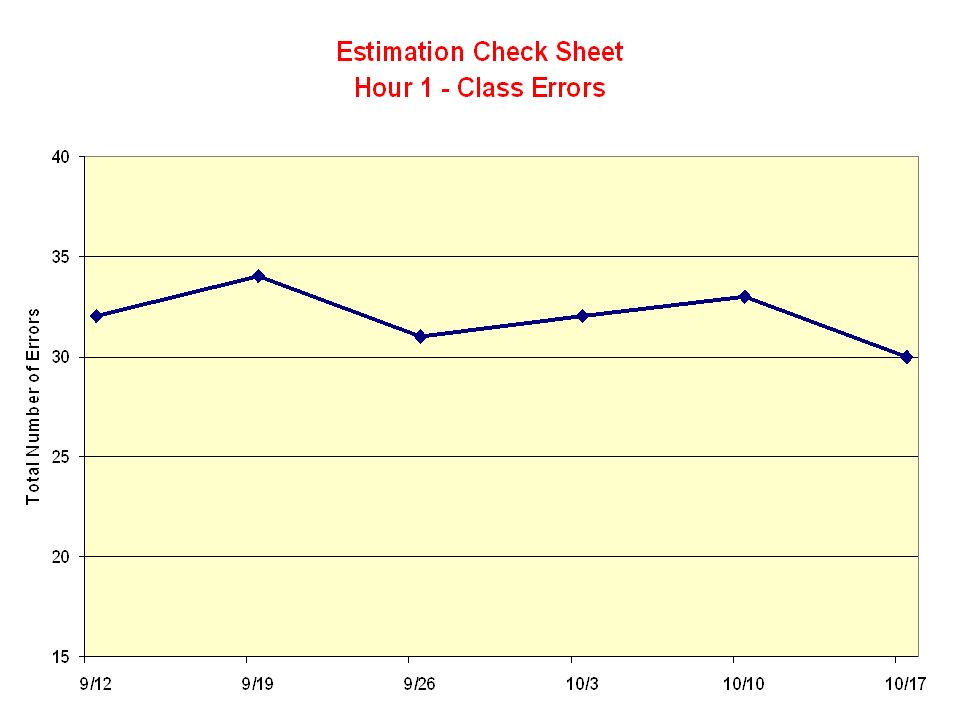
In-Process Measure Example

15
Estimation Check Sheet Weekly Class Errors Hour 1 - Mr. Albert Strategy123456 Total 1-6 Week12-Sep19-Sep29-Sep3-Oct10-Oct17-Oct Addition 2211006 Subtraction 22312111 Multiplication 78787744 Division 10111011121064 Application 11 101112 67 28 students Total Errors 323431323330192 Number of Students 28

18
What Do Your In-Process Measures Look Like? Give some examples of in process measures? How would you use them in… –The Data Center –Student Data Folders –PDSA Efforts?

20
Plan Define the System The Problem- Students arent waiting to be called on during instruction

21
Define the System Flow Chart I have an idea I raise my hand Did my teacher call my name? Blurting out anyway Share my idea out loud no yes

22
Plan Assess Current Situation Lets collect some data to see how our system is currently operating.

23
Assess the Situation Run Chart- baseline data

24
Plan Analyze Causes Lets figure out whats causing the problem

25
Analyze Causes Force Field Analysis Driving Forces We have good ideas Sometimes we remember Restraining Forces We get excited We have a lot to say We forget We dont like to wait

26
Plan Try Out Improvement Theory Do Lets try something different to improve the behavior

27
DO Try Out Improvement Theory IF we try hard to remember to raise our hands, and hang the run chart in a place we can all see to help us remember, THEN, we will remember to raise our hands before we speak instead of talking out.

28
Plan Study the Results Do Study Lets see how our theory worked. Did we make improvements?

29
Study the Results Run Chart- Data after trying out our theory

30
Plan Standardize Improvement Do Study Act Plan for Continuous Improvement If it worked, lets standardize our improvements.

31
Baseline Data (Before) After (Results)
 After (Results)")
32
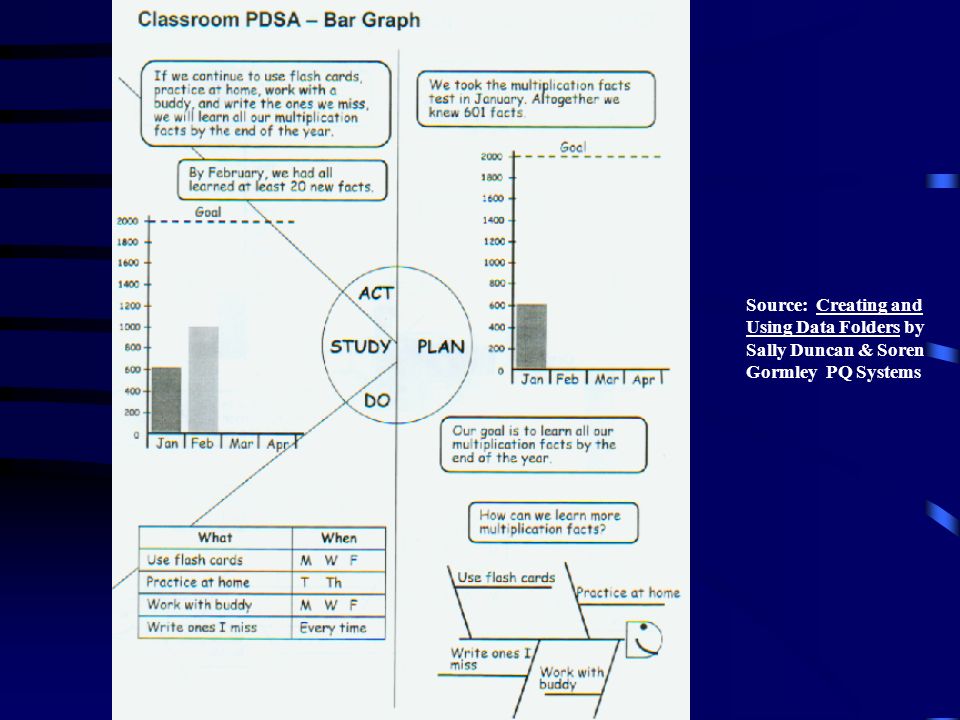
Classroom PDSA Examples

34
Source: Creating and Using Data Folders by Sally Duncan & Soren Gormley PQ Systems

38
Sharing How could you involve students in the PDSA process in your classroom? –What are the probletunities that students could help solve? –How could data folders and data centers help involve students in PDSA?

Similar presentations


 (Your School/Departments SMART Goals Here)>")


