Download presentation
Presentation is loading. Please wait.

1
Age and Aging In Minnesota Tom Gillaspy Minnesota Planning October, 2001

2
Some Findings From The 2000 Census Population increased 12.4% to 4.9 million Fastest growing state in the frost-belt Most growth in the suburban fringe past the 694/494 belt Minneapolis and St. Paul grew for the first time in half a century. About 2/5ths of statewide growth due to migration. Each year about 80,000 people move in and 60,000 move out.

3
During The 1990s Minneapolis (3.9%), St. Paul (5.5%) and Duluth (1.7%) increased in population, reversing trends of a half century of loss. Rochester (21.3% gain) is now the fourth largest city in Minnesota. Of the 15 largest cities, Eden Prairie (39.7%) was the fastest growing followed by Eagan (34.1%). Only Bloomington (- 1.3%) lost. Scott (54.7%) and Sherburne (53.6%) Counties were the fastest growing counties. During the 1990s, 25 counties lost population, down from 49 in the 1980s
 and Duluth (1.7%) increased in population, reversing trends of a half century of loss. Rochester (21.3% gain) is now the fourth largest city in Minnesota. Of the 15 largest cities, Eden Prairie (39.7%) was the fastest growing followed by Eagan (34.1%). Only Bloomington (- 1.3%) lost. Scott (54.7%) and Sherburne (53.6%) Counties were the fastest growing counties. During the 1990s, 25 counties lost population, down from 49 in the 1980s.")
5
Growth 1990 to 2000 In Selected Minnesota Race and Ethnic Groups 2000 Census, NH abbreviation for Not Hispanic

6
More Trends From The 90s Populations of color increased rapidly. Latino nearly tripled, Black and Asian nearly doubled. Race comparisons difficult due to change in definitions. Immigration4,000 to 9,000 per year. Median age increased from 32.4 to 35.4 over the decade. Middle-aged and college age increased most rapidly.

7
Minnesota Births 1910 to 1999 Births Deaths

8
Minnesota Total Fertility Rate Since 1940

9
Minnesota Life Expectancy At Age 65 And Age 85 Have Increased Steadily

10
Minnesota Death Rates Per 100,000 By Race Population as of 1991; deaths averaged over 1989 to 1993

11
NonMetropolitan Natural Increase 1990-98

12
Minnesota Change By Age Group 1990 to 2000 2000 Census

13
Minnesota Age-Sex Pyramid 2000 Female Male

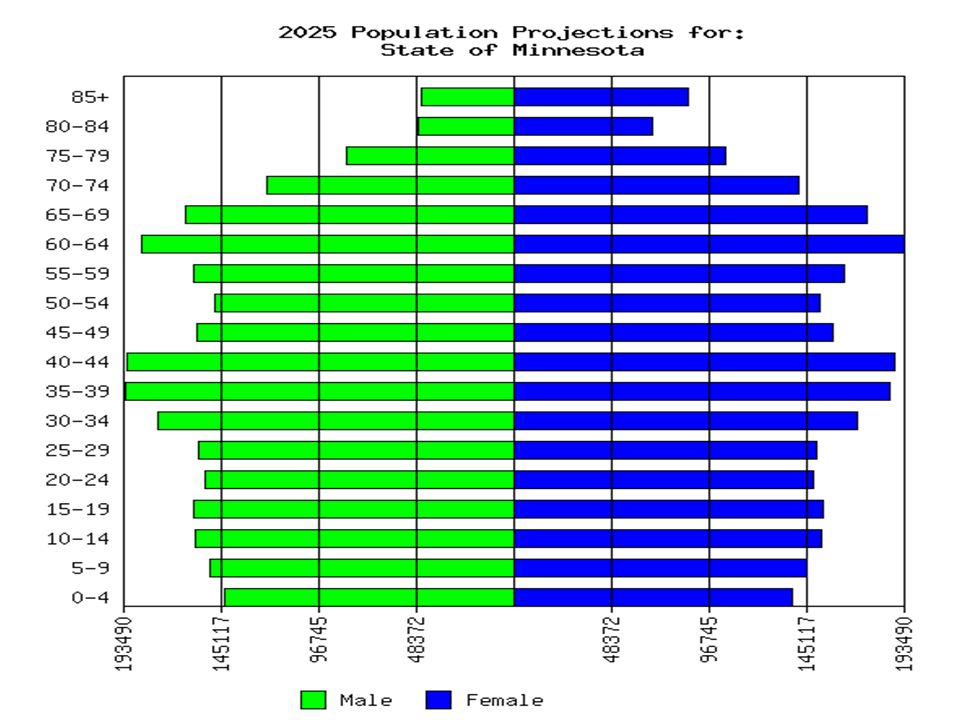
14
Minnesota's Population Is Aging: Projected Population 2000 to 2010

16
Minnesota Poverty Rate By Age 2000 Source: Census Bureau, C2SS survey

17
Percent Change 1990 to 2000 In Selected Minnesota Household Characteristics

18
Nearly Half of Households With Someone Age 65 And Older Are Single Person Households

19
Minnesota State Government Workforce Is Aging Rapidly

20
Median Age Of Minnesota State Workers Is 46 in 2000

21
Some Sources of Demographic Information State Demographer http://www.mnplan.state.mn.us/demography/ http://www.mnplan.state.mn.us/demography/ Helpline 651-296-2557 Metro Council http://www.metrocouncil.org/http://www.metrocouncil.org/ Census Bureau http://www.census.gov/http://www.census.gov/ Health profiles http://www.mnplan.state.mn.us/datanetweb/ http://www.mnplan.state.mn.us/datanetweb/

23
Some Results Expected From The 2000 Census Foreign born population doubled Substantial increases in limited English proficiency population, especially Spanish speaking Decrease in poverty across most age groups and household types Education attainment increased Houses larger Commutes increase in length

24
Natural Increase

Similar presentations