Download presentation
Presentation is loading. Please wait.

1
Education Minnesota Demographic Change And Education Tom Gillaspy Minnesota Planning October, 2001

2
Some Findings From The 2000 Census Population increased 12.4% to 4.9 million Fastest growing state in the frost-belt Most growth in the suburban fringe past the 694/494 belt Minneapolis and St. Paul grew for the first time in half a century. About 2/5ths of statewide growth due to migration. Each year about 80,000 people move in and 60,000 move out.

3
More Trends From The 90s Populations of color increased rapidly. Latino nearly tripled, Black and Asian nearly doubled. Race comparisons difficult due to change in definitions. Immigration4,000 to 9,000 per year. Median age increased from 32.4 to 35.4 over the decade. Middle-aged and college age increased most rapidly.

4
The Rate of Minnesota Population Change Increased in the 90s

6
The Growth Collar Grew rapidly In The 90s While Growth Was Modest Elsewhere

7
Minnesota Change By Age Group 1990 to 2000 2000 Census

8
Minnesota Sees Increases in Teens and Declines In Young Children

9
Children By Age In Minnesota 2000

10
Minnesota Public School Enrollment Projected To 2008 US Dept of Education

11
Percent Change 1990 to 2000 In Selected Minnesota Household Characteristics

12
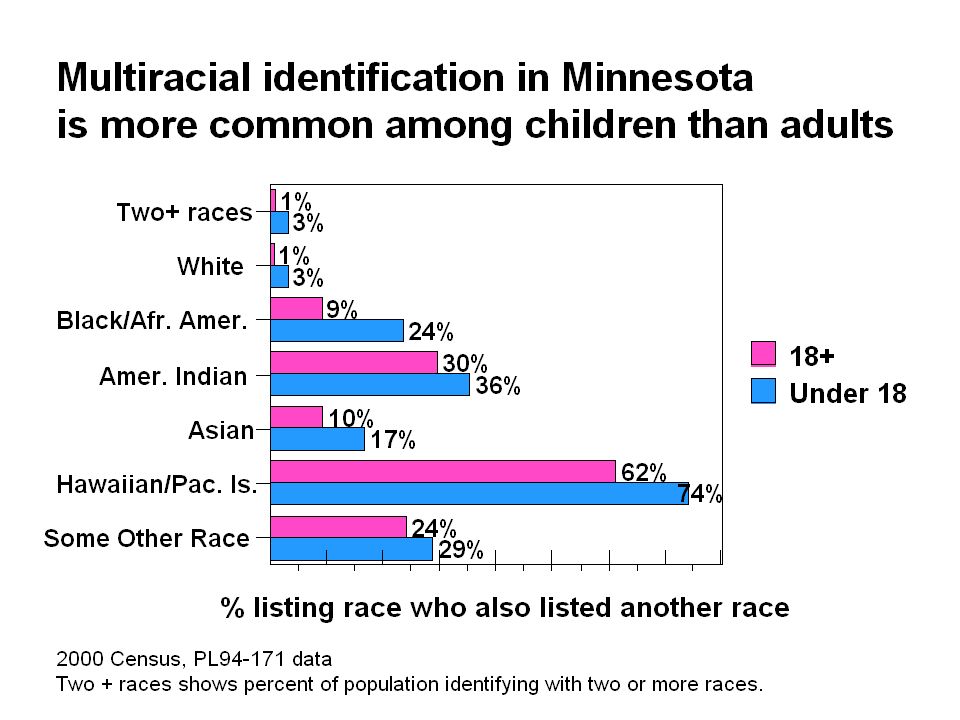
In The 2000 Census for Minnesota Percent minority increased from 6.3 percent in 1990 to 11.8 percent, compared with 30.9 percent for the nation 1.7 percent of the population selected more than one race 92 percent of people selecting only the Otherrace are Hispanic or Latino

13
Growth 1990 to 2000 In Selected Minnesota Race and Ethnic Groups 2000 Census, NH abbreviation for Not Hispanic

16
Minnesotas Asian Population Saw Rapid Growth In Most Groups

17
Minnesotas Latino Population Saw Large Gains In All Origins, Especially Mexican

18
Minnesotas Foreign Born Population Data for 2000 is C2SS high and low 5.8% of total population in 2000, up from 2.6% in 90 but was 28.9% in 1900

19
Minnesotas Foreign Born Population By Year of Entry To The US C2SS sample

20
Minnesotas Foreign born Population By Region of Birth C2SS sample

21
Non-English Speaking Students: While Minneapolis and St. Paul have the largest numbers, some smaller districts also have substantial proportions Mn Dept of Children Families & Learning

22
Many Languages Are Now Spoken In Minnesota Schools Students spoke 69 non-English languages at home statewide in 2000-2001. 50 different languages in Minneapolis 48 in both St. Paul and Anoka 17 in Willmar 14 in Worthington

23
Percent Distribution of Non-English Speakers 18-64 By Language C2SS data 8% to 11% of Minnesotas 18-64 speak a language other than English

24
Of Non English Speakers, Percent Who Speak English Not Well Or At All C2SS data

25
Some Sources of Demographic Information State Demographer http://www.mnplan.state.mn.us/demography/ http://www.mnplan.state.mn.us/demography/ Helpline 651-296-2557 Metro Council http://www.metrocouncil.org/http://www.metrocouncil.org/ Census Bureau http://www.census.gov/http://www.census.gov/ Hennepin County http://www.co.hennepin.mn.us/opd/opd.htm

Similar presentations