Download presentation
Presentation is loading. Please wait.

1
Population Change in Texas: Implications for Human and Socioeconomic Resources in the 21st Century
by Steve H. Murdock Institute for Demographic and Socioeconomic Research The University of Texas at San Antonio

2
Major Demographic Trends Affecting the Future
Change in Rates and Sources of Population Growth Increase in the Non-Anglo Population Aging of the Population

3
Total Population Change

4
Total Population and Percent Population Change in Texas and the United States, 1850-2005

5
Total Population and Components of Population Change in Texas, 1950-2005

6
Ten Fastest Growing States in Numerical Terms in the United States, 1990-2000

7
Ten Fastest Growing States in Numerical Terms in the United States, 2000-2005

8
Ten Fastest Growing States in Percentage Terms in the United States, 1990-2000

9
Ten Fastest Growing States in Percentage Terms in the United States, 2000-2005

10
Ten Largest States in United States by Population Size in 2000 Ranked by Population Size in 2000

11
Ten Largest States in United States by Population Size in 2000 Ranked by Population Size in 2005

12
Numerical Population Change by Components of Change in the United States and Selected States, and

13
Percent of Population Change by Components of Change in the United States and Selected States, and

16
Population Change in Texas Counties, 1990-2000
Source: Texas State Data Center

17
Population Change in Texas Counties, 2000-2003
Source: Texas State Data Center

18
Population Change in Texas Counties, 2000-2004
Source: U.S. Bureau of the Census, 2004 County Estimates

19
Racial/Ethnic Change in Texas

20
Texas Rank Among States on Selected Characteristics of Race/Ethnicity Groups

21
Texas Rank Among States on Selected Characteristics of Race/Ethnicity Groups

22
Anglo Population For States in the United States in 1990 and 2000 Ranked by Total Population Size in 2000

23
Texas Rank Among States on Selected Characteristics of Race/Ethnicity Groups

24
Numerical Change in Population by Race/Ethnicity in Texas for 1980-1990 and 1990-2000

25
Percent Change in Population by Race/Ethnicity for 1980-1990 and 1990-2000 in Texas

26
Proportion of Net Population Change Attributable to Each Race/Ethnicity Group in Texas for and

27
Population Change by Race/Ethnicity in Texas, 2000‑2004

28
Major Changes in Population Composition (Characteristics)
Age

29
Median Age in the United States and Texas, 1900-2000

30
Percent Change in Population by Age Group in the United States and Texas, 1990-2000

31
Percent of Texas Population by Age Group and Ethnicity, 2000

32
Percent of Texas Population by Age Group and Ethnicity, 2040*

33
PROJECTIONS

34
Population in Texas by Race/Ethnicity in 2000 and Projections of the Population in Texas by Race/Ethnicity from 2010 to 2040

35
Percent Change for Selected Time Periods for Projected Population in Texas by Racial/Ethnic Status Under Alternative Assumptions of Migration Scenarios

36
Percent of Population in Texas by Race/Ethnicity in 2000 and Projections of the Percent of the Population in Texas by Race/Ethnicity from 2010 to 2040

37
Projected Proportion of Population by Race/Ethnicity in Texas, 2000-2040*

38
Percent of the Projections of the Population by Race/Ethnicity and Age Groups in Texas from Under Alternative Migration Scenarios

39
Projected Percent of Net Change Attributable to Each Race/Ethnicity Group for 2000-2040*

40
Percent Change from 2000 to 2040 in Selected Age Groups in the Texas Population Under the 1.0 Scenario

41
POPULATION CHARACTERISTICS AND SOCIOECONOMIC CONDITIONS

42
Median Household Income in 1999 in Texas by Age of Householder
Thousands

43
Median Household Income In 1999 in Texas by Race/Ethnicity of Householder

44
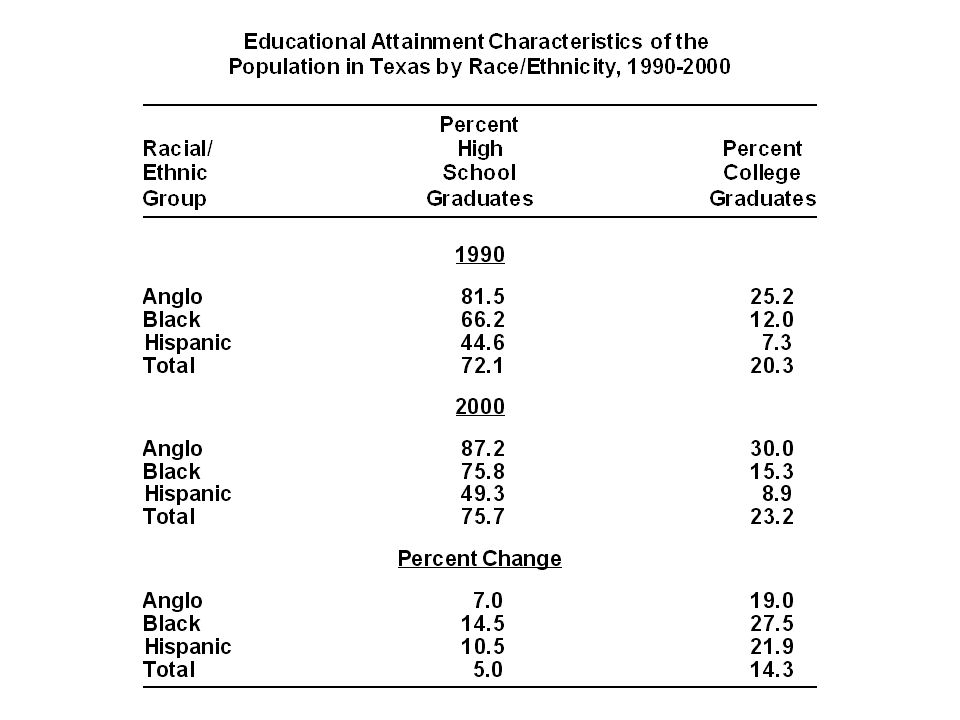
Educational Attainment in 2000 in Texas for Persons 25+ Years of Age By Race/Ethnicity
Percent

45
States Ranked by Median Household Income in 1999

46
States Ranked by Per Capita Income in 1999

47
States Ranked by Percent High School Graduates + in the Population 25 Years of Age or Older, 2000

48
States Ranked by Percent High School Graduates + in the Population 25 Years of Age or Older, 2004
Source: U.S. Census Bureau. Current Population Survey (CPS), 2004 Annual Social and Economic Supplement
, 2004 Annual Social and Economic Supplement.")
49
States Ranked by Percent College Graduates + in the Population 25 Years of Age or Older, 2000

50
States Ranked by Percent College Graduates + in the Population 25 Years of Age or Older, 2004
Source: U.S. Census Bureau. Current Population Survey (CPS), 2004 Annual Social and Economic Supplement
, 2004 Annual Social and Economic Supplement.")
51
The Texas Challenge in the Twenty-First Century: Implications of Population Change for the Future of Texas by Steve H. Murdock The Institute for Demographic and Socioeconomic Research The University of Texas at San Antonio The Institute for Demographic and Socioeconomic Research

52
EDUCATION

54
Public Community College and University Enrollment Rates (Per 100 Persons Ages 18 to 35) in Texas by Race/Ethnicity, 1990 and 2000

55
Enrollment in Public Elementary and Secondary Schools in Texas for all Scenarios, 2000-2040
Bev Table 7.2

56
Enrollment in Public Community Colleges and Public Universities in Texas, 2000-2040*
Bev Table 7.4

57
Projected Percent of Public Elementary and Secondary Enrollment by Race/Ethnicity in 2000 and Projections for 2040* Bev tab a

58
Projected Percent of Public Community College Enrollment by Race/Ethnicity in 2000 and Projections for 2040* Bev tab b

59
Projected Percent of Public University Enrollment by Race/Ethnicity in 2000 and Projections for 2040* Bev tab

60
Future Demands for Specific Programs

61
Percent Change in Public Community College Enrollment, Public University Enrollment, Students with Financial Need Unmet by Household Resources, and State Financial Assistance Expenditures for Public Higher Education in Texas, *

62
Ethnic Diversity of the Population, Householders, and Labor Force in Texas, 2000 and 2040*
Proj_pop-hhdr-lf_6pie.pr4

63
Ethnic Diversity of the Population Enrolled in Elementary and Secondary Schools and Colleges in Texas, 2000 and 2040* Proj_Ed-Enrol_4pie.pr4

64
Ethnic Diversity of Household Income and Consumer Expenditures in Texas, 2000 and 2040*
Proj_Inc-Exp_4pie.pr4

65
State Tax Revenues in Texas Proportioned by Race/Ethnicity in 2000 and Projections to 2040* Assuming 2000 Decile Tax Rates *Projections are shown for the 1.0 scenario

66
Projected Percent of Labor Force by Educational Attainment in Texas, 2000 and 2040

67
Average Household Income in Texas, 2000-2040* (in 2000 Dollars)
")
68
Projected Percent of Households in Poverty by Family Type in Texas, 2000 and 2040

69
Average Annual Household Income in Texas and the United States by Educational Attainment of Householder in 2000*

70
Percent of Persons 25 Years of Age or Older by Level of Educational Attainment and Race/Ethnicity in 2000 and Projected to 2040* Assuming Trends in Educational Attainment Rates

71
Aggregate Income and Consumer Expenditures for Population 25 Years of Age or Older in Texas in 2000 and Projected Under Alternative Educational Attainment Assumptions for 2040*

72
State Tax Revenues in Texas for 2000 and Projected for (in 2000 Dollars) Assuming 2000 Rates, Rates of Closure Between Anglo-Black and Anglo-Hispanic Household Incomes, and Anglo Income Levels for All Race/Ethnicity Groups* Bev Table 4.11 & 4.10

73
Prison Population and Prison Costs for Population 25 Years of Age or Older in Texas in 2000 and Projected Under Alternative Educational Attainment Assumptions for 2040*

74
The mark of a truly educated man is to be moved deeply by statistics.
George Bernard Shaw

75
Texas State Data Center
Steve Murdock Texas State Data Center Phone – Fax – Website txsdc.utsa.edu

Similar presentations


 Demographic Highlights TEXAS is: big. The population.>")


