Download presentation
Presentation is loading. Please wait.

1
Use of nutritional bio- measures in national dietary surveys Gillian Swan Food Composition and Diet Team Nutrition Branch

2
Overview Why use bio-measures in national nutrition surveys What information do they give us Challenges Examples of how bio-measures data are used in policy

3
Healthy Lives, Healthy People: strategy for public health in England Recognises: Public health context. i.e: that life style (smoking, drinking, poor diet and low levels of physical activity) is a major contributor poor health and premature death and to equalities in health diet and obesity related disease is common major cost saving gained if diets improved and weight gain stopped the need to improve diet and lose weight
 is a major contributor poor health and premature death and to equalities in health diet and obesity related disease is common major cost saving gained if diets improved and weight gain stopped the need to improve diet and lose weight.")
4
NDNS Rolling Programme Continuous cross-sectional survey of the general population 1000 people per year (adults and children 1½ years upwards) Designed to be representative of the UK population Data collected on individuals Food consumption, nutrient intakes, nutritional status and other measurements
 Designed to be representative of the UK population Data collected on individuals Food consumption, nutrient intakes, nutritional status and other measurements")
5
NDNS Components Face to face interview Dietary assessment (4 day un-weighed diary) Physical measurements Blood sample (nutritional status analyses) 24 hour urine collection (sodium intake) Doubly labelled water (energy expenditure)
 Physical measurements Blood sample (nutritional status analyses) 24 hour urine collection (sodium intake) Doubly labelled water (energy expenditure)")
6
Why isn’t dietary assessment enough? Diet can only be assessed over a short period -doesn’t give longer term picture Diet assessment subject to self-reporting errors Some nutrients difficult to measure in the diet –for example sodium (salt) Vitamin D – diet not the only source
 Vitamin D – diet not the only source.")
7
What do bio-measures in NDNS tell us? Objective indicator unaffected by reporting bias Measures of dietary intake –24-hour urine sample Measures of nutritional status –Blood sample Energy expenditure –Doubly labelled water

8
Bio-measures in NDNS – blood samples Nutritional status of population –level of nutrients available to body for metabolic processes –Measure level of nutrient in the blood or activity of vitamin-dependent enzymes –Reflect recent intake (plasma vitamin C) or longer term body stores (plasma retinol; serum ferritin) –Threshold levels set to indicate low status risk of deficiency –Affected by factors other than diet Iron (controls on absorption, blood loss) Vitamin D (sunlight exposure)
 or longer term body stores (plasma retinol; serum ferritin) –Threshold levels set to indicate low status risk of deficiency –Affected by factors other than diet Iron (controls on absorption, blood loss) Vitamin D (sunlight exposure)")
9
Bio-measures in NDNS – blood samples Results don’t correlate well with diet –may not reflect short term intake –Blood samples collected several weeks after diet Logistical issues in collecting –Fasting samples –Need for rapid processing for some micronutrients Poor response rates, especially for children Importance of comparability over time – difficult when methods / laboratories change

10
Bio-measures in NDNS – urine samples Sodium excretion in urine samples is best way of measuring of sodium intake Sodium level in urine fluctuates during day – need 24-hour collection Single collection sufficient to give population estimate Need to assess completeness of sample –Para-amino benzoic acid (PABA) marker –Ask participant if collections are complete
 marker –Ask participant if collections are complete")
11
Bio-measures in NDNS – doubly labelled water Measures energy expenditure –Give a known dose of stable isotope as a drink –Collect urine samples over 10 days –Measure rate of disappearance of stable isotopes 2 H and 18 O from urine –Calculate CO2 production – energy expenditure Compared with reported energy intake – assess under-reporting Isotope expensive / limited supply Complex analysis

12
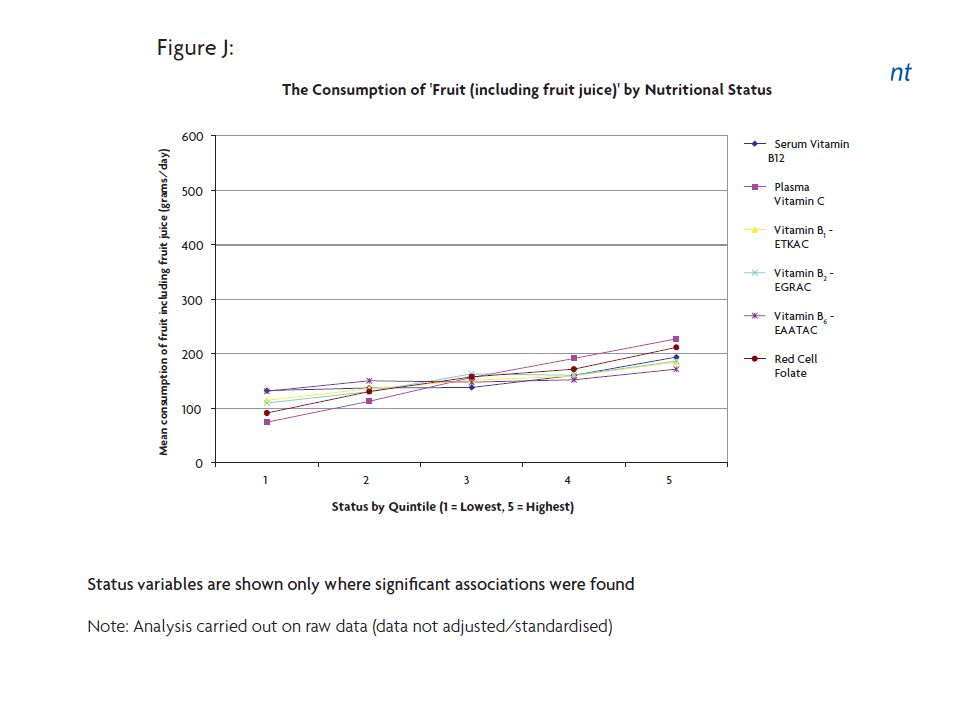
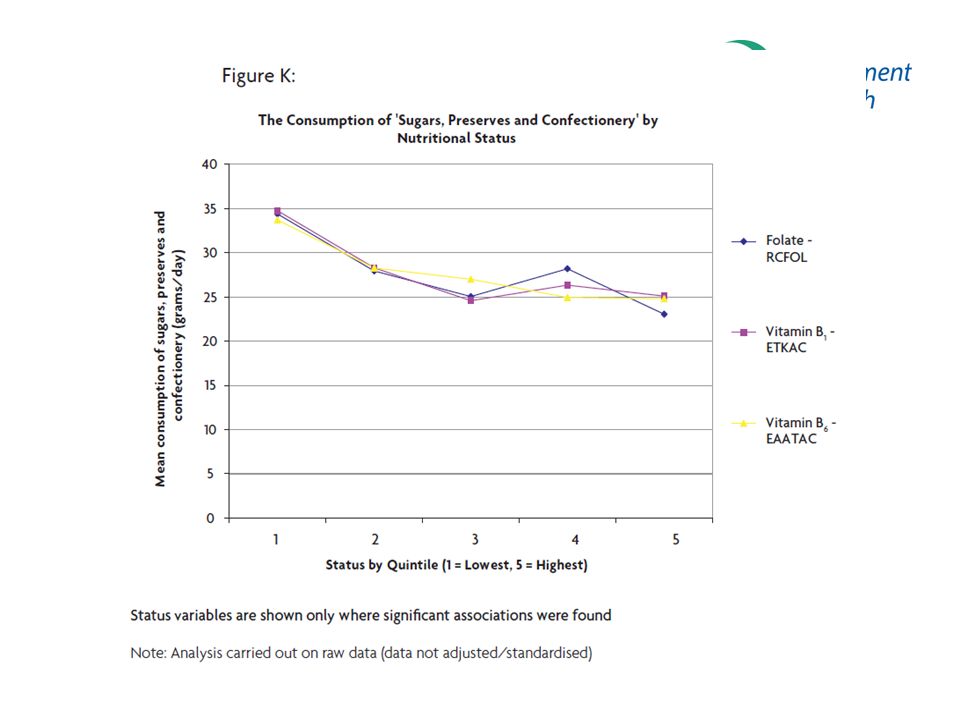
NDNS 2008/09-2009/10 Findings on nutritional status Evidence of iron deficiency anaemia in a proportion of adult women and older girls Evidence of low vitamin D status in adults and older children Low functional riboflavin status in substantial proportion of adults and older children No evidence of low status for other micronutrients – including vitamin C, A, E, thiamin, B6, B12

13
How bio-measures data are used in policy Scientific Advisory Committee on Nutrition (SACN) use bio-measures from NDNS and other sources in nutrient risk assessments Monitor progress towards recommendations (e.g. salt) Secondary analysis to look at diets of individuals with poor status
 Secondary analysis to look at diets of individuals with poor status.")
14
www.sacn.gov.uk
15
Salt (1) High salt intake contributes to high blood pressure – risk factor for cardiovascular disease NDNS 2000/01 showed adult salt intake 9.5g/day SACN (2003) recommended salt intake should reduce to a maximum of 6g/day Nationwide salt reduction initiative launched by Government in 2003 –Targets for industry to reduce salt in processed food –Consumer-facing campaigns
 High salt intake contributes to high blood pressure – risk factor for cardiovascular disease NDNS 2000/01 showed adult salt intake 9.5g/day SACN (2003) recommended salt intake should reduce to a maximum of 6g/day Nationwide salt reduction initiative launched by Government in 2003 –Targets for industry to reduce salt in processed food –Consumer-facing campaigns")
16
Salt (2) Salt reduction programme now part of Public Health Responsibility Deal Series of urinary sodium surveys to monitor progress towards 6g/day recommendation Latest survey published 21 June –Salt intake for adults in England 8.1g/day
 Salt reduction programme now part of Public Health Responsibility Deal Series of urinary sodium surveys to monitor progress towards 6g/day recommendation Latest survey published 21 June –Salt intake for adults in England 8.1g/day")
18
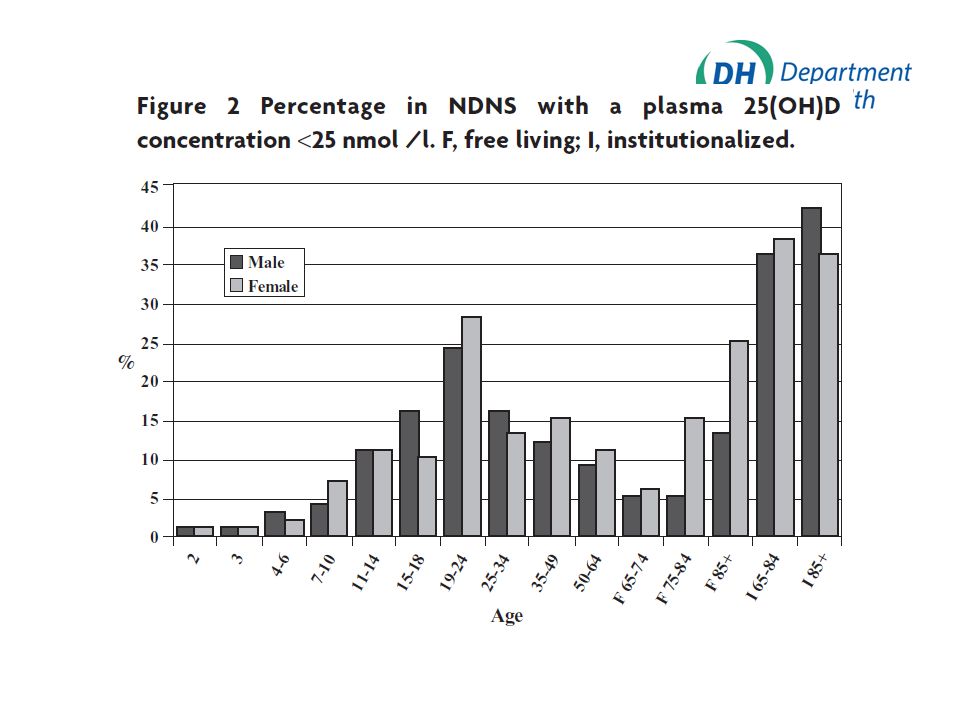
Current vitamin D recommendations are: Based on maintaining plasma 25 (OH) D above 25nmol/l This is above the level associated with risk of rickets and osteomalacia Takes into account UVB production of vitamin D in the skin in the summer.
 D above 25nmol/l This is above the level associated with risk of rickets and osteomalacia Takes into account UVB production of vitamin D in the skin in the summer.")
19
Vitamin D NDNS shows significant proportion of population below 25nmol/l plasma 25(OH)D. SACN reviewing vitamin D requirements SACN (2007) concluded there was an urgent need to standardise laboratory measurement of plasma 25(OH)D –International vitamin D standardisation project underway
 concluded there was an urgent need to standardise laboratory measurement of plasma 25(OH)D –International vitamin D standardisation project underway.")
25
Conclusions Nutritional bio-measures in national surveys provide valuable information on nutritional well- being of population Complement information on diet – not a substitute for it Objective measures – not subject to participant self-reporting error

26
Challenges Lack of comparability of analytical data over time or between laboratories –Folate, vitamin D –Need international laboratory standardisation Establishing threshold levels for low status and understanding health implications No bio-markers for many nutrients Response and compliance in national surveys –Agreement to collect blood samples –Completeness of urine collections

Similar presentations

 rolling programme>")

 587-3660 HUMAN NUTRITION Les Jones, PA-C, R.D. jones-girls@msn.com (406) 587-3660.>")


.>")


 Dr. Fiona Gillan GP Registrar at Church End Medical Centre.>")


