Download presentation
Presentation is loading. Please wait.

1
OLSON, M.L., ET AL Vitamin D Deficiency in Obese Children an Its Relationship to Glucose Homeostasis J CLIN ENDOCRINOL METAB, 97, 279-285, 2012

2
Researchers 5.967 Impact Factor Internal Medicine Pediatric Endocrinology

3
Background Obesity has tripled in U.S. children since 1980 19% of 6-19yr olds are obese The rise in obesity has paralleled increases in childhood hypertension, hyperlipidemia, and Type 2 Diabetes. Childhood obesity is associated with increase prevalence of cardiovascular events and Type 2 Diabetes in adulthood.

4
Supporting Evidence Hypovitaminosis D in obese children and adolescents: relationship with adiposity, insulin sensitivity, ethnicity, and season Metabolism 57:183-91 Prevalence of vitamin D insufficiency in obese children and adolescents J Clin Endocrinol Metab 92:2017-29

5
Objectives The aim of this study was to examine the relationship between dietary habits and 25(OH)D status in obese children. Examine the relationship between 25(OH)D and glucose homeostasis. Cross-sectional observational study
D and glucose homeostasis. Cross-sectional observational study.")
6
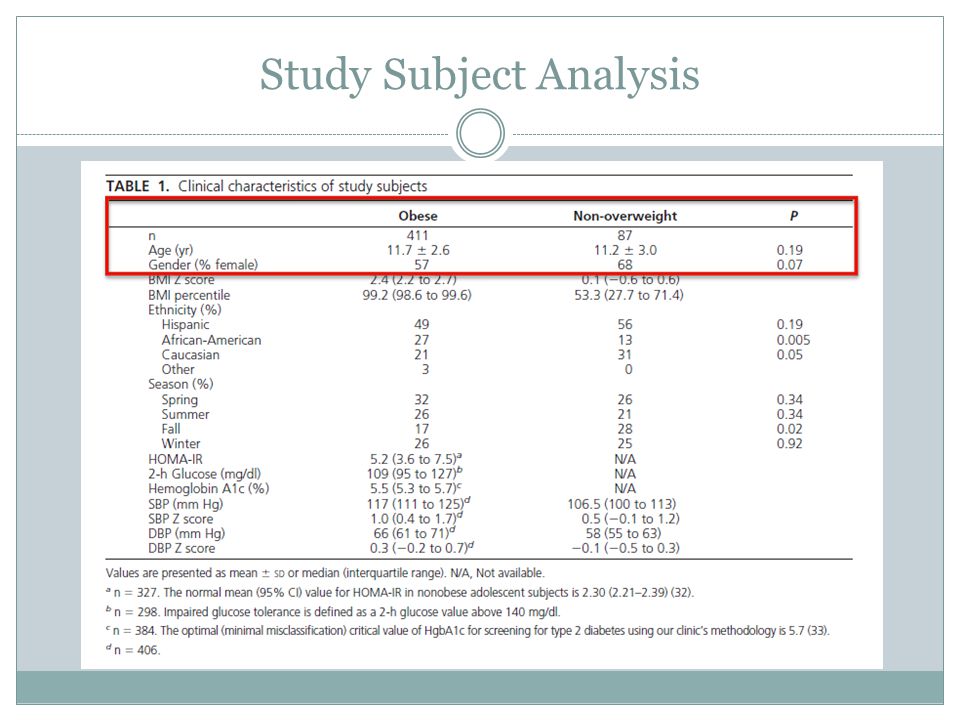
Selection of Subjects 411 obese children (BMI >95 th percentile for age group) ages 6-16 Recruited from Center of Obesity and its Consequences on Health in Dallas, Texas 89 non overweight children Recruited from Endocrinology Center after being treated for hypothyroidism or GH deficiency, but otherwise healthy Exclusion criteria: use of anticonvulsant, vitamin D supplement more than 400 IU/day, other relevant disorders
 ages 6-16 Recruited from Center of Obesity and its Consequences on Health in Dallas, Texas 89 non overweight children Recruited from Endocrinology Center after being treated for hypothyroidism or GH deficiency, but otherwise healthy Exclusion criteria: use of anticonvulsant, vitamin D supplement more than 400 IU/day, other relevant disorders")
7
Calculating Pediatric BMI

8
Data collected Age, sex, ethnicity, height, weight, blood pressure, dietary habits Laboratory data Serum 25(OH)D HbgA1C Fasting glucose and insulin OGTT HOMA-IR
D HbgA1C Fasting glucose and insulin OGTT HOMA-IR")
9
Statistical Analysis Prevalence of Vit D insufficiency determined for obese and non-overweight populations within each ethnic group and season Data collected in summer, fall, winter, spring Sufficiency: 75 nmol/L Insufficiency: < 75 nmol/L Deficiency: < 50 nmol/L χ squared to determine prevalence rate

10
Statistical Analysis cont. Two way ANOVA to compare 25(OH)D between groups and assess interaction btw obesity and season; gender and ethnicity Pearson coefficients used to determine relationship btw 25(OH)D and: 2h glucose HbbA1c HOMA-IR Blood pressure
D between groups and assess interaction btw obesity and season; gender and ethnicity Pearson coefficients used to determine relationship btw 25(OH)D and: 2h glucose HbbA1c HOMA-IR Blood pressure.")
11
Study Subject Analysis

14
Results

15
Vitamin D deficiency + inadequacy

16
Results

18
Discussion

19
Study Objective To compare prevalence of vitamin D deficiency in obese versus non-overweight children. Examine relationships between: Dietary habits and serum 25(OH)D levels Abnormal glucose metabolism and obesity in children Cross-sectional observational study- no intervention was implemented
D levels Abnormal glucose metabolism and obesity in children Cross-sectional observational study- no intervention was implemented.")
20
Subjects 411 obese and 89 non-overweight children (aged 6-16 years) residing in North Texas Grouping based on BMI percentile-for-age: Obese= >95 th percentile, non= <85 th percentile Adequate sample size, but could have included more non-overweight to better compare Convenience sample of non-overweight subjects from Endocrinology Center for Hyperthyroidism No known relationship between thyroid and vitamin D status Same exclusion criteria for both groups Meds: anticonvulsant, glucocorticoid, and/or vitamin D supplement Health Status: Hepatic dz, renal dz, malabsorptive disorder, bone metabolism disorder, hypothalamic dz, genetic predisposition to obesity
 residing in North Texas Grouping based on BMI percentile-for-age: Obese= >95 th percentile, non= <85 th percentile Adequate sample size, but could have included more non-overweight to better compare Convenience sample of non-overweight subjects from Endocrinology Center for Hyperthyroidism No known relationship between thyroid and vitamin D status Same exclusion criteria for both groups Meds: anticonvulsant, glucocorticoid, and/or vitamin D supplement Health Status: Hepatic dz, renal dz, malabsorptive disorder, bone metabolism disorder, hypothalamic dz, genetic predisposition to obesity")
21
Accounted for multiple subject characteristics Age BMI Gender Ethnicity Season Dietary practices

22
Test Procedures Used common, standard procedures determined to be reliable and valid: Serum 25(OH)D Diabetes Risk Factors (validated by Amer Diabetes Assoc) OGTT Fasting plasma glucose and insulin HgbA1C HOMA-IR (insulin resistance and beta-cell function) All measurements taken in same way in both groups Result evaluation based to gender, race, and season in both groups
D Diabetes Risk Factors (validated by Amer Diabetes Assoc) OGTT Fasting plasma glucose and insulin HgbA1C HOMA-IR (insulin resistance and beta-cell function) All measurements taken in same way in both groups Result evaluation based to gender, race, and season in both groups")
23
Study Design- valid Used standardized, accurate measures of glucose metabolism and vitamin D status Included variety of subjects: different genders, races, ages Matched non-overweight subjects to obese based on age, race, and season more accurate comparison

24
Author’s Conclusions Study results show a negative relationship between vitamin D status and BMI in children Glucose metabolism is related to vitamin D status Limitation: unable to account for physical activity or sun-light exposure Could aid in better understanding differences in vitamin D status between the 2 groups

25
Relevant Outcomes Obese had less seasonal variation in vitamin D status (p<0.03) Breakfast skipping and high soda intakes were associated with lower vitamin D status (p<0.001) When adjusted for age and BMI, vitamin D status negatively correlated with HOMA-IR and OGTT (p=0.001 and p=0.04) Lower vitamin D status is associated with T2D risk factors in obese children
 Breakfast skipping and high soda intakes were associated with lower vitamin D status (p<0.001) When adjusted for age and BMI, vitamin D status negatively correlated with HOMA-IR and OGTT (p=0.001 and p=0.04) Lower vitamin D status is associated with T2D risk factors in obese children")
26
Implications for Practice Nutrition Professionals: Raise awareness of dietary factors negatively affecting vitamin D status in children (breakfast skipping, soda consumption) Highlight need for early dietary interventions Clinical Professionals: Suggests need for further study of vitamin D supplementation as a potential treatment for conditions such as insulin resistance
 Highlight need for early dietary interventions Clinical Professionals: Suggests need for further study of vitamin D supplementation as a potential treatment for conditions such as insulin resistance")
Similar presentations


 is a measure used to determine childhood overweight.>")


 To compare variation in adiponectin.>")


