Download presentation
Presentation is loading. Please wait.

1
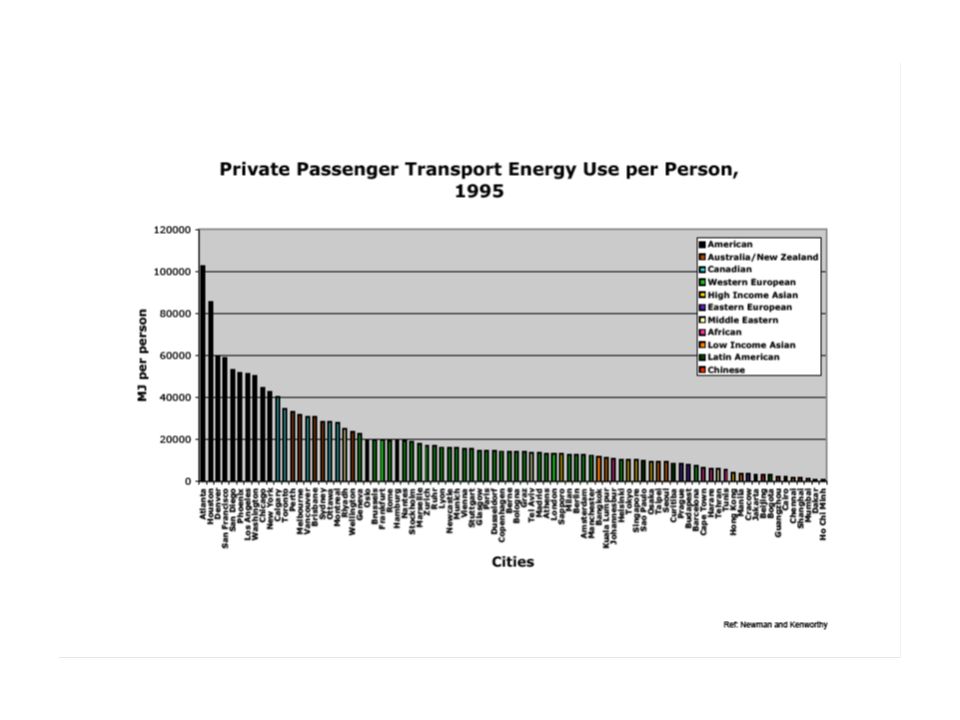
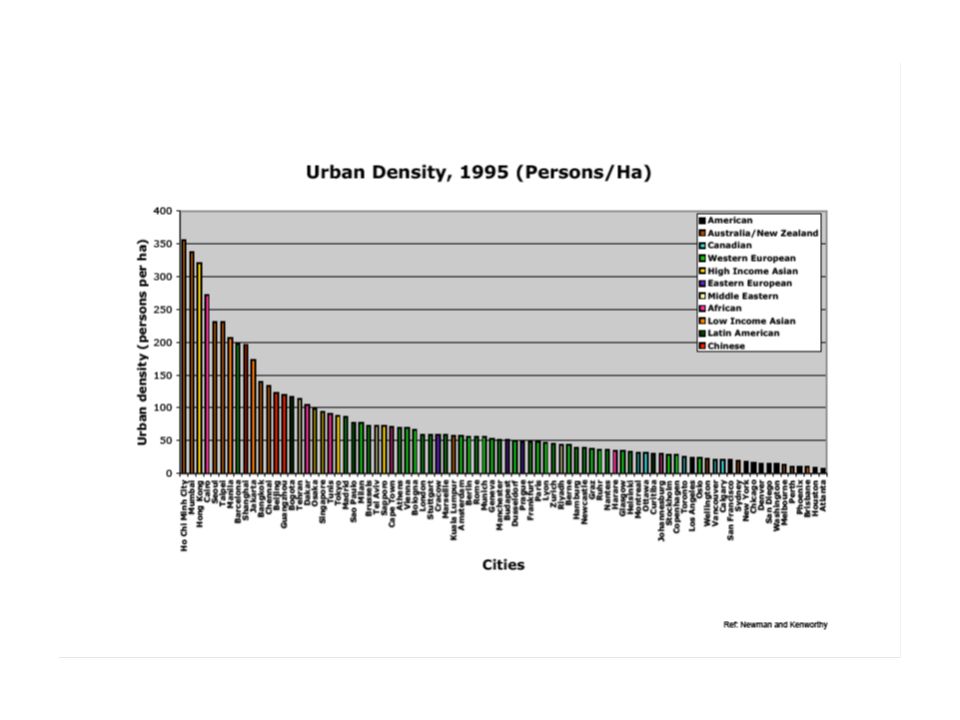
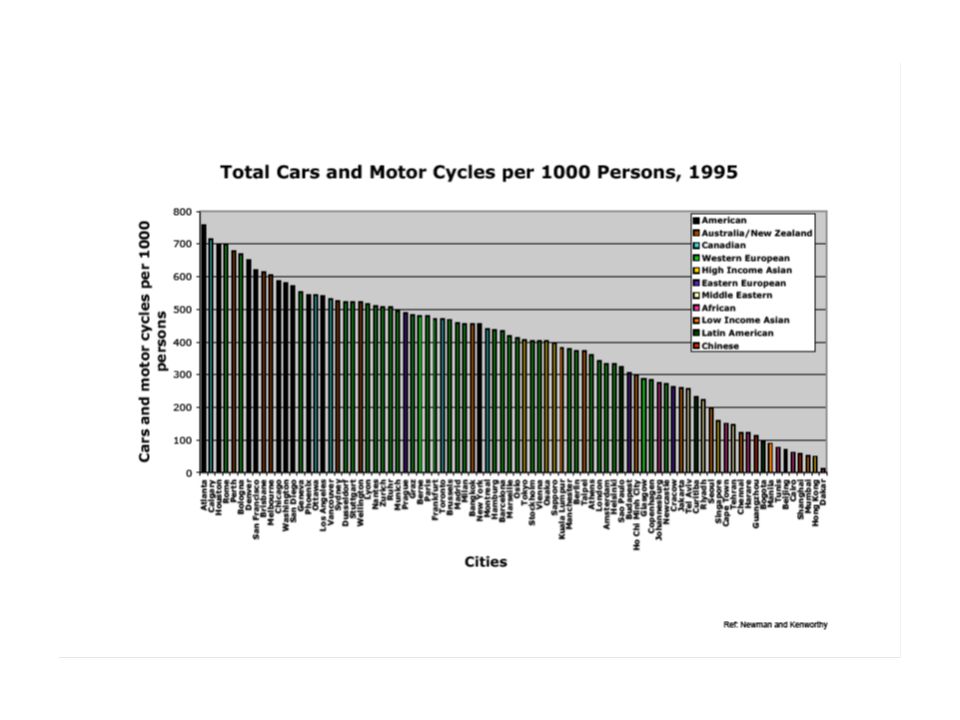
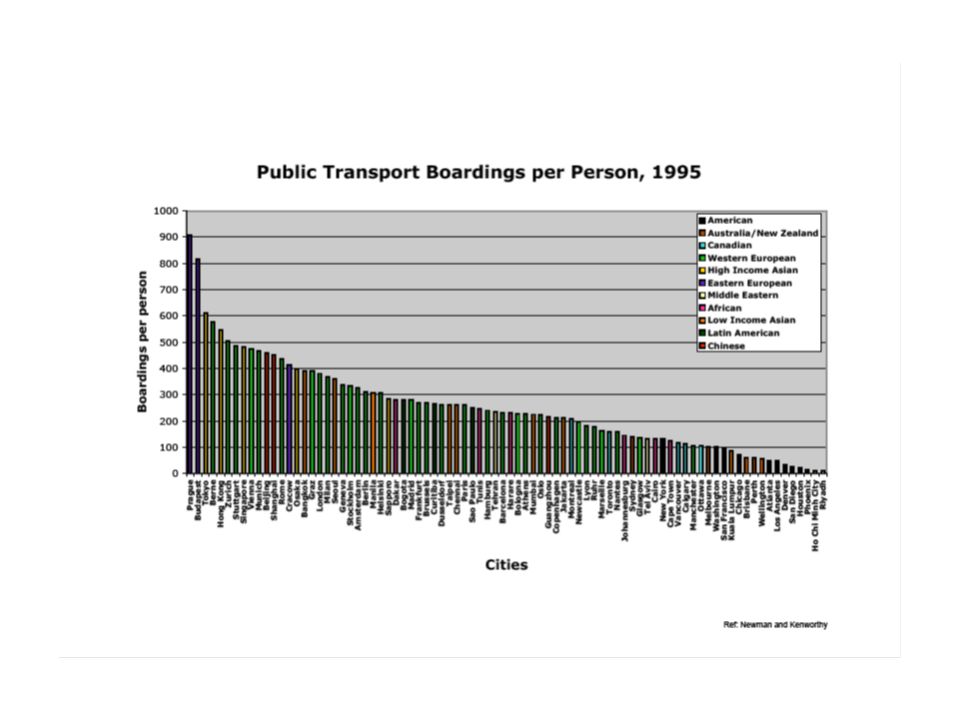
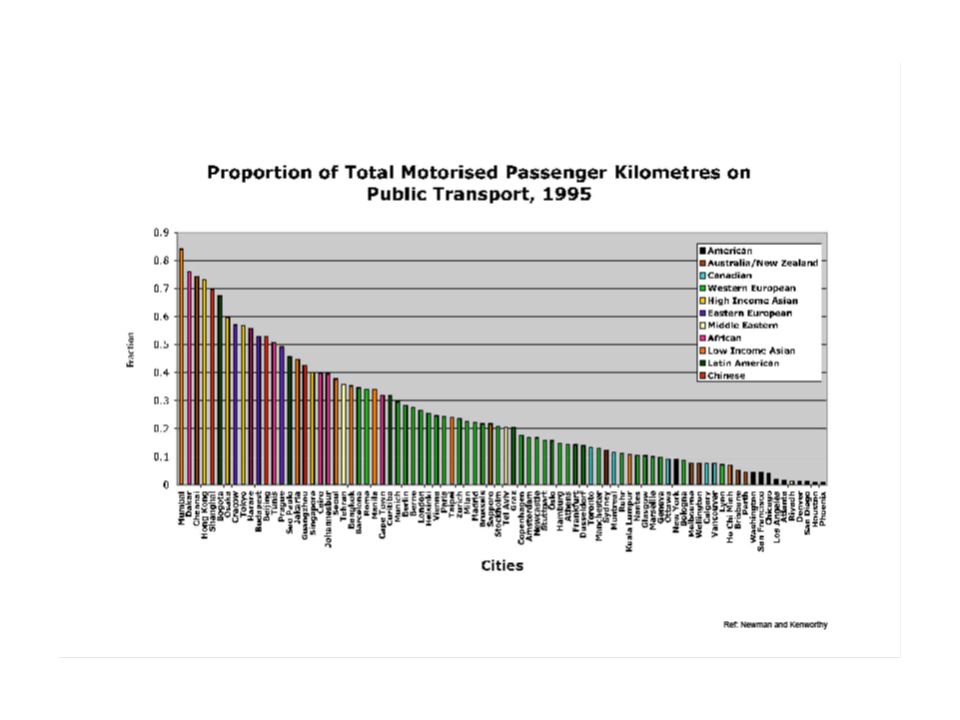
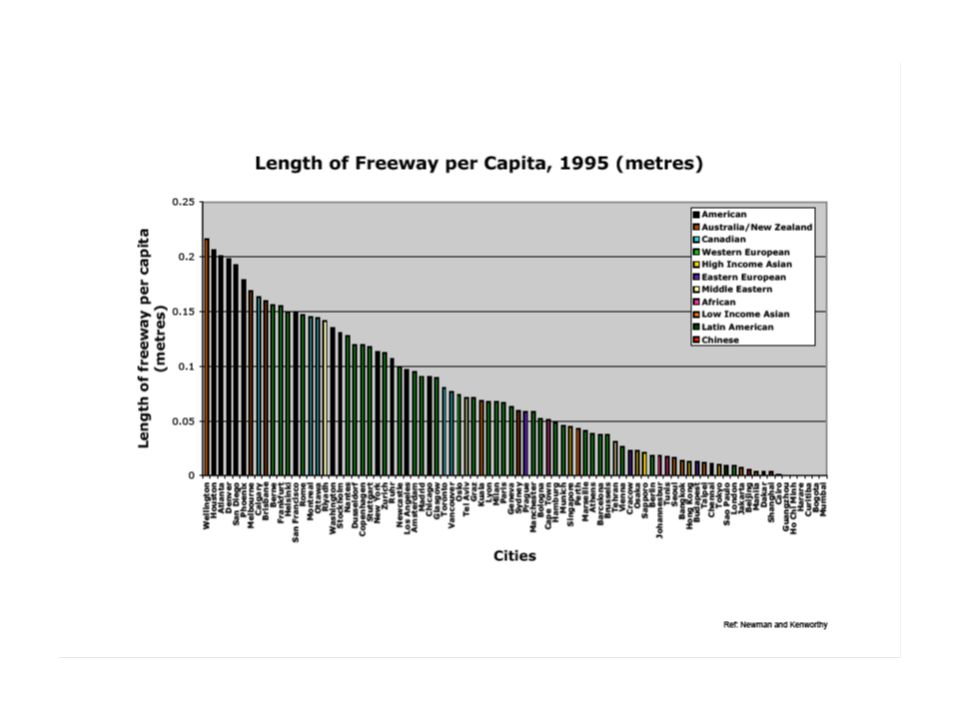
Lecture 5 Newman and Kenworthy: Transportation Comparison of Global Cities reference: Newman and Kenworthy Ch 3: pg. 68 to 78 and 111 to 127Newman and Kenworthy Ch 3: pg. 68 to 78 and 111 to 127

4
Fuel Efficiency of Urban Cars MJ/kmliters/100 kmMPG American 5.0314.516.2 Australian 5.1114.716.0 Canadian 4.8514.016.8 European 3.7910.921.5 High Income Asian 4.9314.216.5 Low Income Asian 3.5310.223.1

5
CarBusAll Rail American 3.522.520.74 Australian 3.121.641.12 Canadian 3.451.610.51 European 2.621.320.49 High Income Asian 3.030.840.16 Low Income Asian 2.120.740.24 Energy Efficiency of Different Modes of Transportation (MJ per Passenger km)
")
6
MJ per Passenger kmAverage Vehicle Occupancy Car2.91.5 Bus1.613.8 Heavy Rail (electric)0.431.0 Heavy Rail (diesel)1.428.0 Light Rail/Tram/Streetcar0.829.7 Energy Efficiency of the Various Transportation Modes - Average for All Cities in the Study
 Heavy Rail (diesel) Light Rail/Tram/Streetcar Energy Efficiency of the Various Transportation Modes - Average for All Cities in the Study")
Similar presentations


 Eddy Versonnen KdG University College Antwerp.>")


