Download presentation
Presentation is loading. Please wait.

1
Virginia’s Growing Mature & Diverse Population: Implications for the Transportation Sector Kevin F Byrnes, AICP kevin.byrnes@vda.virginia.gov kevin.byrnes@vda.virginia.gov Aging Demographer Virginia Department for the Aging

2
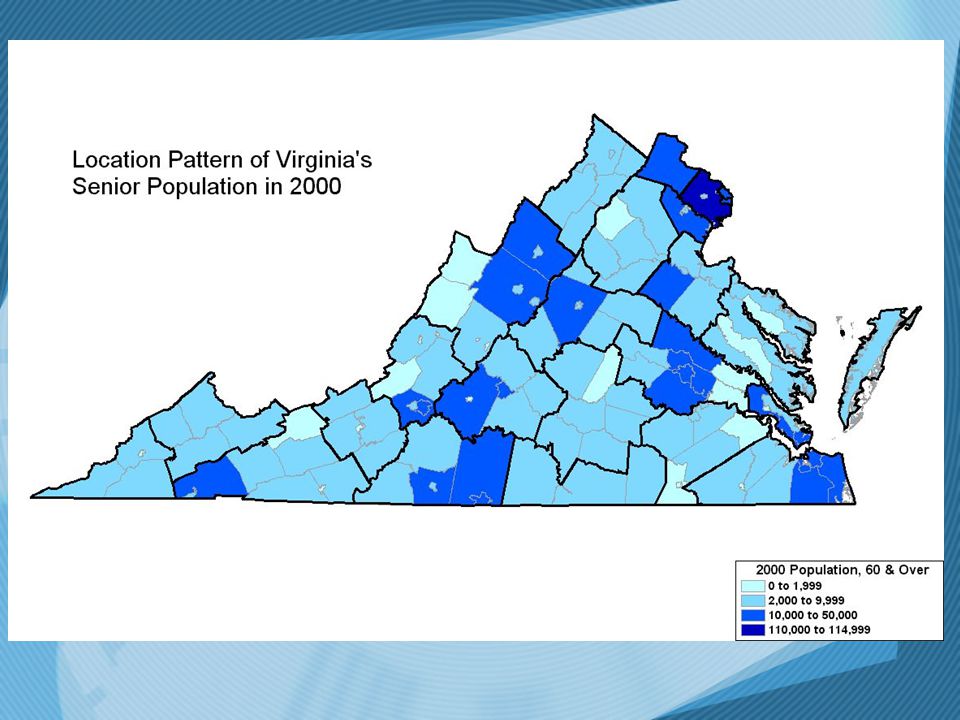
Virginia’s Aging Program: 25 Planning & Service Areas

4
Short-term Trends: 2000 – 2003 1. Migration > Natural Increase 2. Uneven Sub-State Regional Growth 3. Increasing Racial & Ethnic Diversity

5
Demographic Change: P 1 = P 0 + Components of Change: Natural Increase: (Births 0-1 – Deaths 0-1 ) + Net Migration: (In-Migrants 0-1 – Out-Migrants 0-1 ) + residual Cumulative Estimates of the Components of Population Change for Virginia: April 1, 2000 to July 1, 2003 Geographic area Total population change* National Residual Natural increaseNet migration TotalBirthsDeathsTotal Net international migration Net internal migration Virginia307,8472,352137,243321,528184,285168,25290,53677,716 Share of Change100.0%0.76%44.58%104.44%59.86%54.65%29.41%25.25% Table 4: Cumulative Estimates of the Components of Population Change for the United States and States: April 1, 2000 to July 1, 2003 (NST-EST2003-04) Source: Population Division, U.S. Census Bureau; Release Date: December 18, 2003; Last Revised Date: May 11, 2004.

7
Increasing Racial Diversity

8
Increasing Ethnic Diversity

10
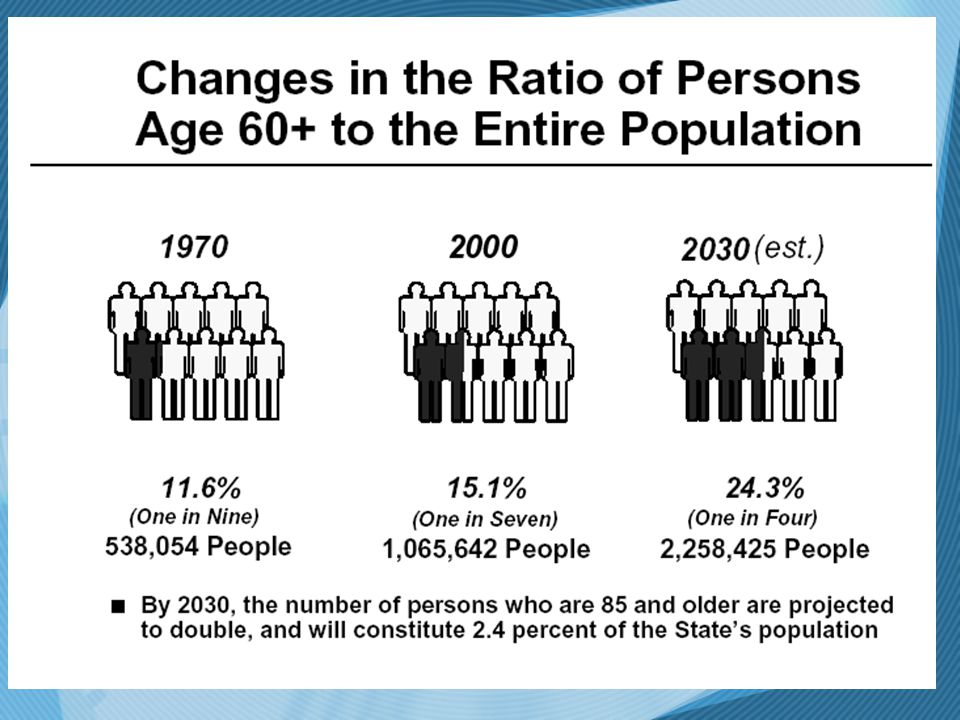
Changing Age Structure: The Baby-Boom Tidal Wave Boomers born between 1946 & 1964 Year 2000: Boomers = Persons aged 36-54 Year 2004: Boomers = Persons aged 40-58 Year 2006: Boomers = Persons aged 42-60 Year 2010: Boomers = Persons aged 46-64 Year 2016: Boomers = Persons aged 52-70 Year 2024: Boomers = Persons aged 60-78

11
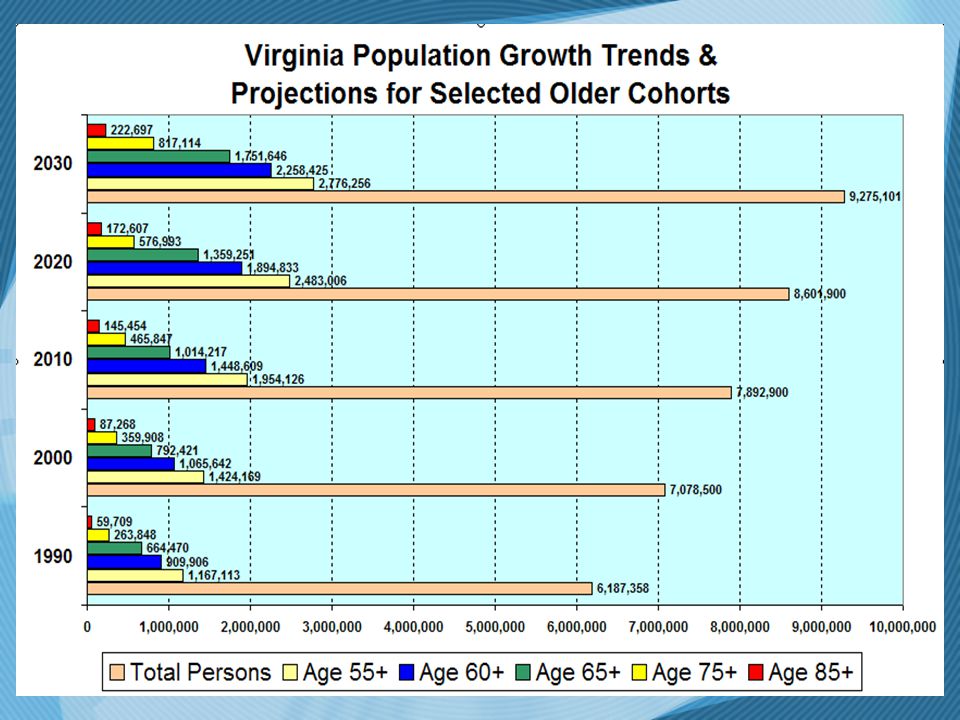
Virginia’s Projected Population Growth, 2000 - 2030

12
The Growing Importance of Senior Cohort K – 12 Population Baby- Boomers Seniors, Age 60+ Boomer : Senior Ratio K -1 2 : Senior Ratio 1990 1,173,7372,017,596909,9602.2171.290 2000 1,378,3552,078,3171,065,6421.9501.293 2010 1,404,5542,014,0551,448,6091.3900.970 2020 1,502,0201,788,3791,894,8330.9440.793 2030 1,630,7831,428,7402,258,4250.6330.722

13
Demographic Trends, 2000 - 2025

15
Trends in Life Expectancy

16
Life Expectancy Change (in Years): by Age, Race, and Sex, United States (1950 - 2000) Age All RacesWhiteBlack TotalMaleFemaleTotalMaleFemaleTotalMaleFemale At Birth8.938.838.748.588.598.0711.179.3912.50 17.417.077.367.056.896.839.257.3410.83 106.966.656.926.626.526.448.606.6410.23 206.806.386.776.496.286.348.316.279.83 306.596.226.526.386.116.107.615.798.98 406.295.916.146.115.935.866.725.017.98 505.705.315.60 5.375.445.523.956.43 604.664.223.784.654.244.763.632.394.25 703.582.893.333.612.934.021.820.762.21 802.361.662.582.331.622.610.880.230.95 901.260.801.751.190.731.291.030.621.07 1000.780.480.890.480.280.581.060.871.06
: by Age, Race, and Sex, United States ( ) Age All RacesWhiteBlack TotalMaleFemaleTotalMaleFemaleTotalMaleFemale At Birth")
17
What Lies Ahead? Projected US Life Expectancy Range: Life Expectancy AT BIRTH 1999202520502100 Total Male 74.0 – 74.176.5 – 79.179.5 – 83.885.0 – 92.3 Total Female 79.7 – 79.882.6 – 84.684.9 – 88.489.3 – 95.2 White, NH Male 74.7 – 74.776.9 – 79.279.5 – 83.584.8 – 91.8 White, NH Female 80.1 – 80.182.6 – 84.584.8 – 88.089.0 – 94.6 Black, NH Male 68.3 – 68.572.4 – 75.376.6 – 81.383.9 – 91.4 Black, NH Female 75.1 – 75.279.3 – 81.782.7 – 86.588.4 – 94.5 Am Indian, NH Male 72.8 – 73.077.2 – 80.180.3 – 84.985.6 – 92.9 Am Indian, NH Female 82.0 – 82.185.3 – 87.787.3 – 91.090.6 – 96.5 Asian, NH Male 80.8 – 80.981.5 – 83.883.2 – 87.186.6 – 93.5 Asian, NH Female 86.5 – 86.686.8 – 88.788.1 – 91.290.7 – 96.2 Hispanic Males 77.1 – 77.279.0 – 81.581.4 – 85.585.8 – 92.9 Hispanic Females 83.7 – 83.885.1 – 87.186.8 – 90.090.1 – 95.6 NH = “Non-Hispanic” Source: National Projections Program, Population Division, U.S. Census Bureau, Wash. DC 20233. Jan 13, 2000. Expectancy Range (in Years): Low – High Projection Series
: Low – High Projection Series.")
21
Possible Impact of Aging Trends on Virginia’s Transportation Sector

22
In 2003, Virginia’s population age 60 & over represented 15.6% of the state total, compared to Florida’s 22.4% (1 st in the Nation) Based on national projections, Virginia’s age 60+ population share (24.3%) in 2025 will be roughly comparable to Florida’s current age structure (persons age 60+ =22.4% of total in 2003).
 Based on national projections, Virginia’s age 60+ population share (24.3%) in 2025 will be roughly comparable to Florida’s current age structure (persons age 60+ =22.4% of total in 2003).")
23
Estimated & Projected Licensees, by Age Licensees by Age/ Total Population 1999 Pct Licensed 201020202030 Age 60 – 64 243,016 255,057 95.3 %413,976 434,392 510,410 535,582 482,960 506,779 Age 65 – 69 198,323 228,346 86.8 %274,995 316,815 377,753 435,199 434,904 501,042 Age 70 – 74 167,101 199,615 83.7 %193,811 231,554 290,489 347,060 362,831 433,490 Age 75 – 79 126,465 161,947 78.1 %141,087 180,649 191,350 245,006 273,616 350,340 Age 80 – 84 66,593 100,961 65.9 %92,091 139,744 105,031 159,380 160,847 244,077 Age 85 + 30,653 84,016 36.5 %53,091 145,454 63,002 172,607 81,284 222,697 Age 60 & over 832,151 1,029,942 80.8 %1,169,051 1,448,608 1,538,035 1,894,834 1,796,442 2,258,425

24
“Driving Age” Household Population Forecast Age Group Estimated 2000201020202030 Total Population 7,078,5127,892,9008,601,9009,275,100 Driving Age Population 4,806,0825,359,0255,840,4136,297,490 Under 65 Yrs 4,057,0554,412,6834,576,7624,670,863 65 - 74 Yrs 425,265540,736770,702920,192 75 - 84 yrs 255,857298,524373,484552,279 85 yrs + 67,905107,082119,465154,156 65 Yrs & over 749,027946,3421,263,6511,626,627 Pct Drivers, Age 65+ 15.6 %17.7 %21.6 %25.8 %

25
Mean Daily Trips & Miles Forecast: Senior Drivers 2000201020202030 Virginia Drivers, 65 Yrs & over 749,027946,3421,263,6511,626,627 Mean Number of Daily Trips*, Persons Age 65+ 3.4 Estimated No of Daily Vehicle Trips by Persons Age 65+ 2,546,6923,217,5634,204,6135,530,532 Est. No of Daily Vehicle Miles Traveled*, Persons Age 65+ 17.0 Estimated No of Miles Traveled, Persons Age 65+ 12,733,45916,087,81421,482,06727,652,659 * SOURCE: The 2001 National Household Travel Survey, person file, U.S. Department of Transportation. (Link)Link
Link.")
26
Traffic Fatalities by State Traffic Fatalities Fatality Rate Deaths per 100 million vehicle miles travelled 200219802002 Virginia 9142.71.2 Florida 3,1323.61.8 Source: US Statistical Abstract: 2004-2005, Table No 1090, page 697

27
Estimated & Projected Traffic Fatalities: Senior Virginians 200020102020 2030 Virginia Drivers, Age 65 - 74 425,265540,736770,702920,192 Death Rate per 100,000 (USA rate) 17.31 Traffic Fatalities, 65-74 7494133159 Virginia Drivers, Age 75 & over 323,762405,606492,949706,435 Death Rate per 100,000 (USA rate) 26.47 Traffic Fatalities, 75 & over 86107130187 Total Traffic Fatalities, 65+ 160201263346
 Traffic Fatalities, Virginia Drivers, Age 75 & over 323,762405,606492,949706,435 Death Rate per 100,000 (USA rate) Traffic Fatalities, 75 & over Total Traffic Fatalities,")
28
Vehicles/Household by Age of Householder, 2000 AGE GROUP Total Population Household Population No Vehicle Available Percent of Household Population w/o Vehicle Estimated Mean Vehicles per Person TOTAL 7,080,5886,848,776394,8395.7 %2.098 60 & over1,062,7821,017,265106,86810.5 %1.824 65 & over788,814745,81091,65712.3 %1.730 70 & over568,051528,11175,33714.3 %1.655 75 & over362,668327,00058,08617.8 %1.564 80 & over199,655171,01538,18222.3 %1.493 85 & over90,78371,99819,93327.7 %1.456 Baby-Boomers = 36 – 54 yrs 2,089,3032,052,99387,4934.2 %2.212

29
Work Status & Vehicle Availability for Older Virginians, 60 & over, 2000 Virginians, Age 60 & overNumber Percent of Total Percent, by Employment Status, Without Vehicle Mean Vehicles Per Person Employed221,74121.8 %4.2 %2.028 Employed, Not at Work 5,127.5 %3.6 %1.983 Armed Forces11.0 %0.0 %2.000 Unemployed5,763.6 %8.3 %1.831 Not in Labor Force 781,35876.8 %11.7 %1.734 Sample Error3,265.3 %NA Estimated Total 1,017,265100.0 %10.5 %1.788 Source: 2000 Census, PUMS Data, 5% Sample of Persons.

30
Age Differences in Commuter Mode Choice, 2000 Commuter Mode Choice Employed Workers (Percent of Total) Under Age 60 Early Boomer (45-54) Late Boomer (36 - 44) Age 60 & over Car, truck, or van 90.4 % 90.9 % 91.6 % 86.4 % Bus or trolley bus 1.7 % 1.4 % 1.5 % Streetcar or trolley car 0.0 % Subway or elevated 1.7 % 1.4 % 1.3 % Railroad 0.0 % 0.2 % 0.1 % Ferryboat 0.0 % Taxicab 0.1 % Motorcycle 0.1 % Bicycle 0.2 % 0.1 % 0.2 % 0.1 % Walked 2.1 % 1.4 % 2.2 % Worked at home 2.8 % 3.4 % 2.9 % 7.5 % Other method 0.7 % 0.6 % 0.7 % 0.8 % TOTAL 100.0 %
 Under Age 60 Early Boomer (45-54) Late Boomer ( ) Age 60 & over Car, truck, or van 90.4 % 90.9 % 91.6 % 86.4 % Bus or trolley bus 1.7 % 1.4 % 1.5 % Streetcar or trolley car 0.0 % Subway or elevated 1.7 % 1.4 % 1.3 % Railroad 0.0 % 0.2 % 0.1 % Ferryboat 0.0 % Taxicab 0.1 % Motorcycle 0.1 % Bicycle 0.2 % 0.1 % 0.2 % 0.1 % Walked 2.1 % 1.4 % 2.2 % Worked at home 2.8 % 3.4 % 2.9 % 7.5 % Other method 0.7 % 0.6 % 0.7 % 0.8 % TOTAL %")
31
Contact Information: Kevin F Byrnes, AICP Demographer Virginia Department for the Aging 1610 Forest Ave, Suite 100 Richmond, VA 23229 (804) 662-7047 Kevin.Byrnes@vda.virginia.gov http://www.vda.virginia.gov/downloadable.htm
")
Similar presentations


 981-4076>")

 Demographic Highlights TEXAS is: big. The population.>")


