Download presentation
Presentation is loading. Please wait.

1
Demographic Trends and Missouri’s Children Missouri State Board of Education April 21, 2005 Dr. Bill Elder University of Missouri-Columbia Office of Social and Economic Data Analysis

2
Overview of Presentation Broad demographic context for Missouri Some factors in school environments and communities that impact performance Missouri regional and local diversity Implications and discussion –Is demography destiny? –Educational leadership beyond the school

10
Age Comparisons American Community Survey 2003 Age Indicators U.SMissouri Median age (years) 36.036.8 Under 18 years old 25.67%25.27% 65 years and over 11.98%12.71%
 Under 18 years old 25.67%25.27% 65 years and over 11.98%12.71%")
13
Enrollment by Locale of District, 2004-2005 School Year Percent Enrollment Percent Change District Locale 2005Distribution 2000-2005 Large City Metro (> 250k) 108,07512.1%-6.6% Mid-Size City Metro (<250 k) 64,6957.3%-2.0% Urban Fringe Large City 307,60034.5%2.9% Urban Fringe Mid-Size City 34,3533.9%11.6% Large Town (> 25k) 12,9511.5%-1.7% Small Town (<25k) 138,07615.5%-4.8% Rural Metro 87,7699.8%1.6% Rural Non-Metro 138,58215.5%-0.7% Total Missouri 892,101100.0%-0.4%
 108, %-6.6% Mid-Size City Metro (<250 k) 64,6957.3%-2.0% Urban Fringe Large City 307, %2.9% Urban Fringe Mid-Size City 34,3533.9%11.6% Large Town (> 25k) 12,9511.5%-1.7% Small Town (<25k) 138, %-4.8% Rural Metro 87,7699.8%1.6% Rural Non-Metro 138, %-0.7% Total Missouri 892, %-0.4%")
14
Missouri African American Enrollment 2004-2005 by Locale District Locale African American Percent of Total Pct Enroll 2005 Pct Enroll 2000 Chg 2000- 05 Large City Metro 63,80840.0%59.0%59.4%-0.4% Mid-Size City Metro 6,8134.3%10.5%8.4%2.2% Urban Fringe Large 70,61944.3%23.0%21.5%1.4% Urban Fringe Mid 4890.3%1.4%0.8%0.6% Large Town (> 25k) 2,5161.6%19.4%15.0%4.4% Small Town (<25k) 10,8276.8%7.8%7.4%0.4% Rural Metro 2,2471.4%2.6%1.6%0.9% Rural Non-Metro 2,1071.3%1.5%1.3%0.2% Total Missouri 159,426100.0%17.9%17.3%0.6%
 2,5161.6%19.4%15.0%4.4% Small Town (<25k) 10,8276.8%7.8%7.4%0.4% Rural Metro 2,2471.4%2.6%1.6%0.9% Rural Non-Metro 2,1071.3%1.5%1.3%0.2% Total Missouri 159, %17.9%17.3%0.6%")
15
American Community Survey 2003 Race Comparison USMissouri White 76.16%84.96% Black or African American 12.13%11.30% Hispanic or Latino (of any race) 13.85%2.27% American Indian and Alaska Native 0.77%0.44% Asian 4.15%1.35%
 13.85%2.27% American Indian and Alaska Native 0.77%0.44% Asian 4.15%1.35%")
17
Missouri Hispanic Enrollment by District Locale 2004-2005 District LocaleHispanic Percent of Total Pct Enroll 2005 Pct Enroll 2000 Chg 2000- 05 Large City Metro 8,02131.9%7.4%3.9%3.5% Mid-Size City Metro 2,0638.2%3.2%1.9%1.2% Urban Fringe Large 6,32725.2%2.1%1.1%0.9% Urban Fringe Mid 1,3675.4%4.0%2.0% Large Town (> 25k) 2791.1%2.2%1.1%1.0% Small Town (<25k) 3,17412.6%2.3%1.3%1.0% Rural Metro 1,1774.7%1.3%0.8%0.6% Rural Non-Metro 2,69710.7%1.9%1.2%0.8% Total Missouri 25,105100.0%2.8%1.6%1.2%
 %2.2%1.1%1.0% Small Town (<25k) 3, %2.3%1.3%1.0% Rural Metro 1,1774.7%1.3%0.8%0.6% Rural Non-Metro 2, %1.9%1.2%0.8% Total Missouri 25, %2.8%1.6%1.2%")
18
English Learners American Community Survey 2003 English Learners U.SMissouri Speak Spanish 11.28%1.91% Speak English less than "very well" 5.48%0.67%

20
Missouri Increased “Limited English Proficiency” between 2000-2003 Statewide from 8,567 to 14,855 Jackson County – 1,523 to 3,878 St. Louis County – 1,412 to 2,722 St. Louis City – 2,675 to 2,768

22
Factors Impacting Learning

25
Missouri Geographic Diversity Differing rates of growth Differing racial/ethnic diversity

26
Family Structure Comparison American Community Survey 2003 Family Structure U.SMissouri Family households (families) 67.38% With own children under 18 years 32.17%30.84% Married-couple families 50.44%51.51% With own children under 18 years 22.39%21.33% Female householder, no husband 12.57%11.40% With own children under 18 years 7.65%7.13%
 67.38% With own children under 18 years 32.17%30.84% Married-couple families 50.44%51.51% With own children under 18 years 22.39%21.33% Female householder, no husband 12.57%11.40% With own children under 18 years 7.65%7.13%")
27
Educational Attainment Comparison American Community Survey 2003 Educational Attainment U.SMissouri Percent high school graduate or higher 83.685.4 Percent bachelor's degree or higher 26.524.1

28
Mobility Comparison American Community Survey 2003 RESIDENCE 1 YEAR AGO -- Mobility U.SMissouri Same House 84.94%83.71% Different House15.06%16.29% Different County5.13%6.74%

29
Income Comparison American Community Survey 2003 INCOME U.SMissouri Median household income (dollars) 43,564 40,725 Mean household income (dollars) 58,036 51,324 Median family income (dollars) 52,27349,441 Mean family income (dollars) 66,92060,011 Per capita income (dollars) 23,11021,473
 43,564 40,725 Mean household income (dollars) 58,036 51,324 Median family income (dollars) 52,27349,441 Mean family income (dollars) 66,92060,011 Per capita income (dollars) 23,11021,473")
30
Poverty Rate Comparison American Community Survey 2003 PERCENT in POVERTY IN THE PAST YEAR U.SMissouri All Persons 12.711.7 65 years and over 9.810.4 Children under 18 years 17.315.3 Children under 5 years 20.517.9

32
2004 Population Estimates Moderate growth 5.7 million up 158,000 since 2000 (2.8%) Balance growth –88,807 Natural Increase –69,128 Net Migration
 Balance growth –88,807 Natural Increase –69,128 Net Migration")
33
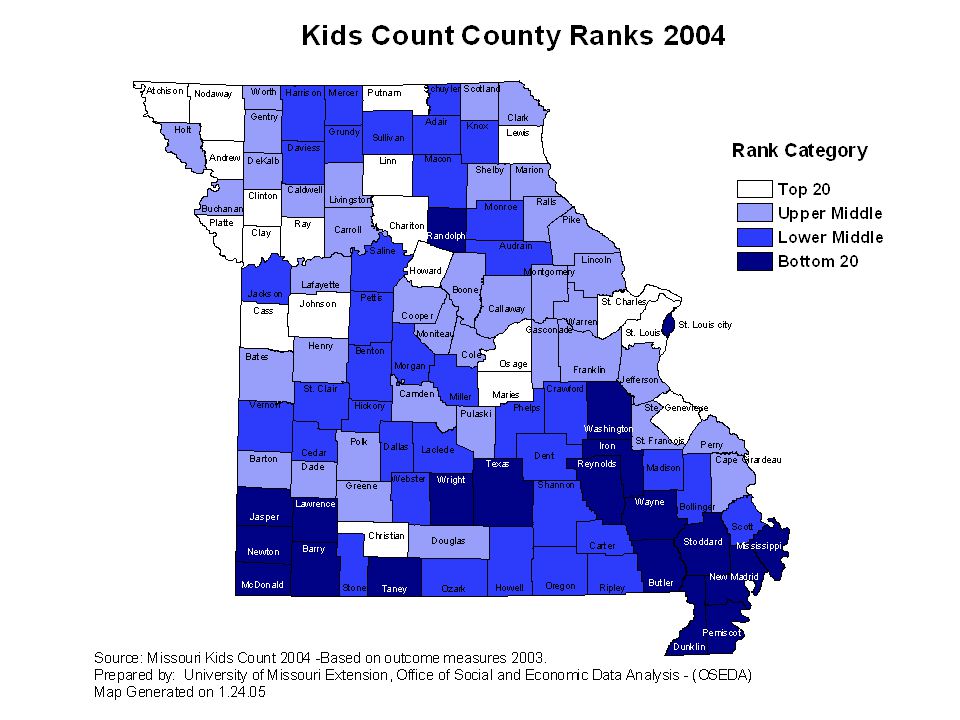
Rank 1-13 Rank 14-25 Rank 26-38 Rank 39-50 2004 National Kids Count Data Book Overall Rank

34
More than 20% better than state median (17 and lower) Up to 20% better than state median (18 to 21) Up to 20% worse than state median (22 to 25) More than 20% worse than state median (26 and higher) Teen Births Rate per 1,000 Females Ages 15 to 17, 2001 Source: Birth Statistics: 2001 data: Child Trends, Inc., Facts at a Glance (Washington, DC: 2003) 2004 National Kids Count Data Book
 Up to 20% better than state median (18 to 21) Up to 20% worse than state median (22 to 25) More than 20% worse than state median (26 and higher) Teen Births Rate per 1,000 Females Ages 15 to 17, 2001 Source: Birth Statistics: 2001 data: Child Trends, Inc., Facts at a Glance (Washington, DC: 2003) 2004 National Kids Count Data Book")
35
More than 20% better than state median (7 and lower) Up to 20% better than state median (8 to 9) Up to 20% worse than state median (10 to 11) More than 20% worse than state median (12 and higher) Teens who are High School Dropouts (ages 16-19), 2001 Source: U.S. Bureau of Labor Statistics, special tabulations of Current Population Survey microdata from 1995 through 2002 2004 National Kids Count Data Book

36
More than 20% better than state median (6 and lower) Up to 20% better than state median (7 to 8) Up to 20% worse than state median (9 to 10) More than 20% worse than state median (11 and higher) Source: U.S. Bureau of Labor Statistics, special tabulations of Current Population Survey microdata from 1995 through 2002. 2004 National Kids Count Data Book Percent of Teens Not Attending School and Not Working (ages 16-19), 2001
,")
37
More than 20% better than state median (19.2 and lower) Up to 20% better than state median (19.3 to 24.0) Up to 20% worse than state median (24.1 to 28.8) More than 20% worse than state median (28.9 and higher) Percent of children living in families where no parent has full-time, year-round employment, 2001 2004 National Kids Count Data Book Source: Urban Studies Institute at the University of Louisville, analysis of data from the U.S. Census Bureau, Current Population Survey, Annual Demographic File, March 1996 through 2002 (including March 2001 bridge file); and Annual Social and Economic Supplement, March 2003.
; and Annual Social and Economic Supplement, March")
38
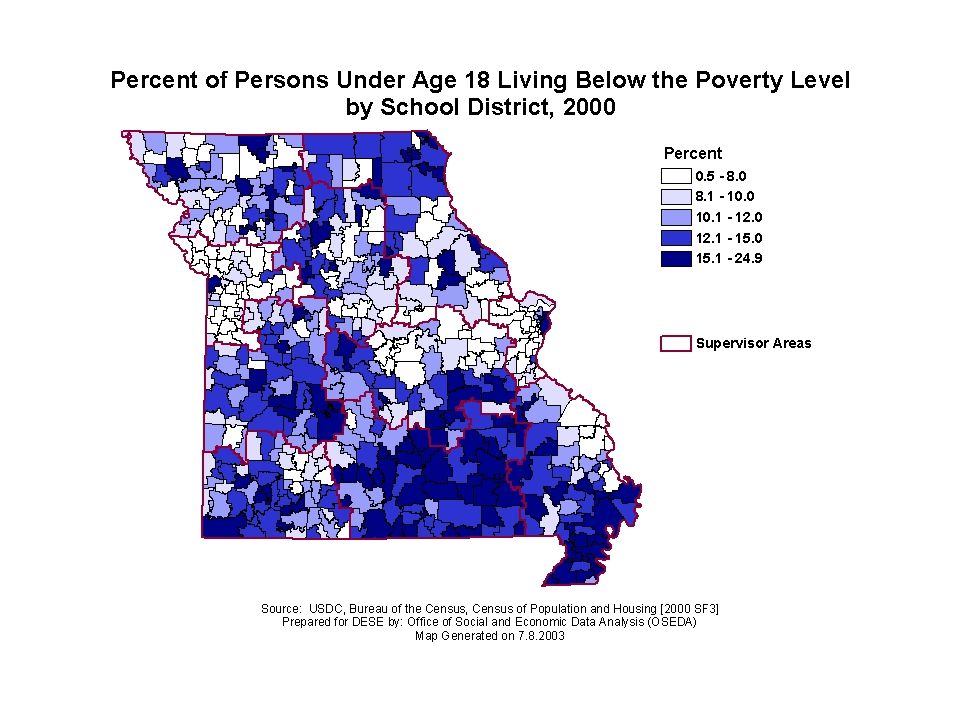
More than 20% better than state median (11 and lower) Up to 20% better than state median (12 to 14) Up to 20% worse than state median (15 to 17) More than 20% worse than state median (18 and higher) Percent of Children in Poverty, 2001 Source: U.S. Census Bureau, Small Area Income and Poverty Estimates Program, data accessed online at www.census.gov/hhes/www/saipe.html (November 20, 2003). 2004 National Kids Count Data Book
 National Kids Count Data Book.")
41
Missouri Free and Reduced Lunch by Locale 2005 District Locale Free and Reduced Lunch 2005 Percent 2005 Percent FRL 2005 Percent FRL 2000 Chg 2000- 05 Large City Metro 74,22220.4%71.5%62.8%8.8% Mid-Size City Metro 25,9227.1%40.8%34.8%6.0% Urban Fringe Large 89,95824.7%30.1%25.6%4.5% Urban Fringe Mid 12,6513.5%37.2%29.7%7.5% Large Town (> 25k) 4,9151.3%39.7%30.3%9.4% Small Town (<25k) 62,85917.2%46.9%39.8%7.1% Rural Metro 23,0796.3%26.7%21.3%5.4% Rural Non-Metro 70,95319.5%52.3%46.4%5.9% Total Missouri 364,558100.0%42.0%36.5%5.5%
 4,9151.3%39.7%30.3%9.4% Small Town (<25k) 62, %46.9%39.8%7.1% Rural Metro 23,0796.3%26.7%21.3%5.4% Rural Non-Metro 70, %52.3%46.4%5.9% Total Missouri 364, %42.0%36.5%5.5%")
43
Missouri Students with Disabilities (IEPs) by Locale 2005 District Locale IEP Students 2005 Percent of Total Pct Enroll 2005 Pct Enroll 2000 Chg 2000- 05 Large City Metro 21,13413.7%19.6%17.7%1.9% Mid-Size City Metro 9,8896.4%15.3%15.2%0.1% Urban Fringe Large 55,14035.7%17.9%16.1%1.9% Urban Fringe Mid 5,2993.4%15.4%13.2%2.2% Large Town (> 25k) 2,3941.6%18.5%18.8%-0.3% Small Town (<25k) 24,38915.8%17.7%16.1%1.6% Rural Metro 13,5508.8%15.4%15.1%0.4% Rural Non-Metro 22,44614.6%16.2%15.7%0.5% Total Missouri 154,241100.0%17.3%16.0%1.3%
 by Locale 2005 District Locale IEP Students 2005 Percent of Total Pct Enroll 2005 Pct Enroll 2000 Chg Large City Metro 21, %19.6%17.7%1.9% Mid-Size City Metro 9,8896.4%15.3%15.2%0.1% Urban Fringe Large 55, %17.9%16.1%1.9% Urban Fringe Mid 5,2993.4%15.4%13.2%2.2% Large Town (> 25k) 2,3941.6%18.5%18.8%-0.3% Small Town (<25k) 24, %17.7%16.1%1.6% Rural Metro 13,5508.8%15.4%15.1%0.4% Rural Non-Metro 22, %16.2%15.7%0.5% Total Missouri 154, %17.3%16.0%1.3%")
44
Percent of Households with Food Stamp Participation in the past year American Community Survey, 2003 * shows significant annual change Year2003200220012000 US 6.72%6.32% *6.03% *6.16% * MO 7.64%7.07%6.98%6.53% *

47
133 Districts with more than 40%

Similar presentations


 Demographic Highlights TEXAS is: big. The population.>")

 Age 18-24 Age 25-64 Speak English Poorly or Not at All – Age 18 to 64 (%) High.>")


