Download presentation
Presentation is loading. Please wait.

1
Cleaner, More Efficient Mobility: the role of fuels and vehicles Elisa Dumitrescu, UNEP DTIE Transport Unit, Moscow, June 2012

2
UNEP Transport Unit: Key Programmes Avoid: Share the Road Shift: BRT, Low Carbon Mobility Plans: India Improve: Partnership for Clean Fuels and Vehicles, Global Fuel Economy Initiative

3
Number of vehicles * 1000 year 890 million today…over 2.5 billion by 2050 90%+ of growth in developing, emerging economies Opportunity for energy efficiency, green economy innovation IEA 2011 Cars a growing reality in emerging and developing markets…

4
Russia: Top 11 … Russia Europe’s largest car market by 2015 ICCT 2012

5
Demand for liquid fuel driven by non-OECD transport growth BP EO 2030, 2012

6
IEA estimates fuel consumption and emissions of CO2 from cars will roughly double between 2000 and 2050. Worldwide, cars account for close to half of transport sector fuel consumption and CO2 emissions. CO2 from cars to double

7
World LDV CO2 emissions, business as usual vs GFEI, million tonnes (Mt) CO2, GFEI intervention (IEA 2009) BAU vs. Stabilization: fuel consumption, CO2 from cars to double 2000-2050 (IEA) To cap emissions: Fuel efficiency – cut vehicle fuel use by ½ by 2050 + flanking measures
 To cap emissions: Fuel efficiency – cut vehicle fuel use by ½ by flanking measures.")
8
Given the projected expansion of the global fleet, how do we maximise the benefits of fuel efficiency gains in cars on a global scale?

10
The Global Fuel Economy Initiative (GFEI) Mission: Facilitate large reductions of greenhouse gas emissions and oil use through improvements in automotive fuel economy in the face of rapidly growing car use worldwide. Targets (2005 baseline): 30% reduction in LDV fuel consumption per km by 2020 in all new cars in OECD countries 50% by 2030 in all new cars globally 50% by 2050 in all cars globally: from 8 L/100km to 4 L/100km average (90 g CO2/km) – doubling FE 5 Partners:
: 30% reduction in LDV fuel consumption per km by 2020 in all new cars in OECD countries 50% by 2030 in all new cars globally 50% by 2050 in all cars globally: from 8 L/100km to 4 L/100km average (90 g CO2/km) – doubling FE 5 Partners:.")
11
202020302050 New Cars30% reduction* in L/100km in OECD: engines, drive trains, weights, aerodynamics; PHEV, EV, FC not required 50% average improvement globally: full hybridisation of most models; PHEV, EV and FC not required 50% + Global20% reductions with lag time for stock turnover; eco- driving, maintenance 35%50by50 GFEI global timeline * over 2005

12
National, regional, global Support national governments and industry partners to develop sound, consensus-driven policies Collect, analyze and communicate improved data and analysis Consumers and decision makers information Technical Harmonization Working priorities of the GFEI

13
GFEI Menu of Services Lead in national implementation emerging, developing economies Secretariat, lead in communications Data, modelling, baseline, projections Thematic research, scrappage, flows Technical, policy design support in major markets, fiscal instruments

14
Working at country level Australia Chile Georgia Ethiopia Kenya Indonesia Montenegro +20 additional from 2013 KENYA 20052008 Average (l/100km) 7.697.6 Diesel8.679.09 Petrol7.527.2 Fuel Consumption by Year and Fuel Type, Kenya; UNEP 2011
 Diesel Petrol Fuel Consumption by Year and Fuel Type, Kenya; UNEP 2011")
15
http://www.unep.org/transport/gfei/autotool

16
Degree of electrification 0% 100% Internal combustion engine (petrol/diesel) hybridselectric mild Plug-in (parallel) Plug-in (serial, range ext.) Battery electric stop/start full Source: AECC Appropriate technology
 hybridselectric mild Plug-in (parallel) Plug-in (serial, range ext.) Battery electric stop/start full Source: AECC Appropriate technology")
17
Reduced emissions of CO2 by over 1 gigatonne (Gt) a year by 2025 and over 2 gigatonnes (Gt) by 2050 –WB estimates that potential CO2 emission reductions from interventions in Russian road transport 18 mtoe – mostly from fuel efficiency, low emission cars Consumer costs – fuel savings: €962-1,665 by 2020 with 95g Co2/km standard (Europ Savings
 a year by 2025 and over 2 gigatonnes (Gt) by 2050 –WB estimates that potential CO2 emission reductions from interventions in Russian road transport 18 mtoe – mostly from fuel efficiency, low emission cars Consumer costs – fuel savings: €962-1,665 by 2020 with 95g Co2/km standard (Europ Savings")
18
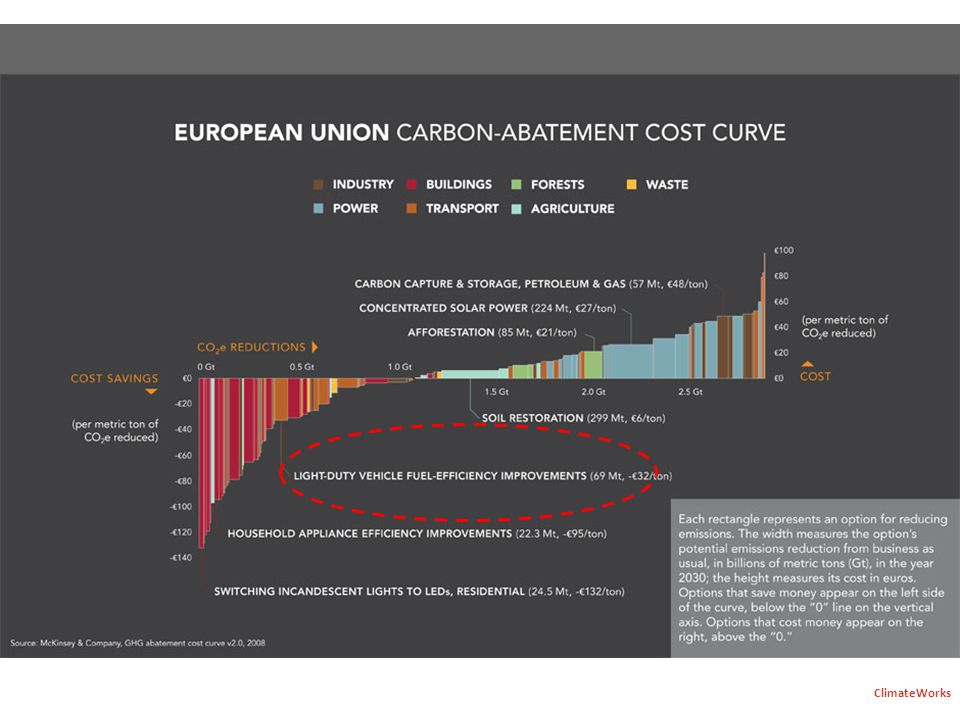
ClimateWorks

20
Data + Analysis: Global Progress - new registrations International Energy Agency 2011 All (new and used) Russia Vehicles: 10-12 L/100 km (WB, 2008) Russia: 2005 - 8.33 l/100 km 2008 - 8.11 l/100 km
 Russia Vehicles: L/100 km (WB, 2008) Russia: l/100 km l/100 km")
21
Fuel efficiency standards? Fiscal incentives: fee-bates, taxation, etc. Labeling schemes Consumer action, auto clubs Flanking measures – preferential parking Potential for action

22
The role of fuel quality Loss of statistical life expectancy (months) due to anthropogenic PM 2.5 emitted in 2000 “Particulate matter affects more people than any other pollutant.” WHO 2011 Road traffic 50-80% source of fine PM Move to low sulphur fuels (<50ppm) and clean vehicles Opens door to cleaner, more efficient technology 1/4 of global Black Carbon emissions come from diesel engines burning high-sulphur fuel
 due to anthropogenic PM 2.5 emitted in 2000 Particulate matter affects more people than any other pollutant. WHO 2011 Road traffic 50-80% source of fine PM Move to low sulphur fuels (<50ppm) and clean vehicles Opens door to cleaner, more efficient technology 1/4 of global Black Carbon emissions come from diesel engines burning high-sulphur fuel")
23
500 ppm and 50 ppm critical vehicle technology breakpoints, allowing for the use of cleaner engines and technologies like filters. 23 Low Sulphur Fuels reduce PM directly, open door to emission controls

24
Partnership for Clean Fuels and Vehicles Global Low Sulphur Campaign Technical, financial, networking support for national policies that make cleaner fuels and vehicles a reality in developing and emerging economies

25
Match transition to low sulphur fuels and Euro V vehicles with a national approach to auto fuel economy – strong policy (standards, fiscal incentives) to enable technology UNEP/GFEI support: 2013 working-level Russia dialogue on fuel economy Focus on Russia
 to enable technology UNEP/GFEI support: 2013 working-level Russia dialogue on fuel economy Focus on Russia")
26
www.globalfueleconomy.org www.unep.org/transport/gfei/autotool www.unep.org/transport Thank you!

Similar presentations


 could.>")


