Download presentation
Presentation is loading. Please wait.

1
第 6章 指數、量表及分類法

2
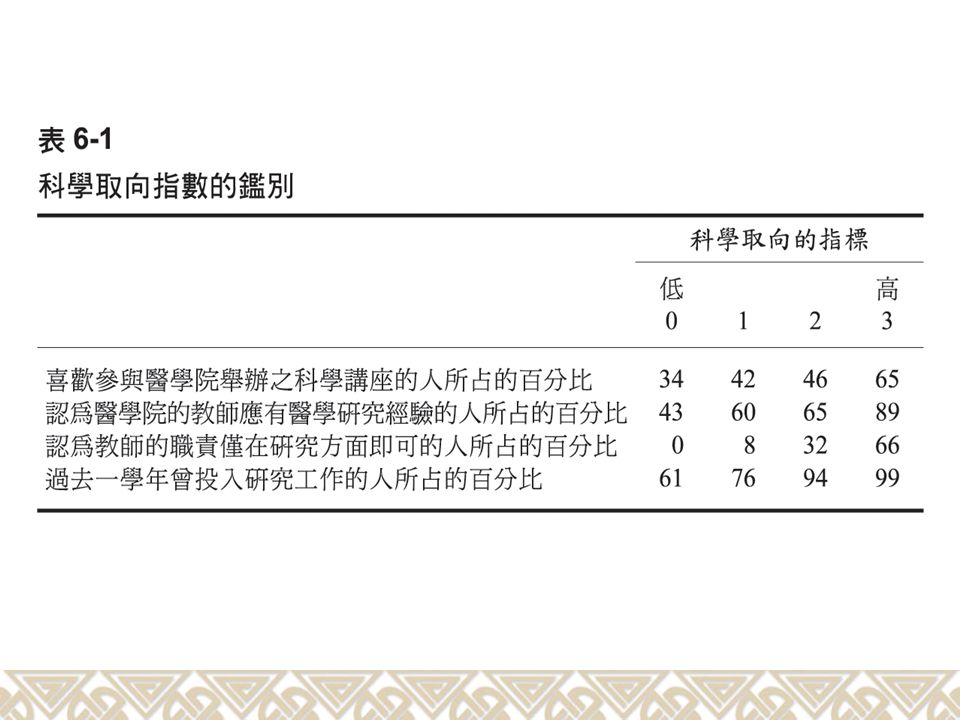
指數與量表 指數的建構 題項的選擇 經驗關係的檢視 指數的積分 遺漏資料的處理 指數的鑑別 女性地位指標:指數建構實例

6
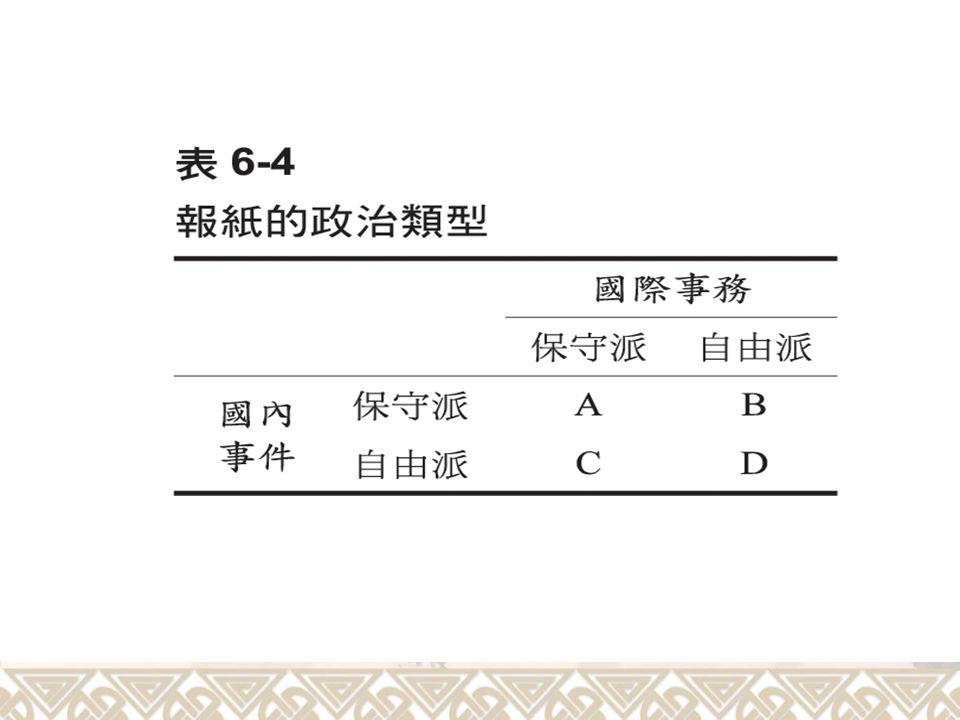
量表的建構 鮑氏社會距離量表 瑟氏量表 李克特量表 語意差異表 古特曼量表 分類法

11
Three types of information were collected:
HATCO Case Primary Database This example investigates a business-to-business case from existing customers of HATCO. The primary database consists 100 observations on 14 separate variables. Three types of information were collected: The perceptions of HATCO, 7 attributes (X1 – X7); The actual purchase outcomes, 2 specific measures (X9,X10); The characteristics of the purchasing companies, 5 characteristics (X8, X11-X14).
; The actual purchase outcomes, 2 specific measures (X9,X10); The characteristics of the purchasing companies, 5 characteristics (X8, X11-X14).")
12
Table 2.1 Description of Database Variables (Hair et al., 1998)
")
13
Missing Data A missing data process is any systematic event external to the respondent (e.g. data entry errors or data collection problems) or action on the part of the respondent (such as refusal to answer) that leads to missing values. The impact of missing data is detrimental not only through its potential “hidden” biases of the results but also in its practical impact on the sample size available for analysis.
 or action on the part of the respondent (such as refusal to answer) that leads to missing values. The impact of missing data is detrimental not only through its potential hidden biases of the results but also in its practical impact on the sample size available for analysis.")
14
Understanding the missing data
Ignorable missing data Remediable missing data Examining the pattern of missing data

15
Table 2.2 Summary Statistics of Pretest Data (Hair et al., 1998)
")
16
Outliers Four classes of outliers: Detecting outliers Procedural error
Extraordinary event can be explained Extraordinary observations has no explanation Observations fall within the ordinary range of values on each of the variables but are unique in their combination of values across the variables. Detecting outliers Univariate detection Bivariate detection Multivariate detection

17
Outliers detection Univariate detection threshold:
For small samples, within ±2.5 standardized variable values For larger samples, within ±3 or ± 4 standardized variable values Bivariate detection threshold: Varying between 50 and 90 percent of the ellipse representing normal distribution. Multivariate detection: The Mahalanobis distance D2

18
Table 2.7 Identification of Univariate and Bivariate Outliers (Hair et al., 1998)
")
19
Fig 2. 3 Graphical Identification of Bivariate Outliers (Hair et al

Similar presentations


:實驗法(實驗設計) (第七章)>")
 Social Research Methods 2117 & 6501 Fall, 2006 November 20, 2006.>")


>")


