Download presentation
Presentation is loading. Please wait.

1
Q1 – Population Change Exam Practice

2
May 2011 Reminder on next few slides then attempt the question...you have 12 mins and this will be timed.

3
Demographic features associated with natural change…. The biological fact that male births exceed female births (106 males : 100 females) so LEDC pyramids clearly show more younger males than females. http://geography.about.com/od/populationgeography/a/se xratio.htm http://geography.about.com/od/populationgeography/a/se xratio.htm Unless you take China = 100 females:120 males In most parts of the world male mortality rates are higher than female rates meaning longer female life expectancy so MEDC pyramids show more elderly females than males
 so LEDC pyramids clearly show more younger males than females. xratio.htm xratio.htm Unless you take China = 100 females:120 males In most parts of the world male mortality rates are higher than female rates meaning longer female life expectancy so MEDC pyramids show more elderly females than males.")
4
Stage 2 - Uganda Concave or very steep sides = high birth rate and high death rate with short life expectancy More boys than girls Adults have equal males and females as childhood diseases and IMR and lifestyle cause more boys to die In ‘old age’ of 30s and 40s there may be more males as females die through childbirth and heavy female responsibility. 1.Sketch the pyramid 2.Annotate the pyramid with 3 gender related points

5
Stage 5 - Germany Low BR – more boys than girls There are a lot less men then women in the 70-85 range - many German men were killed in World War II. There is a large percentage of the population from 30 to 50 – slightly more men than women. These are the immigrants from the Arab and African world that have come to work in Germany. 1. Sketch pyramid 2. Annotate 3 gender related points

6
Facts of the One Child Policy Due to the increasing difference between the sex ratio, now 118 boys:100 girls (usually 105:100) and also an increase of neglect, infanticide, abandonment and abortion of female babies, some couples with their first child being a girl are allowed to try for a second male baby. In order to avoid a drastic decrease in population, if a both people wishing to begin a family are sibling-less, they are allowed to have two children, legally.

7
Female infanticide in China In China it is important to have boys, as only boys can carry on the family name and honour the ancestors. This preference for male children has led to approximately 10,000 female infants being killed in China each year (1996). By the end of the century it is estimated that there will be an excess of 90 million unmarried men. Female infanticide in India Infanticide in India occurs mostly among poor, rural populations. Daughters are considered economic burdens because of the high cost of weddings and dowries, while sons provide income, and are seen as type of insurance by their parents. Research carried out at a Mumbai (formerly Bombay) hospital revealed in 1995 that for every aborted male, there were 1,000 aborted females. In LEDCs culturally and economically boys are preferred to girls.
. By the end of the century it is estimated that there will be an excess of 90 million unmarried men. Female infanticide in India Infanticide in India occurs mostly among poor, rural populations. Daughters are considered economic burdens because of the high cost of weddings and dowries, while sons provide income, and are seen as type of insurance by their parents. Research carried out at a Mumbai (formerly Bombay) hospital revealed in 1995 that for every aborted male, there were 1,000 aborted females. In LEDCs culturally and economically boys are preferred to girls..")
8
What you could include in your answer: Migrations eg more females in Poland due to male economic migration. More males in Uk due to this too. Also Males in Dubai (UAE) due to construction jobs. In the past Turkey to Germany for work. or females (Philippine females out-migrating to MEDCs) Stage of development = stage 5 Germany more women over 65 and stag 2 Uganda more males due to Biological fact male birth rates exceed female BR. Case Studies India – infanticide China – one child policy IVF and designer babies – may lead to more of one gender in future Gender concentrations in N England – textile industry or gay quarters eg Birmingham. Conflict eg less males in older categories in Germany after ww2 and Afghanistan etc.
 due to construction jobs. In the past Turkey to Germany for work. or females (Philippine females out-migrating to MEDCs) Stage of development = stage 5 Germany more women over 65 and stag 2 Uganda more males due to Biological fact male birth rates exceed female BR. Case Studies India – infanticide China – one child policy IVF and designer babies – may lead to more of one gender in future Gender concentrations in N England – textile industry or gay quarters eg Birmingham. Conflict eg less males in older categories in Germany after ww2 and Afghanistan etc..")
12
Solutions 1.Pro-natalist policies – eg France encourages women to have three or more children by reducing income tax, travel costs on public transport and a doubling of child benefit to $1,000 a month. 2.Sweden has generous paternity and maternity provisions. 3.Discouraging early retirement – for women it will gradually rise from 60 to 65 between 2010 and 2020. For both men and women it will rise further, from 65 to 68, between 2024 and 2046. 4.Workers set up independent pension funds – pay as you go. Workers may also have to increase pension contributions by as much as 2.5% of their earnings. 5.Positive immigration -increase its current level of immigration of economically active workers to offset the impact of demographic change. 6.Change mindset of employers to value elderly labour force e.g. B+Q. 7.State pension age will increase from 60 to 66 in the next decade. 8.The aged will be expected to sell property and use assets to pay for social care and old age care homes.

17
Britain’s Population –the issue Median age is 39 21% of people in the UK are aged 60 +. We are ranked 17 th in terms of our ageing population. http://www.guardian.co.uk/world/2008/dec/09/agein g-britain-population

18
People over state pension age: by area, April 2001, United Kingdom West Somerset has the highest average age in the UK at 52, with almost three in 10 people there aged over 65. The figure could reach 56 by 2018 as people continue to retire to the coast. North Norfolk comes next at almost 51, followed by Rother, Christchurch and East Dorset on the south coast,. Where are all the old people?

19
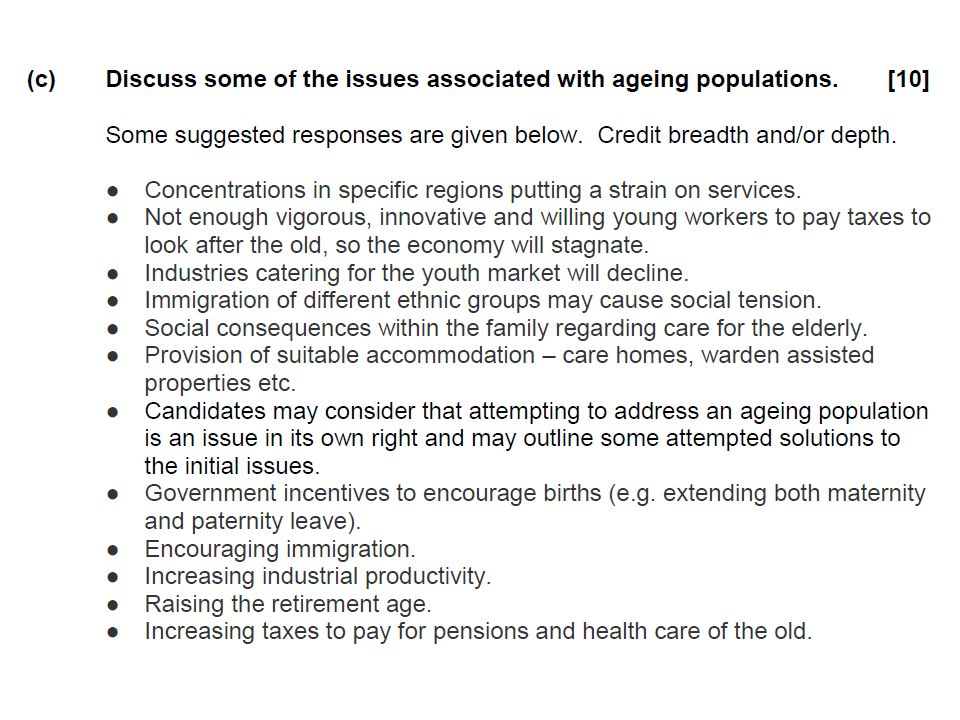
Challenges of our Ageing Population In pairs brainstorm some of the challenges and opportunities of an ageing population (pos/neg impacts) The biggest challenge is thought to be the fact that people are not receiving the pensions they expect due to interest rates being low, equity release from homes falling and the stock market collapse. There is also a massive black hole in the Government’s pension pot……. YouTube - BBC Pensions Handout – challenges and opportunities of ageing population

25
Many migrants remain poor and live suffering ongoing poverty. Immigrants may not integrate Impacts face language problems Tensions build up with native people e.g. Bradford Riots. Jobs done cheaply e.g. Jobs row in Steel Works February 2009 Overcome labour shortages e.g. After WW2 Different cultures are introduced Impacts of migration on receiving country Help countries with ageing populations and population decline as immigrants are usually of working age. Allows country to develop further Strain on schools, health service and housing. Money sent out of country as remittance Many immigrants are skilled. Environment put under pressure with demands for more housing and resources. Shade in yellow – economic green enviro and red social

26
Impacts of migration on exporting countries Migrants may return with new skills to help development Brain drain Damage to environment is lessened Family stress if split up for a long time. Remittance sent home to increase standards of living. Less unemployment Migrants tend to be of working age leaving an aging population

27
Impact on Poland In Poland legislation is being drafted to encourage Poles to return home by offering them high salaries. Many Polish Govt officials were against joining the EU because they knew what would happen to their services (BRAIN DRAIN) Wroclaw (a large city) is developing quickly, The problem is there is a shortage of skilled construction workers and IT specialists because they can earn 7 times as much in the UK. By 2007 35% of jobs in the construction industry could not be filled due to migration. There is an incentive scheme called ‘Stay with Us’ run by a current affairs magazine and some of the biggest companies which have paid 100 scientists and researchers a one off payment of £5000 to stay put.
 Wroclaw (a large city) is developing quickly, The problem is there is a shortage of skilled construction workers and IT specialists because they can earn 7 times as much in the UK. By % of jobs in the construction industry could not be filled due to migration. There is an incentive scheme called ‘Stay with Us’ run by a current affairs magazine and some of the biggest companies which have paid 100 scientists and researchers a one off payment of £5000 to stay put..")
28
Impact on the UK Polish shops and ‘Saturday’ schools have developed The large increase in migrant workers did not take our jobs but helped the economy They are making the workforce younger which has eased the pensions burden and helped keep interest rates down They pay taxes Only 20,00 of migrants earn over £27,000 a year so will be able to retire in the UK Police are complaining about being understaffed and spending money on translators Generally the Poles have been well received a they have a hard working and positive attitude They are willing to do jobs in areas the British won’t e,g, food industry There are now more practising Catholics in the UK than Anglicans Recruitment Agencies from the UK go to Poland to recruit for all business sectors

29
Push and Pull factors : Society and Government Better standard of living and lifestyle in the UK UK more tolerant society and easier to get promoted on basis of ability Polish Govt is still not truly democratic and those most in need of money not getting it Youngsters leaving Poland because they feel the ‘Old School’ still has all the power and is holding the country back Recruiting agencies have set up in Poland to persuade them to move to the UK to fill job vacancies YouTube - The Poles are Coming - part1 of 7 (BBC documentary)
")
33
Other questions you may want to practice: Winter 2013 Winter 2009 Winter 2012

Similar presentations