Download presentation
Presentation is loading. Please wait.

1
Changing Demographics and Growth Patterns in Nebraska Jerry Deichert UNO Center for Public Affairs Research jdeicher@unomaha.edu 402-554-2134jdeicher@unomaha.edu www.unomaha.edu/cparwww.unomaha.edu/cpar www.facebook.com/unocparwww.facebook.com/unocpar Nebraska Chamber of Commerce & Industry 2014 Legislative Caucus/Annual Meeting January 30, 2014Lincoln, NE

2
Three Major Demographic Trends 1.Nebraska’s population is becoming more and more concentrated in its most populous counties. 2.The state’s population is getting older and will continue to age. 3.The state’s population is becoming more racially and ethnically diverse

3
State Population Summary In 2010, Nebraska had a population count of 1,826,341 persons, an increase of 115,076 or 6.7 percent from the 2000 count of 1,711,265 – Nebraska ranked 30th in percentage change (an increase from 37th in 1990s) Nebraska’s growth rate of 6.7 percent in the 2000s was not as strong as the 8.4 percent rise seen in the 1990s – However, it did exceed the average decade growth rate between 1950 and 2000 (5.3 percent) – Congressional District boundaries were redrawn by the Unicameral Legislature In 2013, Nebraska’s population was 1,868,516 – +2.3% since 2010 (ranks 26th) – Compares to 2.4% national growth rate 3
 Nebraska’s growth rate of 6.7 percent in the 2000s was not as strong as the 8.4 percent rise seen in the 1990s – However, it did exceed the average decade growth rate between 1950 and 2000 (5.3 percent) – Congressional District boundaries were redrawn by the Unicameral Legislature In 2013, Nebraska’s population was 1,868,516 – +2.3% since 2010 (ranks 26th) – Compares to 2.4% national growth rate 3")
4
4

5
5

6
2000-2010 Changes for Nebraska’s Congressional Districts District 2000 2010ChangePercent Change NE-1 st 570,421 626,092+ 55,671 + 9.8% NE-2 nd 570,421 638,871+ 68,450 + 12.0% NE-3 rd 570,421 561,378- 9,043 - 1.6% Average district size based on 2010 census is 608,780 DistrictVS. averageEffect of Redistricting NE-1 st +17,312Gained territory from 2 nd district & lost territory to 3 rd district NE-2 nd +30,091Lost territory NE-3 rd - 47,402Gained territory

7
7

8
8

9
County Population Summary 24 Nebraska counties gained population while 69 lost population between 2000 and 2010 – Compares to 40 growing counties in the 1990s and only 10 in the 1980s – 23 counties lost 10% or more of their population between 2000 and 2010 Nebraska’s 3 most populous counties, Douglas, Lancaster, and Sarpy counties are among the state’s fastest growing – Douglas, Lancaster, and Sarpy accounted for 52.6 percent of Nebraska’s population in 2010, up from 48.9 percent in 2000 – These 3 counties grew 14.9 percent between 2000 and 2010 while the remaining 90 counties lost 1.1 percent 9

10
County Population Summary (Continued) Metropolitan (2013 definition) counties added population, but nonmetropolitan counties lost population – Metropolitan13.0% – Nonmetropolitan -2.5% Micropolitan 1.3% Largest city 2,500 to 9,999 persons -4.4% Largest city under 2,500 persons -7.7% Nebraska’s legislative districts also were redrawn with metro areas gaining more representation. – Average legislative district size based on 2010 Census is 37,272 persons. – Legislative district 49 was moved from Northwest Nebraska to Sarpy County. 10

11
Center for Public Affairs Research11

12
12

13
Impact of the 2010 Census on redistricting Douglas14 districts fully within its borders Lancaster7 fully in 2 partially in Sarpy4 fully in 1 partially in Prior to redistricting Douglas11 districts fully within its borders 4 partially in Lancaster6 fully in 2 partially in Sarpy3 fully in 4 partially in

14
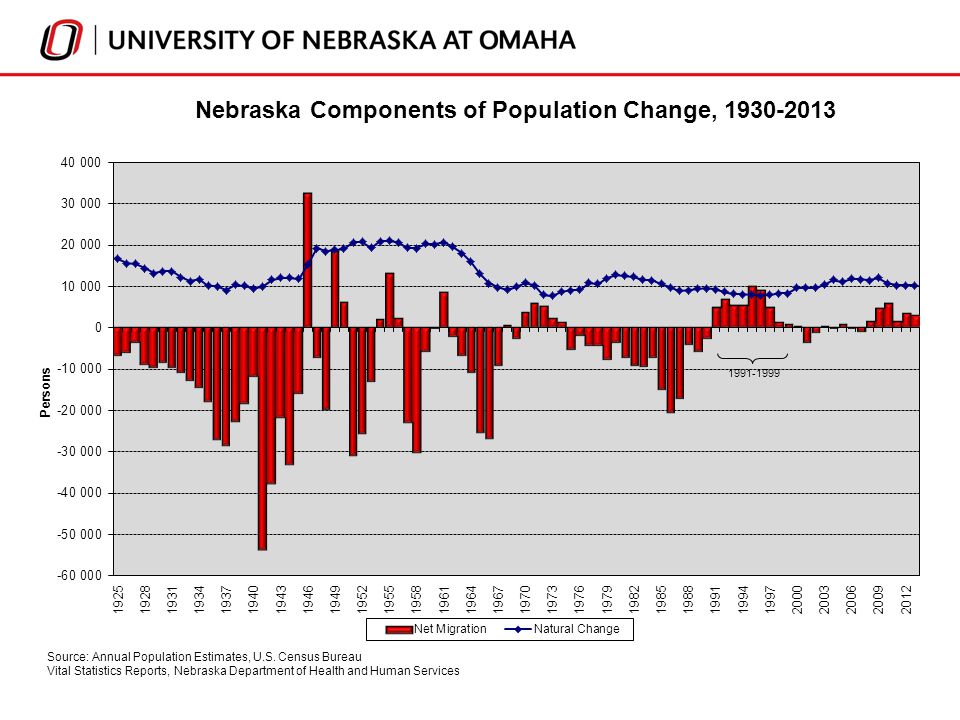
Natural Change Natural Change = Births - Deaths 2012 births were 25,939 – Slight increase from 2011 which was 3rd year of decline – 2011 was lowest number since 2002 2000 to 2010 – Much of the decade population growth stemmed from about 109,500 more births than deaths – The 2000s “natural change” rate of 6.4 percent was higher than the 1990s (5.4 percent) – 44 counties had more deaths than births 14
 – 44 counties had more deaths than births 14")
16
16

17
Net Migration 2010 to 2013 inmigration was 7,322 – International 10,357 – Domestic -3,035 2000 to 2010 – The state experienced a net inmigration of about 5,600 persons – The 2000s net migration rate of 0.3 percent was below a 3.1 percent inmigration in the 1990s – The 1990s and 2000s are the only decades since 1930 to have net inmigration – Only 14 counties had net inmigration 1990 to 2000 – Added about 48,000 persons during the decade (3.1 percent) – 42 counties had net inmigration or no net outmigration 17
 – 42 counties had net inmigration or no net outmigration 17")
18
18

20
20

21
21

22
22

27
Race and Hispanic/Latino Origin Nebraska’s population growth is predominately in minority racial and ethnic groups – Hispanic or Latino (of any race) grew by 77 percent Accounted for nearly two-thirds of state’s overall growth – The White, non Hispanic population barely increased (0.4%) In 2010, Minority population was 17.9 percent of total – Up from 12.7 in 2000 and 7.4 percent in 1990 Minority population is much younger – Relatively more under 40 – Relatively fewer 40+ 27
 grew by 77 percent Accounted for nearly two-thirds of state’s overall growth – The White, non Hispanic population barely increased (0.4%) In 2010, Minority population was 17.9 percent of total – Up from 12.7 in 2000 and 7.4 percent in 1990 Minority population is much younger – Relatively more under 40 – Relatively fewer")
28
Race and Hispanic/Latino Origin Change 2000-2010 Total population 6.7 percent Not Hispanic/Latino Origin 2.6 percent – White alone 0.4 percent – African American or Black alone 19.9 percent – American Indian & Alaska Native alone 9.9 percent – Asian alone 47.2 percent – Nat. Hawaiian, Pac. Islander alone49.3 percent – Some other race alone59.5 percent – Two or more races60.6 percent Hispanic/Latino Origin 77.3 percent Minority 50.7 percent 28

29
29

30
30

Similar presentations


 Shall Rise Again – Just you Wait! 48 th ASU/Chase Economic Forecast>")


 pantry survey found that.>")


