Download presentation
Presentation is loading. Please wait.

1
Lecture Notes on Research Methodology
Raad Hammodi Hasson ; PhD Parasitology.

2
1 Research Methodology:
An Introduction: MEANING OF RESEARCH: Research in common parlance refers to a search for knowledge. Once can also define research as a scientific & systematic search for pertinent information on a specific topic. In fact, research is an art of scientific investigation.

3
Research is an academic activity and as such the term should be used in a technical sense.
According to Clifford Woody research comprises defining and redefining problems, formulating hypothesis or suggested solutions; collecting, organizing and evaluating data; making deductions and reaching conclusions; and at last carefully testing the conclusions to determine whether they fit the formulating hypothesis.

4
OBJECTIVES OF RESEARCH
1. To gain familiarity with a phenomenon or to achieve new insights into it (studies with this object in view are termed as exploratory or formulative research studies); 2. To portray accurately the characteristics of a particular individual, situation or a group(studies with this object in view are known as descriptive research studies); 3. To determine the frequency with which something occurs or with which it is associated with something else (studies with this object in view are known as diagnostic research studies); 4. To test a hypothesis of a causal relationship between variables (such studies are known as hypothesis-testing research studies).
; 2. To portray accurately the characteristics of a particular individual, situation or a group(studies with this object in view are known as descriptive research studies); 3. To determine the frequency with which something occurs or with which it is associated with something else (studies with this object in view are known as diagnostic research studies); 4. To test a hypothesis of a causal relationship between variables (such studies are known as hypothesis-testing research studies).")
5
TYPES OF RESEARCH (i) Descriptive vs. Analytical:
Descriptive research includes surveys and fact-finding enquiries of different kinds. In social science and business research we quite often use the term Ex post facto research for descriptive research studies. The main characteristic of this method is that the researcher has no control over the variables; he can only report what has happened or what is happening. The methods of research utilized in descriptive research are survey methods of all kinds, including comparative and correlation methods.

6
In analytical research, on the other hand, the researcher has to use facts or information already available, and analyze these to make a critical evaluation of the material.

7
(ii) Applied vs. Fundamental:
Applied (or action) research : aims at finding a solution for an immediate problem facing a society or an industrial/business organization, Fundamental (to basic or pure) research: is mainly concerned with generalizations and with the formulation of a theory.
 research : aims at finding a solution for an immediate problem facing a society or an industrial/business organization, Fundamental (to basic or pure) research: is mainly concerned with generalizations and with the formulation of a theory.")
8
(iii) Quantitative vs. Qualitative:
Quantitative research is based on the measurement of quantity or amount. Qualitative research, on the other hand, is concerned with qualitative phenomenon, i.e., phenomena relating to or involving quality or kind.

9
(iv) Conceptual vs. Empirical:
Conceptual research : is that related to some abstract idea(s) or theory. Empirical research ; It is data-based research, coming up with conclusions which are capable of being verified by observation or experiment. We can also call it as experimental type of research.
 or theory. Empirical research ; It is data-based research, coming up with conclusions which are capable of being verified by observation or experiment. We can also call it as experimental type of research.")
10
(v) Some Other Types of Research:
One-time research or longitudinal research. In the former case the research is confined to a single time-period, whereas in the latter case the research is carried on over several time-periods. Field-setting research or laboratory research or simulation research, depending upon the environment in which it is to be carried out. Clinical or diagnostic research. Such research follow case-study methods or in-depth approaches to reach the basic causal relations. Conclusion-oriented and decision-oriented. While doing conclusion-oriented research, a researcher is free to pick up a problem, redesign the enquiry as he proceeds and is prepared to conceptualize as he wishes.

11
The exploratory research or it may be formalized.
The objective of exploratory research is the development of hypotheses rather than their testing, whereas formalized research studies are those with substantial structure and with specific hypotheses to be tested. Historical research is that which utilizes historical sources like documents, remains, etc. to study events or ideas of the past, including the philosophy of persons and groups at any remote point of time.

12
Research Approaches Two basic approaches to research, viz., quantitative approach and the qualitative approach . Quantitative approach sub-classified into inferential , experimental and simulation approaches to research. Qualitative approach to research is concerned with subjective assessment of attitudes, opinionsand behavior.

13
Research Methods versus Methodology
Research methods or techniques, thus, refer to the methods the researchers use in performing research operations. Thus, when we talk of research methodology we not only talk of the research methods but also consider the logic behind the methods we use in the context of our research study and explain why we are using a particular method or technique and why we are not using others so that research results are capable of being evaluated either by the researcher himself or by others.

14
the difference between methods and techniques of data collection

15
research process guideline:
formulating the research problem; (2) extensive literature survey; (3) developing the hypothesis; (4) preparing the research design; (5) determining sample design; (6) collecting the data; (7) execution of the project; (8) analysis of data; (9) hypothesis testing; (10) generalisations and interpretation, (11) preparation of the report or presentation of the results ,i. e., formal write-up of conclusions reached.
 extensive literature survey; (3) developing the hypothesis; (4) preparing the research design; (5) determining sample design; (6) collecting the data; (7) execution of the project; (8) analysis of data; (9) hypothesis testing; (10) generalisations and interpretation, (11) preparation of the report or presentation of the results ,i. e., formal write-up of conclusions reached.")
17
1. Formulating the research problem:
There are two types of research problems, viz., those which relate to states of nature and those which relate to relationships between variables.

18
2. Extensive literature survey:
Once the problem is formulated, a brief summary of it should be written down. It is compulsory for a research worker writing a thesis for a Ph.D. degree to write a synopsis of the topic and submit it to the necessary Committee or the Research Board for approval.

19
3. Development of working hypotheses:
After extensive literature survey, researcher should state in clear terms the working hypothesis or hypotheses. Working hypothesis is tentative assumption made in order to draw out and test its logical or empirical consequences.

20
4. Preparing the research design:
The research problem having been formulated in clear cut terms, the researcher will be required to prepare a research design, i.e., he will have to state the conceptual structure within which research would be conducted. Research purposes may be grouped into four categories, viz., (i) Exploration, (ii) Description, (iii) Diagnosis, and (iv) Experimentation.
 Exploration, (ii) Description, (iii) Diagnosis, and (iv) Experimentation.")
21
There are several research designs, such as, experimental and non-experimental hypothesis testing.
Experimental designs can be either Informal designs (such as before-and-after without control, after-only with control, before-and-after with control) Formal designs (such as completely randomized design, randomized block design, Latin square design, simple and complex factorial designs), out of which the researcher must select one for his own project.
 Formal designs (such as completely randomized design, randomized block design, Latin square design, simple and complex factorial designs), out of which the researcher must select one for his own project.")
22
5. Determining sample design:
All the items under consideration in any field of inquiry constitute a ‘universe’ or ‘population’. A complete enumeration of all the items in the ‘population’ is known as a census inquiry. A brief mention of the important sample designs is as follows: (i) Deliberate sampling: Deliberate sampling is also known as purposive or non-probability sampling.
 Deliberate sampling: Deliberate sampling is also known as purposive or non-probability sampling.")
23
(ii) Simple random sampling:
This type of sampling is also known as chance sampling or probability sampling where each and every item in the population has an equal chance of inclusion in the sample and each one of the possible samples, in case of finite universe, has the same probability of being selected.

24
(iii) Systematic sampling: In some instances the most practical way of sampling is to select every 15th name on a list, every 10th house on one side of a street and so on. (iv) Stratified sampling: If the population from which a sample is to be drawn does not constitute a homogeneous group, then stratified sampling technique is applied so as to obtain a representative sample.
 Stratified sampling: If the population from which a sample is to be drawn does not constitute a homogeneous group, then stratified sampling technique is applied so as to obtain a representative sample.")
25
(v) Quota sampling: In stratified sampling the cost of taking random samples from individual strata is often so expensive that interviewers are simply given quota to be filled from different strata, the actual selection of items for sample being left to the interviewer’s judgment.

26
(vii) Multi-stage sampling:
This is a further development of the idea of cluster sampling. (viii) Sequential sampling: This is somewhat a complex sample design where the ultimate size of the sample is not fixed in advance but is determined according to mathematical decisions on the basis of information yielded as survey progresses.
 Sequential sampling: This is somewhat a complex sample design where the ultimate size of the sample is not fixed in advance but is determined according to mathematical decisions on the basis of information yielded as survey progresses.")
27
6. Collecting the data: Data can be collected by any one or more of the following ways: (i) By observation (ii) Through personal interview (iii) Through telephone interviews (iv) By mailing of questionnaires (v) Through schedules
 Through personal interview. (iii) Through telephone interviews. (iv) By mailing of questionnaires. (v) Through schedules.")
28
7. Execution of the project:
8. Analysis of data: Requires a number of closely related operations such as establishment of Categories Coding Editing Tabulation Analysis work after tabulation is generally based on the computation of various percentages, coefficients, etc., by applying various well defined statistical formulae.

29
9. Hypothesis-testing: Various tests, such as Chi square test, t-test, F-test, have been developed by statisticians for the purpose. Hypothesis-testing will result in either accepting the hypothesis or in rejecting it.

30
10. Generalisations and interpretation 11
10. Generalisations and interpretation Preparation of the report or the thesis

31
3 Research Design overall research design into the following parts: (a) the sampling design . (b) the observational design . (c) the statistical design . (d) the operational design which deals with the techniques by which the procedures specified in the sampling, statistical and observational designs can be carried out.
 the statistical design . (d) the operational design which deals with the techniques by which the procedures specified in the sampling, statistical and observational designs can be carried out.")
32
NEED FOR RESEARCH DESIGN
Research design is needed because it facilitates the smooth sailing of the various research operations, thereby making research as efficient as possible yielding maximal information with minimal expenditure of effort, time and money.

33
FEATURES OF A GOOD DESIGN
A research design appropriate for a particular research problem, usually involves the consideration of the following factors: (i) the means of obtaining information; (ii) the availability and skills of the researcher and his staff, if any. (iii) the objective of the problem to be studied. (iv) the nature of the problem to be studied. (v) the availability of time and money for the research work.
 the means of obtaining information; (ii) the availability and skills of the researcher and his staff, if any. (iii) the objective of the problem to be studied. (iv) the nature of the problem to be studied. (v) the availability of time and money for the research work.")
34
IMPORTANT CONCEPTS RELATING TO RESEARCH DESIGN
1. Dependent and independent variables: A concept which can take on different Quantitative values is called a variable. As such the concepts like weight, height, income are all examples of variables. Qualitative phenomena (or the attributes) are also quantified on the basis of the presence or absence of the concerning attribute(s). ‘continuous variables’. Age * ‘discrete variables’. sex** For instance, if we say that height depends upon age, then height is a dependent variable and age is an independent variable.
 are also quantified on the basis of the presence or absence of the concerning attribute(s). ‘continuous variables’. Age * ‘discrete variables’. sex** For instance, if we say that height depends upon age, then height is a dependent variable and age is an independent variable.")
35
2. Extraneous variable: Independent variables 3
2.Extraneous variable: Independent variables 3.Control: One important characteristic of a good research design is to minimize the influence or effect of extraneous variable(s). 4.Confounded relationship: When the dependent variable is not free from the influence of extraneous variable(s), the relationship between the dependent and independent variables is said to be confounded by an extraneous variable(s). 5.Research hypothesis: When a prediction or a hypothesized relationship is to be tested by scientific methods, it is termed as research hypothesis. The research hypothesis is a predictive statement that relates an independent variable to a dependent variable.
. 4.Confounded relationship: When the dependent variable is not free from the influence of extraneous variable(s), the relationship between the dependent and independent variables is said to be confounded by an extraneous variable(s). 5.Research hypothesis: When a prediction or a hypothesized relationship is to be tested by scientific methods, it is termed as research hypothesis. The research hypothesis is a predictive statement that relates an independent variable to a dependent variable.")
36
6.Experimental and non-experimental hypothesis-testing research: When the purpose of research is to test a research hypothesis, it is termed as hypothesis-testing research. It can be of the experimental design or of the non-experimental design.

37
7. Experimental and control groups: In an experimental hypothesis-testing research when a group is exposed to usual conditions, it is termed a ‘control group’, but when the group is exposed to some novel or special condition, it is termed an ‘experimental group’.

38
8. Treatments: The different conditions under which experimental and control groups are put are usually referred to as ‘treatments’. 9. Experiment: The process of examining the truth of a statistical hypothesis, relating to some research problem, is known as an experiment.

39
10. Experimental unit(s): The pre-determined plots or the blocks, where different treatments are used, are known as experimental units. Such experimental units must be selected (defined) very carefully.
: The pre-determined plots or the blocks, where different treatments are used, are known as experimental units. Such experimental units must be selected (defined) very carefully.")
40
DIFFERENT RESEARCH DESIGNS
Different research designs can be conveniently described if we categorize them as: (1) Exploratory research studies; Exploratory research studies are also termed as formulative research studies. (2) Descriptive And Diagnostic research studies, (((survey design ; Several methods (viz., observation, questionnaires, interviewing, examination of records, Cohort {incidence},cross sectional {prevalence}, and case-control studies etc.), Descriptive research studies are those studies which are concerned with describing the characteristics of a particular individual, or of a group, whereas diagnostic research studies determine the frequency with which something occurs or its association with something else. (3) Hypothesis-testing research studies. Hypothesis-testing research studies (generally known as experimental studies) are those where the researcher tests the hypotheses of causal relationships between variables. Such studies require procedures that will not only reduce bias and increase reliability, but will permit ; agricultural research (such as treatment, yield, plot, block etc.)
 Exploratory research studies; Exploratory research studies are also termed as formulative research studies. (2) Descriptive And Diagnostic research studies, (((survey design ; Several methods (viz., observation, questionnaires, interviewing, examination of records, Cohort {incidence},cross sectional {prevalence}, and case-control studies etc.), Descriptive research studies are those studies which are concerned with describing the characteristics of a particular individual, or of a group, whereas diagnostic research studies determine the frequency with which something occurs or its association with something else. (3) Hypothesis-testing research studies. Hypothesis-testing research studies (generally known as experimental studies) are those where the researcher tests the hypotheses of causal relationships between variables. Such studies require procedures that will not only reduce bias and increase reliability, but will permit ; agricultural research (such as treatment, yield, plot, block etc.)")
42
BASIC PRINCIPLES OF EXPERIMENTAL DESIGNS :
Professor Fisher has enumerated three principles of experimental designs: (1) the Principle of Replication; (2) the Principle of Randomization; (3) Principle of Local Control.
 the Principle of Replication; (2) the Principle of Randomization; (3) Principle of Local Control.")
43
Important Experimental Designs
(a) Informal experimental designs: (i) Before-and-after without control design. single test group or area (ii) After-only with control design. two groups or areas (test area and control area) (iii) Before-and-after with control design. two areas are selected and the dependent variable is measured in both the areas for an identical time-period before the treatment.
 Informal experimental designs: (i) Before-and-after without control design. single test group or area. (ii) After-only with control design. two groups or areas (test area and control area) (iii) Before-and-after with control design. two areas are selected and the dependent. variable is measured in both the areas for an identical time-period before the treatment.")
45
(ii) After-only with control design.
 After-only with control design.")
49
(b) Formal experimental designs:
(i) Completely randomized design (C.R. Design).Simple design. ; Involves only two principles viz., the principle of replication and the principle of randomization of experimental designs. (one-way ANOVA)* (1) Two-group simple randomized design: Population Randomly selected, Sample Randomly assigned Experimental group Treatment A & Control group reatment B (both are Independent variable) (2) Random replications design: The limitation of the two-group randomized design is usually eliminated within the random replications design.
 Completely randomized design (C.R. Design).Simple design. ; Involves only two principles viz., the principle of replication and the principle of randomization of experimental designs. (one-way ANOVA)* (1) Two-group simple randomized design: Population Randomly selected, Sample Randomly assigned Experimental group Treatment A & Control group reatment B (both are Independent variable) (2) Random replications design: The limitation of the two-group randomized design is usually. eliminated within the random replications design.")
50
(ii) Randomized block design (R. B. Design). In the R. B
(ii) Randomized block design (R.B. Design) In the R.B. design the principle of local control can be applied along with the other two principles of experimental designs. In the R.B. design, subjects are first divided into groups, known as blocks, such that within each group the subjects are relatively homogeneous in respect to some selected variable. (two-way ANOVA)*
 Randomized block design (R.B. Design). In the R.B. design the principle of local control can be applied along with the other two principles of experimental designs. In the R.B. design, subjects are first divided into groups, known as blocks, such that within each group the subjects are relatively homogeneous in respect to some selected variable. (two-way ANOVA)*")
52
(iii) Latin square design (L. S. Design)
(iii) Latin square design (L.S. Design). is an experimental design very frequently used in agricultural research. (two-way ANOVA)* (iv) Factorial designs. (a) Simple factorial designs: Simple factorial design may either be a 2 × 2 simple factorial design, or it may be, say, 3 × 4 or 5 × 3 or the like type of simple factorial design.
 Latin square design (L.S. Design). is an experimental design very frequently used in agricultural research. (two-way ANOVA)* (iv) Factorial designs. (a) Simple factorial designs: Simple factorial design may either be a 2 × 2 simple factorial design, or it may be, say, 3 × 4 or 5 × 3 or the like type of simple factorial design.")
53
(iii) l.s. design
 l.s. design")
54
(iv) Factorial designs Simple Factorial designs
 Factorial designs Simple Factorial designs")
55
The data obtained in case of two (2 × 2) simple factorial studies may be as given in Fig. 3.9.
 simple factorial studies may be as given in Fig. 3.9.")
56
2 × 2 simple factorial design

57
(4 × 3 simple factorial design).
.")
58
(b) Complex factorial designs:
Experiments with more than two factors at a time involve the use of complex factorial designs. the design used will be termed 2 × 2 × 2 complex factorial design which will contain a total of eight cells

59
Complex factorial designs:

61
CONCLUSION There are several research designs and the researcher must decide in advance of collection and analysis of data as to which design would prove to be more appropriate for his research project.

62
4 Sampling Design CENSUS AND SAMPLE SURVEY STEPS IN SAMPLE DESIGN
(i) Type of universe: (ii) Sampling unit:. Sampling unit may be a geographical one such as state, district, village, etc., or a construction unit such as house, flat, etc., or it may be a social unit such as family, club, school, etc. (iii) Source list: It is also known as ‘sampling frame’ from which sample is to be drawn. It contains the names of all items of a universe (in case of finite universe only). (iv) Size of sample: This refers to the number of items to be selected from the universe to constitute a sample. (v) Parameters of interest: the specific population parameters which are of interest. For instance, we may be interested in estimating the proportion of persons with some characteristic in the . (vi) Budgetary constraint: Cost considerations, from practical point of view, have a major impact upon decisions relating to not only the size of the sample but also to the type of sample. (vii) Sampling procedure: Finally, the researcher must decide the type of sample he will use i.e., he must decide about the technique to be used in selecting the items for the sample.
 Type of universe: (ii) Sampling unit:. Sampling unit may be a geographical one such as state, district, village, etc., or a construction unit such as house, flat, etc., or it may be a social unit such as family, club, school, etc. (iii) Source list: It is also known as ‘sampling frame’ from which sample is to be drawn. It contains the names of all items of a universe (in case of finite universe only). (iv) Size of sample: This refers to the number of items to be selected from the universe to constitute a sample. (v) Parameters of interest: the specific population parameters which are of interest. For instance, we may be interested in estimating the proportion of persons with some characteristic in the . (vi) Budgetary constraint: Cost considerations, from practical point of view, have a major impact upon decisions relating to not only the size of the sample but also to the type of sample. (vii) Sampling procedure: Finally, the researcher must decide the type of sample he will use i.e., he must decide about the technique to be used in selecting the items for the sample.")
63
Sampling errors are the random variations in the sample estimates around the true population parameters. Since they occur randomly and are equally likely to be in either direction, their nature happens to be of compensatory type and the expected value of such errors happens to be equal to zero. Sampling error decreases with the increase in the size of the sample, and it happens to be of a smaller magnitude in case of homogeneous population.

64
DIFFERENT TYPES OF SAMPLE DESIGNS
Sample designs are basically of two types viz., non-probability sampling and probability sampling. Non-probability sampling : deliberate sampling, purposive sampling and judgment sampling; ‘non-random’; Quota sampling. Probability sampling : ‘random sampling’ or ‘chance sampling’. Under this sampling design, every item of the universe has an equal chance of inclusion in the sample. Lottery method

66
HOW TO SELECT A RANDOM SAMPLE ?
Simple cases: slip of paper; random number tables; dice COMPLEX RANDOM SAMPLING DESIGNS Systematic sampling: Stratified sampling Cluster sampling: : Area sampling: Multi-stage sampling: Sampling with probability proportional to size: Sequential sampling:

67
5 Measurement and Scaling Techniques
MEASUREMENT IN RESEARCH, In our daily life we are said to measure when we use some yardstick to determine weight, height, or some other feature of a physical object.

68
MEASUREMENT SCALES From what has been stated above, we can write that scales of measurement can be considered in terms of their mathematical properties. The most widely used classification of measurement scales are (a) nominal scale; system of assigning number symbols to events in order to label them. ex-post-facto research (b) ordinalscale; The lowest level of the ordered scale that is commonly used is the ordinal scale. qualitative phenomena.
 nominal scale; system of assigning number symbols to events in order to label them. ex-post-facto research. (b) ordinalscale; The lowest level of the ordered scale that is commonly used is the ordinal scale. qualitative phenomena.")
69
(c) Interval scale: The Fahrenheit scale is an example
(c) Interval scale: The Fahrenheit scale is an example. (d) Ratio scale: Ratio scale represents the actual amounts of variables. Measures of physical dimensions such as weight, height, distance, etc. are examples.
 Interval scale: The Fahrenheit scale is an example. (d) Ratio scale: Ratio scale represents the actual amounts of variables. Measures of physical dimensions such as weight, height, distance, etc. are examples.")
70
Scale Classification Bases
(a) Subject orientation: to measure characteristics of the respondent. (b) Response form: classify the scales as categorical and comparative.Categorical scales (c) Degree of subjectivity: With this basis the scale data may be based on whether we measure subjective personal preferences or simply make non-preference (d) Scale properties: Considering scale properties, one may classify the scales as nominal, ordinal, interval and ratio scales. (e) Number of dimensions: In respect of this basis, scales can be classified as ‘one-dimensional’ and ‘multidimensional’ scales.
 Subject orientation: to measure characteristics of the respondent. (b) Response form: classify the scales as categorical and comparative.Categorical scales (c) Degree of subjectivity: With this basis the scale data may be based on whether we measure subjective personal preferences or simply make non-preference (d) Scale properties: Considering scale properties, one may classify the scales as nominal, ordinal, interval and ratio scales. (e) Number of dimensions: In respect of this basis, scales can be classified as ‘one-dimensional’ and ‘multidimensional’ scales.")
71
(f) Scale construction techniques: Following are the five main techniques by which scales can be developed. (i) Arbitrary approach: It is an approach where scale is developed on ad hoc basis. This is the most widely used approach. (ii) Consensus approach: Here a panel of judges evaluate the items chosen for inclusion in the instrument in terms of whether they are relevant to the topic area and unambiguous in implication. (iii) Item analysis approach: Under it a number of individual items are developed into a test which is given to a group of respondents. After administering the test, the total scores are calculated for every one. Individual items are then analyzed to determine which items discriminate between persons or objects with high total scores and those with low scores. (iv) Cumulative scales are chosen on the basis of their conforming to some ranking of items with ascending and descending discriminating power. For instance, in such a scale the endorsement of an item representing an extreme position should also result in the endorsement of all items indicating a less extreme position. (v) Factor scales may be constructed on the basis of inter correlations of items which indicate that a common factor accounts for the relationship between items. This relationship is typically measured through factor analysis method.
 Arbitrary approach: It is an approach where scale is developed on ad hoc basis. This is the most widely used approach. (ii) Consensus approach: Here a panel of judges evaluate the items chosen for inclusion in the instrument in terms of whether they are relevant to the topic area and unambiguous in implication. (iii) Item analysis approach: Under it a number of individual items are developed into a test which is given to a group of respondents. After administering the test, the total scores are calculated for every one. Individual items are then analyzed to determine which items discriminate between persons or objects with high total scores and those with low scores. (iv) Cumulative scales are chosen on the basis of their conforming to some ranking of items with ascending and descending discriminating power. For instance, in such a scale the endorsement of an item representing an extreme position should also result in the endorsement of all items indicating a less extreme position. (v) Factor scales may be constructed on the basis of inter correlations of items which indicate that a common factor accounts for the relationship between items. This relationship is typically measured through factor analysis method.")
73
6 Methods of Data Collection
The methods of collecting primary and secondary data differ since primary data are to be originally collected, while in case of secondary data the nature of data collection work is merely that of compilation.

75
COLLECTION OF PRIMARY DATA
Important ones are: (i) observation method, (ii) interview method, (iii) questionnaires, (iv) schedules, (v) other methods which include (a) warranty cards; (b) distributor audits; (c) pantry audits; (d) consumer panels; (e) using mechanical devices; (f) through projective techniques; (g) depth interviews, and (h) content analysis
 observation method, (ii) interview method, (iii) questionnaires, (iv) schedules, (v) other methods which include (a) warranty cards; (b) distributor audits; (c) pantry audits; (d) consumer panels; (e) using mechanical devices; (f) through projective techniques; (g) depth interviews, and (h) content analysis")
76
Observation Method The observation method is the most commonly used method specially in studies relating to behavioral sciences. Observation becomes a scientific tool and the method of data collection for the researcher, when it serves a formulated research purpose, is systematically planned and recorded and is subjected to checks and controls on validity and reliability. The main advantage of this method is that subjective bias is eliminated, if observation is done accurately. structured observation. unstructured observation. participant observation. non-participant observation. (disguised observation.)
")
77
Interview Method The interview method of collecting data involves presentation of oral-verbal stimuli and reply in terms of oral-verbal responses. This method can be used through personal interviews and, if possible, through telephone interviews.

78
DIFFERENCE BETWEEN QUESTIONNAIRES AND SCHEDULES
Both questionnaire and schedule are popularly used methods of collecting data in research surveys. There is much resemblance in the nature of these two methods and this fact has made many people to remark that from a practical point of view, the two methods can be taken to be the same But from the technical point of view there is difference between the two.

79
SOME OTHER METHODS OF DATA COLLECTION
1. Warranty cards: 2. Distributor or store audits: 3. Pantry audits: 4. Consumer panels: 5. Use of mechanical devices: 6. Projective techniques: 7. Depth interviews: 8. Content-analysis:

80
COLLECTION OF SECONDARY DATA
Secondary data means data that are already available Usually published data are available in: (a)various publications of the central, state are local government (b) various publications of foreign governments or of international bodies and their subsidiary organizations (c) technical and trade journals (d) books, magazines and newspapers (e) reports and publications of various associations connected with business and industry, banks, stock exchanges, etc. (f) reports prepared by research scholars, universities, economists, etc. in different fields; (g) public records and statistics, historical documents, and other sources of published information.
various publications of the central, state are local government (b) various publications of foreign governments or of international bodies and their subsidiary organizations (c) technical and trade journals (d) books, magazines and newspapers (e) reports and publications of various associations connected with business and industry, banks, stock exchanges, etc. (f) reports prepared by research scholars, universities, economists, etc. in different fields; (g) public records and statistics, historical documents, and other sources of published information.")
81
CASE STUDY METHOD Meaning:
The case study method is a very popular form of qualitative analysis and involves a careful and complete observation of a social unit, be that unit a person, a family, an institution, a cultural group or even the entire community.

82
7 Processing and Analysis of Data
Technically speaking, processing implies : editing, coding, classification (a) Classification according to attributes: qualitative phenomenon ; either be descriptive (such as literacy, sex, honesty, etc.) or numerical (such as weight, height, income, etc.). (b) Classification according to class-intervals: quantitative phenomenon; Data relating to income, production, age, weight, etc. come under this category Such data are known as statistics of variables and are classified on the basis of class intervals. 4. Tabulation of collected data so that they are amenable to analysis. tabulation is the process of summarizing raw data and displaying the same in compact form (i.e., in the form of statistical tables) for further analysis.
 Classification according to attributes: qualitative phenomenon ; either be descriptive (such as literacy, sex, honesty, etc.) or numerical (such as weight, height, income, etc.). (b) Classification according to class-intervals: quantitative phenomenon; Data relating to income, production, age, weight, etc. come under this category. Such data are known as statistics of variables and are classified on the basis of class intervals. 4. Tabulation of collected data so that they are amenable to analysis. tabulation is the process of summarizing raw data and displaying the same in compact form (i.e., in the form of statistical tables) for further analysis.")
83
ELEMENTS/TYPES OF ANALYSIS
Analysis may, therefore, be categorized as descriptive analysis and inferential analysis (Inferential analysis is often known as statistical analysis). “Descriptive analysis is largely the study of distributions of one variable. This study provides us with profiles of companies, work groups, persons and other subjects on any of a multiple of characteristics such as size. Composition, efficiency, preferences, etc.”. this sort of analysis may be in respect of one variable (described as unidimensional analysis), or in respect of two variables (described as bivariate analysis) or in respect of more than two variables (described as multivariate analysis). In this context we work out various measures that show the size and shape of a distribution(s) along with the study of measuring relationships between two or more variables.
. Descriptive analysis is largely the study of distributions of one variable. This study provides us with profiles of companies, work groups, persons and other subjects on any of a multiple of characteristics such as size. Composition, efficiency, preferences, etc. . this sort of analysis may be in respect of one variable (described as unidimensional analysis), or in respect of two variables (described as bivariate analysis) or in respect of more than two variables (described as multivariate analysis). In this context we work out various measures that show the size and shape of a distribution(s) along with the study of measuring relationships between two or more variables.")
84
Correlation analysis studies : the joint variation of two or more variables for determining the amount of correlation between two or more variables. Causal analysis (This analysis can be termed regression analysis. ) : is concerned with the study of how one or more variables affect changes in another variable.
 : is concerned with the study of how one or more variables affect changes in another variable.")
85
multivariate analysis
“all statistical methods which simultaneously analyze more than two variables on a sample of observations”. (a) Multiple regression analysis: one dependent variable which is presumed to be a function of two or more independent variables. The objective is to make a prediction about the dependent variable based on its covariance with all the concerned independent variables. (b) Multiple discriminant analysis: single dependent variable that cannot be measured, but can be classified into two or more groups on the basis of some attribute. The object to predict an entity’s possibility of belonging to a particular group based on several predictor variables. (c) Multivariate analysis of variance (or multi-ANOVA): This analysis is an extension of two-way ANOVA, wherein the ratio of among group variance to within group variance is worked out on a set of variables.
 Multiple regression analysis: one dependent variable which is presumed to be a function of two or more independent variables. The objective is to make a prediction about the dependent variable based on its covariance with all the concerned independent variables. (b) Multiple discriminant analysis: single dependent variable that cannot be measured, but can be classified into two or more groups on the basis of some attribute. The object to predict an entity’s possibility of belonging to a particular group based on several predictor variables. (c) Multivariate analysis of variance (or multi-ANOVA): This analysis is an extension of two-way ANOVA, wherein the ratio of among group variance to within group variance is worked out on a set of variables.")
86
STATISTICS IN RESEARCH
If fact, there are two major areas of statistics viz., descriptive statistics and inferential statistics. Descriptive statistics concern the development of certain indices from the raw data, whereas inferential statistics concern with the process of generalization. Inferential statistics are also known as sampling statistics and are mainly concerned with two major type of problems: (i) the estimation of population parameters, (ii) the testing of statistical hypotheses. The important statistical measures* that are used to summarize the survey/research data are: measures of central tendency or statistical averages; the arithmetic average or mean, median and mode. Geometric mean and harmonic mean are also sometimes used. measures of dispersion; variance, and its square root—the standard deviation are the most often used measures. Other measures such as mean deviation, range, etc. are also used. . For comparison purpose, we use mostly the coefficient of standard deviation or the coefficient of variation. measures of asymmetry (skewness and kurtosis); measures of relationship; Karl Pearson’s coefficient of correlation is the frequently used measure in case of statistics of variables, whereas Yule’s coefficient of association is used in case of statistics of attributes. Multiple correlation coefficient, partial correlation coefficient, regression analysis, etc other measures. ., Index numbers, analysis of time series, coefficient of contingency, etc., are other measures that may as well be used by a researcher, depending upon the nature of the problem under study.
 the estimation of population parameters, (ii) the testing of statistical hypotheses. The important statistical measures* that are used to summarize the survey/research data are: measures of central tendency or statistical averages; the arithmetic average or mean, median and mode. Geometric mean and harmonic mean are also sometimes used. measures of dispersion; variance, and its square root—the standard deviation are the most often used measures. Other measures such as mean deviation, range, etc. are also used. . For comparison purpose, we use mostly the coefficient of standard deviation or the coefficient of variation. measures of asymmetry (skewness and kurtosis); measures of relationship; Karl Pearson’s coefficient of correlation is the frequently used measure in case of statistics of variables, whereas Yule’s coefficient of association is used in case of statistics of attributes. Multiple correlation coefficient, partial correlation coefficient, regression analysis, etc. other measures. ., Index numbers, analysis of time series, coefficient of contingency, etc., are other measures that may as well be used by a researcher, depending upon the nature of the problem under study.")
88
8 Sampling The items so selected constitute what is technically called a sample, their selection process or technique is called sample design and the survey conducted on the basis of sample is described as sample survey.

89
SOME FUNDAMENTAL DEFINITIONS
1. Universe/Population: The population or universe can be finite or infinite. 2. Sampling frame: The elementary units or the group or cluster of such units may form the basis of sampling process in which case they are called as sampling units. 3. Sampling design: A sample design is a definite plan for obtaining a sample from the sampling frame. 4. Statisitc(s) and parameter(s): A statistic is a characteristic of a sample, whereas a parameter is a characteristic of a population.
 and parameter(s): A statistic is a characteristic of a sample, whereas a parameter is a characteristic of a population.")
90
5. Sampling error: Sample surveys do imply the study of a small portion of the population and as such there would naturally be a certain amount of inaccuracy in the information collected. The meaning of sampling error can be easily understood from the following diagram:

91
Fig. 8.1 Sampling error = Frame error + Chance error + Response

92
6. Precision: Precision is the range within which the population average (or other parameter) will lie in accordance with the reliability specified in the confidence level as a percentage of the estimate ± or as a numerical quantity. For instance, if the estimate is Rs 4000 and the precision desired is ± 4%, then the true value will be no less than Rs 3840 and no more than Rs 4160.
 will lie in accordance with the reliability specified in the confidence level as a percentage of the estimate ± or as a numerical quantity. For instance, if the estimate is Rs 4000 and the precision desired is ± 4%, then the true value will be no less than Rs 3840 and no more than Rs")
93
7. Confidence level and significance level: The confidence level or reliability is the expected percentage of times that the actual value will fall within the stated precision limits. Thus, if we take a confidence level of 95%, then we mean that there are 95 chances in 100 (or .95 in 1) that the sample results represent the true condition of the population within a specified precision range against5 chances in 100 (or .05 in 1) that it does not.
 that the sample results represent the true condition of the population within a specified precision range against5 chances in 100 (or .05 in 1) that it does not.")
94
8. Sampling distribution: We are often concerned with sampling distribution in sampling analysis. If we take certain number of samples and for each sample compute various statistical measures such as mean, standard deviation, etc., then we can find that each sample may give its own value for the statistic under consideration.

95
IMPORTANT SAMPLING DISTRIBUTIONS
Some important sampling distributions, which are commonly used, are: (1) sampling distribution of mean; (2) sampling distribution of proportion; (3) student’s ‘t’ distribution; (4) F distribution; and (5) Chi-square distribution.
 sampling distribution of mean; (2) sampling distribution of proportion; (3) student’s ‘t’ distribution; (4) F distribution; and. (5) Chi-square distribution.")
96
central limit theorem from a normal population, the means of samples drawn from such a population are themselves normally distributed. But when sampling is not from a normal population, the size of the sample plays a critical role. When n is small, the shape of the distribution will depend largely on the shape of the parent population, but as n gets large (n > 30), the thape of the sampling distribution will become more and more like a normal distribution, irrespective of the shape of the parent population.
, the thape of the sampling distribution will become more and more like a normal distribution, irrespective of the shape of the parent population.")
97
“The significance of the central limit theorem lies in the fact that it permits us to use sample statistics to make inferences about population parameters without knowing anything about the shape of the frequency distribution of that population other than what we can get from the sample.”

98
SAMPLING THEORY Sampling theory is a study of relationships existing between a population and samples drawn from the population. Sampling theory is designed to attain one or more of the following objectives: (i) Statistical estimation: The estimate can either be a point estimate or it may be an interval estimate.
 Statistical estimation: The estimate can either be a point estimate or it may be an interval estimate.")
99
(ii) Testing of hypotheses:
The second objective of sampling theory is to enable us to decide whether to accept or reject hypothesis; (iii) Statistical inference: Sampling theory helps in making generalization about the population/ universe from the studies based on samples drawn from it. It also helps in determining the accuracy of such generalizations.
 Statistical inference: Sampling theory helps in making generalization about the population/ universe from the studies based on samples drawn from it. It also helps in determining the accuracy of such generalizations.")
100
CONCEPT OF STANDARD ERROR The standard deviation
The standard deviation of sampling distribution of a statistic is known as its standard error (S.E) and is considered the key to sampling theory. The utility of the concept of standard error in statistical induction arises on account of the following reasons: 1. The (S.E) helps in testing whether the difference between observed and expected frequencies could arise due to chance The criterion usually adopted is that if a difference is less than 3 times the S.E., the difference is supposed to exist as a matter of chance and if the difference is equal to or more than 3 times the S.E., chance fails to account for it, and we conclude the difference as significant difference. This criterion is based on the fact that at X ± 3 (S.E.) the normal curve covers an area of per cent.
 and is considered the key to sampling theory. The utility of the concept of standard error in statistical induction arises on account of the following reasons: 1. The (S.E) helps in testing whether the difference between observed and expected frequencies could arise due to chance. The criterion usually adopted is that if a difference is less than 3 times the S.E., the difference is supposed to exist as a matter of chance and if the difference is equal to or more than 3 times the S.E., chance fails to account for it, and we conclude the difference as significant difference. This criterion is based on the fact that at X ± 3 (S.E.) the normal curve covers an area of per cent.")
101
2. The standard error gives an idea about the reliability and precision of a sample The smaller the S.E., the greater the uniformity of sampling distribution and hence, greater is the reliability of sample. Conversely, the greater the S.E., the greater the difference between observed and expected frequencies. In such a situation the unreliability of the sample is greater.

102
3. The standard error enables us to specify the limits within which the parameters of the population are expected to lie with a specified degree of confidence. Such an interval is usually known as confidence interval.

103
ESTIMATION In most statistical research studies, population parameters are usually unknown and have to be estimated from a sample.

104
sample size and its detemination
In sampling analysis the most ticklish question what should be the size of the sample or how large or small should be ‘n’? If the sample size (‘n’) is too small, it may not serve to achieve the objectives and if it is too large, we may incur huge cost and waste resources.
 is too small, it may not serve to achieve the objectives and if it is too large, we may incur huge cost and waste resources.")
105
DETERMINATION OF SAMPLE SIZE THROUGH THE APPROACH BASED ON PRECISION RATE & CONFIDENCE LEVEL
To begin with, it can be stated that whenever a sample study is made, there arises some sampling error which can be controlled by selecting a sample of adequate size.

106
9 Testing of Hypotheses I (Parametric or Standard Tests of Hypotheses)
Hypothesis is usually considered as the principal instrument in and research. Ordinarily, when one talks about hypothesis, one simply means a mere assumption or some supposition to be proved or disproved But for a researcher hypothesis is a formal question that he intends

107
“Students who receive counseling will show a greater increase in creativity than students not receiving counselling” Or “the automobile A is performing as well as automobile B.” These are hypotheses capable of being objectively verified and tested.

108
Characteristics of hypothesis:
Hypothesis must possess the following characteristics: Hypothesis should be clear and precise. (ii) Hypothesis should be capable of being tested. (iii) Hypothesis should state relationship between variables, if it happens to be a relational hypothesis. (iv) Hypothesis should be limited in scope and must be specific. (v) Hypothesis should be stated as far as possible in most simple terms (vi) Hypothesis should be consistent with most known facts (vii) Hypothesis should be amenable to testing within a reasonable time. (viii) Hypothesis must explain the facts that gave rise to the need for explanation.
 Hypothesis should be capable of being tested. (iii) Hypothesis should state relationship between variables, if it happens to be a relational hypothesis. (iv) Hypothesis should be limited in scope and must be specific. (v) Hypothesis should be stated as far as possible in most simple terms. (vi) Hypothesis should be consistent with most known facts. (vii) Hypothesis should be amenable to testing within a reasonable time. (viii) Hypothesis must explain the facts that gave rise to the need for explanation.")
109
BASIC CONCEPTS CONCERNING TESTING OF HYPOTHESES
(a) Null hypothesis and alternative hypothesis
 Null hypothesis and alternative hypothesis.")
110
possible alternative hypothesis

111
b) The level of significance:
This is a very important concept in the context of hypothesis testing It is always some percentage (usually 5%) which should be chosen wit great care, thought and reason.
 which should be chosen wit great care, thought and reason.")
112
(c) Decision rule or test of hypothesis: Given a hypothesis H0 and an alternative hypothesis Ha,
we make a rule which is known as decision rule according to which we accept H0 (i.e., reject Ha) or reject H0 (i.e., accept Ha).
 or reject H0 (i.e., accept Ha).")
113
Acceptance and rejection regions in case of a two-tailed test (with 5% significance level)
")
114
PROCEDURE FOR HYPOTHESIS TESTING
the main question is: whether to accept the null hypothesis or not to accept the null hypothesis? Procedure for hypothesis testing refers to all those steps that we undertake for making a choice between the two actions i.e., rejection and acceptance of a null hypothesis The various steps involved in hypothesis testing are stated below: (i) Making a formal statement: The step consists : null hypothesis is H0 : m = 10 tons Alternative Hypothesis Ha: m > 10 tons (ii) Selecting a significance level: (iii) Deciding the distribution to use: (iv) Selecting a random sample and computing an appropriate value (vi) Comparing the probability: Yet another step consists in comparing the probability thus calculated with the specified value for a , the significance level.
 Making a formal statement: The step consists : null hypothesis is H0 : m = 10 tons. Alternative Hypothesis Ha: m > 10 tons. (ii) Selecting a significance level: (iii) Deciding the distribution to use: (iv) Selecting a random sample and computing an appropriate value. (vi) Comparing the probability: Yet another step consists in comparing the probability thus calculated with the specified value for a , the significance level.")
115
FLOW DIAGRAM FOR HYPOTHESIS TESTING

116
TESTS OF HYPOTHESES classified as:
(a) Parametric tests or standard tests of hypotheses; (1) z-test; (2) t-test; x2-test, and (4) F-test. All these tests are based on the assumption of normality i.e., the source of data is considered to be normally distributed. (b) Non-parametric tests or distribution-free test of hypotheses.
 Parametric tests or standard tests of hypotheses; (1) z-test; (2) t-test; x2-test, and (4) F-test. All these tests are based on the assumption of normality i.e., the source of data is considered to be normally distributed. (b) Non-parametric tests or distribution-free test of hypotheses.")
117
10 Chi-Square Test Chi-square, symbolically written as c2 (Pronounced as Ki-square), is a statistical measure used in the context of sampling analysis for comparing a variance to a theoretical variance. As a non-parametric test, it “can be used to determine if categorical data shows dependency or the two classifications are independent. It can also be used to make comparisons between theoretical populations and actual data when categories are used.”
, is a statistical measure used in the context of sampling analysis for comparing a variance to a theoretical variance. As a non-parametric test, it can be used to determine if categorical data shows dependency or the two classifications are independent. It can also be used to make comparisons between theoretical populations and actual data when categories are used.")
118
The test is, in fact, a technique through the use of which it is possible for all researchers to
(i) test the goodness of fit; (ii) test the significance of association between two attributes, and (iii) test the homogeneity or the significance of population variance.
 test the goodness of fit; (ii) test the significance of association between two attributes, and. (iii) test the homogeneity or the significance of population variance.")
119
chi-square can be used (i) as a test of goodness of fit and (ii) as a test of independence.
 as a test of goodness of fit and (ii) as a test of independence.")
120
No group should contain very few items, say less than 10. I
n case where the frequencies are less than 10, regrouping is done by combining the frequencies of adjoining groups so that the new frequencies become greater than 10. Some statisticians take this number as 5, but 10 is regarded as better by most of the statisticians.

121
11 Analysis of Variance and Co-variance
ANALYSIS OF VARIANCE (ANOVA) ANOVA is essentially a procedure for testing the difference among different groups of data for homogeneity.
 ANOVA is essentially a procedure for testing the difference among different groups of data for homogeneity.")
122
12 Testing of Hypotheses-II (Nonparametric or Distribution-free Tests)
are important and generally used: (i) one-sample sign test. (ii) two-sample sign test, Fisher-Irwin test, Rank sum test, etc. (iii) Rank correlation, Kendall’s coefficient of concordance and other tests for dependence. (iv) test analogous to ANOVA viz., Kruskal-Wallis test. (v) Tests of randomness of a sample based on the theory of runs viz., one sample runs test.
 one-sample sign test. (ii) two-sample sign test, Fisher-Irwin test, Rank sum test, etc. (iii) Rank correlation, Kendall’s coefficient of concordance and other tests for dependence. (iv) test analogous to ANOVA viz., Kruskal-Wallis test. (v) Tests of randomness of a sample based on the theory of runs viz., one sample runs test.")
123
13 Multivariate Analysis Techniques All statistical
Of late, multivariate techniques have emerged as a powerful tool to analyze data represented in terms of many variables. The main reason being that a series of univariate analysis carried out separately for each variable may, at times, lead to incorrect interpretation of the result.

124
Thus, we have two types of multivariate techniques: one type for data containing both dependent and independent variables, and the other type for data containing several variables without dependency relationship.

125
14 Interpretation and Report Writing After collecting and analyzing
DIFFERENT STEPS IN WRITING REPORT Research reports are the product of slow, painstaking, accurate inductive work. The usual steps involved in writing report are: (a) logical analysis of the subject-matter; (b) preparation of the final outline; (c) preparation of the rough draft; (d) rewriting and polishing; (e) preparation of the final bibliography; (f) writing the final draft. Though all these steps are self explanatory, yet a brief mention of each one of these will be appropriate for better understanding.
 logical analysis of the subject-matter; (b) preparation of the final outline; (c) preparation of the rough draft; (d) rewriting and polishing; (e) preparation of the final bibliography; (f) writing the final draft. Though all these steps are self explanatory, yet a brief mention of each one of these will be appropriate for better understanding.")
126
TYPES OF REPORTS ,Research reports
(A) Technical Report In the technical report the main emphasis is on (i) the methods employed, (it) assumptions made in the course of the study, (iii) the detailed presentation of the findings including their limitations and supporting data. A general outline of a technical report can be as follows: 1. Summary of results: A brief review of the main findings just in two or three pages. 2. Nature of the study: Description of the general objectives of study, formulation of the problem in operational terms, the working hypothesis, the type of analysis and data required, etc. 3. Methods employed: Specific methods used 4. Data: Discussion of data collected, their sources, characteristics and limitations. If secondary 5. Analysis of data and presentation of findings: The analysis of data and presentation of the findings of the study with supporting data in the form of tables and charts be fully narrated. This, in fact, happens to be the main body of the report usually extending over several chapters. 6. Conclusions: A detailed summary of the findings and the policy implications drawn from the results be explained. 7. Bibliography: Bibliography of various sources consulted be prepared and attached. 8. Technical appendices: Appendices be given for all technical matters relating to questionnaire, mathematical derivations, elaboration on particular technique of analysis and the like ones. 9. Index:
 Technical Report. In the technical report the main emphasis is on (i) the methods employed, (it) assumptions made in the course of the study, (iii) the detailed presentation of the findings including their limitations and supporting data. A general outline of a technical report can be as follows: 1. Summary of results: A brief review of the main findings just in two or three pages. 2. Nature of the study: Description of the general objectives of study, formulation of the problem in. operational terms, the working hypothesis, the type of analysis and data required, etc. 3. Methods employed: Specific methods used. 4. Data: Discussion of data collected, their sources, characteristics and limitations. If secondary. 5. Analysis of data and presentation of findings: The analysis of data and presentation of the. findings of the study with supporting data in the form of tables and charts be fully narrated. This, in. fact, happens to be the main body of the report usually extending over several chapters. 6. Conclusions: A detailed summary of the findings and the policy implications drawn from the. results be explained. 7. Bibliography: Bibliography of various sources consulted be prepared and attached. 8. Technical appendices: Appendices be given for all technical matters relating to questionnaire, mathematical derivations, elaboration on particular technique of analysis and the like ones. 9. Index:")
127
(B) Popular Report The popular report is one which gives emphasis on simplicity and attractiveness. We give below a general outline of a popular report. 1. The findings and their implications: Emphasis in the report is given on the findings of most practical interest and on the implications of these findings. 2. Recommendations for action: Recommendations for action on the basis of the findings of the study is made in this section of the report. 3. Objective of the study: A general review of how the problem arise is presented along with the specific objectives of the project under study. 4. Methods employed: A brief and non-technical description of the methods and techniques used, including a short review of the data on which the study is based, is given in this part of the report. 5. Results: This section constitutes the main body of the report wherein the results of the study are presented in clear and non-technical terms with liberal use of all sorts of illustrations such as charts, diagrams and the like ones. 6. Technical appendices: More detailed information on methods used, forms, etc. is presented in the form of appendices. But the appendices are often not detailed if the report is entirely meant for general public.

128
15 The Computer: Its Role in Research
The Computer is of the most versatile and ingenious developments of the modern technological age. Today people use computers in almost every walk of life.

130
Selected References and Recommended Readings
1. Ackoff, Russell L., The Design of Social Research, Chicago: University of Chicago Press, 1961. 2. Ackoff, Russell L., Scientific Method, New York: John Wiley & Sons, 1962. 3. Allen, T. Harrell, New Methods in Social Science Research, New York: Praeger Publishers, 1978. 4. Anderson, H.H., and Anderson, G.L., An Introduction to Projective Techniques and Other Devices for Understanding the Dynamics of Human Behaviour, New York: Prentice Hall, 1951. 5. Anderson, T.W., An Introduction to Multivariate Analysis, New York: John Wiley & Sons, 1958. 6. Bailey, Kenneth D., “Methods of Social Research,” New York, 1978. 7. Baker, R.P., and Howell, A.C., The Preparation of Reports, New York: Ronald Press, 1938. 8. Bartee, T.C., “Digital Computer Fundamentals,” 5th Ed., McGraw-Hill, International Book Co., 1981. 9. Barzun, Jacques, and Graff, Henery, F., The Modern Researcher, rev. ed., New York: Harcourt, Brace & World, Inc., 1970. 10. Bell, J.E., Projective Techniques: A. Dynamic Approach to the Study of Personality, New York: Longmans Green, 1948. 11. Bellenger, Danny N., and Greenberg, Barnett A., Marketing Research—A Management Information Approach, Homewood, Illinois: Richard D. Irwin, Inc., 1978. 12. Berdie, Douglas R., and Anderson, John F., Questionnaires: Design and Use, Metuchen N.J.: The Scarecrow Press, Inc., 1974. 13. Berelson, Bernard, Content Analysis in Communication Research, New York: Free Press, 1952. 14. Berenson, Conard, and Colton, Raymond, Research and Report Writing for Business and Economics, New York: Random House, 1971. 15. Best, John W., and Kahn, James V., “Research in Education,” 5th Ed., New Delhi: Prentice-Hall of India Pvt. Ltd., 1986. 16. Bhattacharya, Srinibas, Psychometrics & Behavioural Research, New Delhi: Sterling Publishers Pvt. Ltd., 1972. 17. Boot, John C.G., and Cox, Edwin B., Statistical Analysis for Managerial Decisions, 2nd ed. New Delhi: McGraw-Hill Publishing Co. Ltd., (International Student Edition), 1979. 18. Bowley, A.L., Elements of Statistics, 6th ed. London: P.S. King and Staples Ltd., 1937.
, Bowley, A.L., Elements of Statistics, 6th ed. London: P.S. King and Staples Ltd.,")
131
19. Burgess, Ernest W., “Research Methods in Sociology” in Georges Gurvitch and W.E. Moore (Ed.),
Twentieth Century Sociology, New York: New York Philosophical Library, 1949. 20. Chance, William A., Statistical Methods for Decision Making, Bombay: D.B. Taraporevala Sons & Co. Pvt. Ltd., 1975. 21. Chaturvedi, J.C., Mathematical Statistics, Agra: Nok Jhonk Karyalaya, 1953. 22. Chou, Ya-Lun, Statistical Analysis with Business and Economic Applications, 2nd ed. New York: Holt, Rinehart & Winston, 1974. 23. Clover, Vernon T., and Balsley, Howard L., Business Research Methods, Columbus, O.: Grid, Inc., 1974. 24. Cochran, W.G., Sampling Techniques, 2nd ed. New York: John Wiley & Sons., 1963. 25. Cooley, William W., and Lohnes, Paul R., Multivariate Data Analysis, New York: John Wiley & Sons., 1971. 26. Croxton, F.E., Cowden, D.J., and Klein, S., Applied General Statistics, 3rd ed., New Delhi: Prentice-Hall of India Pvt. Ltd., 1975. 27. Dass, S.L., Personality Assessment Through Projective Movie Pictures, New Delhi: S. Chand & Co. (Pvt.) Ltd., 1974. 28. Davis, G.B., “Introduction to Computers,” 3rd ed., McGraw-Hill International Book Co., 1981. 29. Deming, W. Edwards., Sample Design in Business Research, New York: John Wiley & Sons., Inc., 1960. 30. Dennis, Child, The Essentials of Factor Analysis, New York: Holt, Rinehart and Winston, 1973. 31. Denzin, Norman, The Research Act, Chicago: Aldine, 1973. 32. Edwards, Allen, Statistical Methods, 2nd ed., New York: Holt, Rinehart & Winston, 1967. 33. Edwards, Allen L., Techniques of Attitude Scale Construction, New York: Appleton-Century-Crofts, 1957. 34. Emory, C. William, Business Research Methods, Illinois: Richard D. Irwin, Inc. Homewood, 1976. 35. Ferber, Robert (ed.), Handbook of Marketing Research, New York: McGraw-Hill, Inc., 1948. 36. Ferber, R., and Verdoorn, P.J., Research Methods in Economics and Business, New York: The Macmillan Company, 1962. 37. Ferguson, George A., Statistical Analysis in Psychology and Education, 4th ed., New York: McGraw- Hill Book Co., Inc., 1959. 38. Festinger, Leon and Katz, Daniel (Eds.), Research Methods in the Behavioral Sciences, New Delhi: Amerind Publishing Co. Pvt. Ltd., Fourth Indian Reprint, 1976. 39. Fiebleman, J.K., Scientific Method, Netherlands: Martinus Nijhoff, The Hague, 1972. 40. Fisher, R.A., Statistical Methods for Research Workers, 13th ed., New York: Hafner Publishing Co., 1958. 41. Fisher, R.A., The Design of Experiments, 7th rev. ed., New York: Hafner Publishing Co., 1960. 42. Fox, James Harold, Criteria of Good Research, Phi Delta Kappa, Vol. 39 (March 1958). 43. Freedman, P., The Principles of Scientific Research, 2nd ed., New York: Pergamon Press, 1960. 44. Fruchter, Benjamin, Introduction to Factor Analysis, Princeton, N.J.: D.Van Nostrand, 1954. 45. Gatner, Elliot S.M., and Cordasco, Francesco, Research and Report Writing, New York: Barnes & Noble, Inc., 1956. 46. Gaum, Carl G., Graves, Harod F., and Hoffman, Lyne, S.S., Report Writing, 3rd ed., New York: Prentice-Hall, 1950. 47. Ghosh, B.N., Scientific Methods and Social Research, New Delhi: Sterling Publishers Pvt. Ltd., 1982. 48. Gibbons, J.D., Nonparametric Statistical Inference, Tokyo: McGraw-Hill Kogakusha Ltd., (International Student Edition), 1971.
 Ltd., Davis, G.B., Introduction to Computers, 3rd ed., McGraw-Hill International Book Co., Deming, W. Edwards., Sample Design in Business Research, New York: John Wiley & Sons., Inc., Dennis, Child, The Essentials of Factor Analysis, New York: Holt, Rinehart and Winston, Denzin, Norman, The Research Act, Chicago: Aldine, Edwards, Allen, Statistical Methods, 2nd ed., New York: Holt, Rinehart & Winston, Edwards, Allen L., Techniques of Attitude Scale Construction, New York: Appleton-Century-Crofts, Emory, C. William, Business Research Methods, Illinois: Richard D. Irwin, Inc. Homewood, Ferber, Robert (ed.), Handbook of Marketing Research, New York: McGraw-Hill, Inc., Ferber, R., and Verdoorn, P.J., Research Methods in Economics and Business, New York: The Macmillan. Company, Ferguson, George A., Statistical Analysis in Psychology and Education, 4th ed., New York: McGraw- Hill Book Co., Inc., Festinger, Leon and Katz, Daniel (Eds.), Research Methods in the Behavioral Sciences, New Delhi: Amerind Publishing Co. Pvt. Ltd., Fourth Indian Reprint, Fiebleman, J.K., Scientific Method, Netherlands: Martinus Nijhoff, The Hague, Fisher, R.A., Statistical Methods for Research Workers, 13th ed., New York: Hafner Publishing Co., Fisher, R.A., The Design of Experiments, 7th rev. ed., New York: Hafner Publishing Co., Fox, James Harold, Criteria of Good Research, Phi Delta Kappa, Vol. 39 (March 1958). 43. Freedman, P., The Principles of Scientific Research, 2nd ed., New York: Pergamon Press, Fruchter, Benjamin, Introduction to Factor Analysis, Princeton, N.J.: D.Van Nostrand, Gatner, Elliot S.M., and Cordasco, Francesco, Research and Report Writing, New York: Barnes & Noble, Inc., Gaum, Carl G., Graves, Harod F., and Hoffman, Lyne, S.S., Report Writing, 3rd ed., New York: Prentice-Hall, Ghosh, B.N., Scientific Methods and Social Research, New Delhi: Sterling Publishers Pvt. Ltd., Gibbons, J.D., Nonparametric Statistical Inference, Tokyo: McGraw-Hill Kogakusha Ltd., (International. Student Edition),")
132
49. Giles, G. B. , Marketing, 2nd ed. , London: Macdonald & Evans Ltd
50. Glock, Charles Y., Survey Research in the Social Sciences, New York: Russell Sage Foundation, 1967. 51. Godfrey, Arthur, Quantitative Methods for Managers, London: Edward Arnold (Publishers) Ltd., 1977. 52. Good, Carter V., and Douglas, E. Scates, Methods of Research—Educational, Psychological, Sociological, New York: Appleton-Century-Crofts, Inc., 1954. 53. Goode, William J., and Hatt, Paul K., Methods in Social Research, New York: McGraw-Hill, 1952. 54. Gopal, M.H., An Introduction to Research Procedure in Social Sciences, Bombay: Asia Publishing House, 1964. 55. Gopal, M.H., Research Reporting in Social Sciences, Dharwar: Karnatak University, 1965. 56. Gorden, Raymond L., Interviewing: Strategy, Techniques and Tactics, rev. ed., Homewood, Ill.: Dorsey Press, 1975. 57. Green, Paul E., Analyzing Multivariate Data, Hinsdale, Ill.: Dryden Press, 1978. 58. Green, Paul E., and Carmone, F.J., Multidimensional Scaling in Marketing Analysis, Boston: Allyn & Bacon, Inc., 1970. 59. Guilford, J.P., Psychometric Methods, New York: McGraw Hill, Inc., 1954. 60. Harnett, Donald L., and Murphy, James L., Introductory Statistical Analysis, Philippines: Addison- Wesley Publishing Co., Inc., 1975. 61. Hillway, T., Introduction to Research, 2nd ed., Boston: Houghton Mifflin, 1964. 62. Hollander, Myles, and Wolfe, Douglas A., Nonparametric Statistical Methods, New York: John Wiley, 1973. 63. Hunt, R., and Shelley, J., “Computers and Common Sense,” 3rd ed., New Delhi: Prentice-Hall of India Ltd., 1984. 64. Hyman, Herbert H., et al., Interviewing in Social Research, Chicago: University of Chicago Press, 1975. 65. John, Peter W.M., Statistical Design and Analysis of Experiments, New York: The Macmillan Co., 1971. 66. Johnson, Ellen, The Research Report: A Guide for the Beginner, New York: Ronald Press, 1951. 67. Johnson, Rodney D., and Siskin, Bernard R., Quantitative Techniques for Business Decisions, New Delhi: Prentice-Hall of India Pvt. Ltd., 1977. 68. Kahn, Robert L. and Cannell, Charles F., The Dynamics of Interviewing, New York: John Wiley & Sons, 1957. 69. Karson, Marvin J., Multivariate Statistical Methods, Ames, Iowa: The Iowa State University Press, 1982. 70. Kendall, M.G., A Course in Multivariate Analysis, London, Griffin, 1961. 71. Kerlinger, Fred N. and Pedhazur, Elazar J., Multiple Regression in Behavioral Research, New York: Holt, Rinehart and Winston, 1973. 72. Kerlinger, Fred N., Foundations of Behavioral Research, 2nd ed., New York: Holt, Reinhart and Winston, 73. Kish, Leslie., Survey Sampling, New York: John Wiley & Sons, Inc., 1965. 74. Kothari, C.R., Quantitative Techniques, 2nd ed., New Delhi: Vikas Publishing House Pvt. Ltd., 1984. Kothari, C.R., Methods and Techniques, 2nd ed., New Age International (P) Ltd, 75. Lastrucci, Carles L., The Scientific Approach: Basic Principles of the Scientific Method, Cambridge, Mass.: Schenkman Publishing Co., Inc., 1967. 76. Lazersfeld, Paul F., “Evidence and Inference in Social Research,” in David Lerher, Evidence and Inference, Glencoe: The Free Press, 1950. 77. Leonard Schatzman, and Anselm L. Strauss, Field Research, New Jersey: Prentice-Hall Inc., 1973. 78. Levin, Richard I., Statistics for Management, New Delhi: Prentice-Hall of India Pvt. Ltd., 1979.
 Ltd., Good, Carter V., and Douglas, E. Scates, Methods of Research—Educational, Psychological, Sociological, New York: Appleton-Century-Crofts, Inc., Goode, William J., and Hatt, Paul K., Methods in Social Research, New York: McGraw-Hill, Gopal, M.H., An Introduction to Research Procedure in Social Sciences, Bombay: Asia Publishing. House, Gopal, M.H., Research Reporting in Social Sciences, Dharwar: Karnatak University, Gorden, Raymond L., Interviewing: Strategy, Techniques and Tactics, rev. ed., Homewood, Ill.: Dorsey. Press, Green, Paul E., Analyzing Multivariate Data, Hinsdale, Ill.: Dryden Press, Green, Paul E., and Carmone, F.J., Multidimensional Scaling in Marketing Analysis, Boston: Allyn & Bacon, Inc., Guilford, J.P., Psychometric Methods, New York: McGraw Hill, Inc., Harnett, Donald L., and Murphy, James L., Introductory Statistical Analysis, Philippines: Addison- Wesley Publishing Co., Inc., Hillway, T., Introduction to Research, 2nd ed., Boston: Houghton Mifflin, Hollander, Myles, and Wolfe, Douglas A., Nonparametric Statistical Methods, New York: John Wiley, Hunt, R., and Shelley, J., Computers and Common Sense, 3rd ed., New Delhi: Prentice-Hall of India Ltd., Hyman, Herbert H., et al., Interviewing in Social Research, Chicago: University of Chicago Press, John, Peter W.M., Statistical Design and Analysis of Experiments, New York: The Macmillan Co., Johnson, Ellen, The Research Report: A Guide for the Beginner, New York: Ronald Press, Johnson, Rodney D., and Siskin, Bernard R., Quantitative Techniques for Business Decisions, New. Delhi: Prentice-Hall of India Pvt. Ltd., Kahn, Robert L. and Cannell, Charles F., The Dynamics of Interviewing, New York: John Wiley & Sons, Karson, Marvin J., Multivariate Statistical Methods, Ames, Iowa: The Iowa State University Press, Kendall, M.G., A Course in Multivariate Analysis, London, Griffin, Kerlinger, Fred N. and Pedhazur, Elazar J., Multiple Regression in Behavioral Research, New York: Holt, Rinehart and Winston, Kerlinger, Fred N., Foundations of Behavioral Research, 2nd ed., New York: Holt, Reinhart and Winston, 73. Kish, Leslie., Survey Sampling, New York: John Wiley & Sons, Inc., Kothari, C.R., Quantitative Techniques, 2nd ed., New Delhi: Vikas Publishing House Pvt. Ltd., Kothari, C.R., Methods and Techniques, 2nd ed., New Age International (P) Ltd, Lastrucci, Carles L., The Scientific Approach: Basic Principles of the Scientific Method, Cambridge, Mass.: Schenkman Publishing Co., Inc., Lazersfeld, Paul F., Evidence and Inference in Social Research, in David Lerher, Evidence and Inference, Glencoe: The Free Press, Leonard Schatzman, and Anselm L. Strauss, Field Research, New Jersey: Prentice-Hall Inc., Levin, Richard I., Statistics for Management, New Delhi: Prentice-Hall of India Pvt. Ltd.,")
133
79. Levine, S. and Elzey, Freeman F
79. Levine, S. and Elzey, Freeman F., A Programmed Introduction to Research, California: Wods Worth Publishing Co., 1968. 80. Maranell, Gary M. (ed.), Scaling: A Source Book for Behavioral Scientists, Chicago: Aldine, 1974. 81. Maxwell, Albert E., Analyzing Qualitative Data, New York: John Wiley & Sons, 1961. 82. Meadows, R., and Parsons, A.J., “Microprocessors: Essentials, Components and Systems,” Pitman, 1983. 83. Meir, Robert C., Newell, William T., and Dazier, Harold L., Simulation in Business and Economics, Englewood Cliffs, N.J: Prentice Hall, Inc., 1969. 84. Miller, Delbert C., Handbook of Research Design & Social Measurement, 3rd ed., New York: David Mckay Company, Inc., 1977. 85. Moroney, M.J., Facts from Figures, Baltimore: Penguin Books, 1956. 86. Morrison, Donald F., Multivariate Statistical Methods, New York: McGraw-Hill, 1967. 87. Nagel, Stuart S., and Neef, Marian, Policy Analysis in Social Science Research, London: Sage Publications, 1979. 88. Nie, N.H., Bent, D.H., and Hull, C.H., Statistical Package for the Social Sciences, New York: McGraw- Hill, 1970. 89. Noether, G.E., Elements of Nonparametric Statistics, New York: John Wiley & Sons, Inc., 1967. 90. Nunnally, Jum C., Psychometric Theory, 2nd ed., New York: McGraw-Hill, 1978. 91. Odum, H.W., and Jocher, Katharine, An Introduction to Social Research, New York: Henry Holt and Co., 1929. 92. Oppenheim, A.N., Questionnaire Design and Attitude Measurement, New York: Basic Books, 1966. 93. Ostle, Bernard, and Mensing, Richard W., Statistics in Research, 3rd ed., Ames Iowa: The Iowa State University Press, 1975. 94. Payne, Stanley, The Art of Asking Questions, Princeton: Princeton University Press, 1951. 95. Pearson, Karl, The Grammar of Science, New York: Meridian Books, Inc., 1957. 96. Phillips, Bernard S., Social Research, Strategy and Tactics, 2nd ed., New York: The Macmillan Company, 1971. 97. Piaget, Jean, Main Trends in Interdisciplinary Research, London: George Allen and Unwin Ltd., 1973. 98. Popper, Karl R., The Logic of Scientific Discovery, New York: Basic Books, 1959. 99. Rajaraman, V., “Fundamentals of Computers,” New Delhi: Prentice-Hall of India Pvt. Ltd., 1985. 100. Ramchandran, P., Training in Research Methodology in Social Sciences in India, New Delhi: ICSSR 101. Redman, L.V., and Mory, A.V.H., The Romance of Research, 1923. 102. Roscoe, John T., Fundamental Research Statistics for the Behavioral Sciences, New York: Holt, Rinehart and Winston, Inc., 1969. 103. Runyon, Richard P., Inferential Statistics, Philippines: Addison-Wesley Publishing Company, Inc., 1977. 104. Sadhu, A.N., and Singh, Amarjit, Research Methodology in Social Sciences, Bombay: Himalaya Publishing House, 1980. 105. Seboyar, G.E., Manual for Report and Thesis Writing, New York: F.S. Crofts & Co., 1929. 106. Selltiz, Claire: Jahoda, Marie, Deutsch, Morton, and Cook, Stuart W., Research Methods in Social Relations, rev. ed. New York: Holt, Rinehart and Winston, Inc., 1959. 107. Sharma, B.A.V., et al., Research Methods in Social Sciences, New Delhi: Sterling Publishers Pvt. Ltd., 1983. 108. Sharma, H.D., and Mukherji, S.P., Research in Economics and Commerce, Methodology and Surveys, Varanasi: Indian Biographic Centre, 1976.
, Scaling: A Source Book for Behavioral Scientists, Chicago: Aldine, Maxwell, Albert E., Analyzing Qualitative Data, New York: John Wiley & Sons, Meadows, R., and Parsons, A.J., Microprocessors: Essentials, Components and Systems, Pitman, Meir, Robert C., Newell, William T., and Dazier, Harold L., Simulation in Business and Economics, Englewood Cliffs, N.J: Prentice Hall, Inc., Miller, Delbert C., Handbook of Research Design & Social Measurement, 3rd ed., New York: David. Mckay Company, Inc., Moroney, M.J., Facts from Figures, Baltimore: Penguin Books, Morrison, Donald F., Multivariate Statistical Methods, New York: McGraw-Hill, Nagel, Stuart S., and Neef, Marian, Policy Analysis in Social Science Research, London: Sage Publications, Nie, N.H., Bent, D.H., and Hull, C.H., Statistical Package for the Social Sciences, New York: McGraw- Hill, Noether, G.E., Elements of Nonparametric Statistics, New York: John Wiley & Sons, Inc., Nunnally, Jum C., Psychometric Theory, 2nd ed., New York: McGraw-Hill, Odum, H.W., and Jocher, Katharine, An Introduction to Social Research, New York: Henry Holt and Co., Oppenheim, A.N., Questionnaire Design and Attitude Measurement, New York: Basic Books, Ostle, Bernard, and Mensing, Richard W., Statistics in Research, 3rd ed., Ames Iowa: The Iowa State. University Press, Payne, Stanley, The Art of Asking Questions, Princeton: Princeton University Press, Pearson, Karl, The Grammar of Science, New York: Meridian Books, Inc., Phillips, Bernard S., Social Research, Strategy and Tactics, 2nd ed., New York: The Macmillan Company, Piaget, Jean, Main Trends in Interdisciplinary Research, London: George Allen and Unwin Ltd., Popper, Karl R., The Logic of Scientific Discovery, New York: Basic Books, Rajaraman, V., Fundamentals of Computers, New Delhi: Prentice-Hall of India Pvt. Ltd., Ramchandran, P., Training in Research Methodology in Social Sciences in India, New Delhi: ICSSR Redman, L.V., and Mory, A.V.H., The Romance of Research, Roscoe, John T., Fundamental Research Statistics for the Behavioral Sciences, New York: Holt, Rinehart. and Winston, Inc., Runyon, Richard P., Inferential Statistics, Philippines: Addison-Wesley Publishing Company, Inc., Sadhu, A.N., and Singh, Amarjit, Research Methodology in Social Sciences, Bombay: Himalaya Publishing. House, Seboyar, G.E., Manual for Report and Thesis Writing, New York: F.S. Crofts & Co., Selltiz, Claire: Jahoda, Marie, Deutsch, Morton, and Cook, Stuart W., Research Methods in Social. Relations, rev. ed. New York: Holt, Rinehart and Winston, Inc., Sharma, B.A.V., et al., Research Methods in Social Sciences, New Delhi: Sterling Publishers Pvt. Ltd., Sharma, H.D., and Mukherji, S.P., Research in Economics and Commerce, Methodology and Surveys, Varanasi: Indian Biographic Centre,")
134
109. Siegel, S., Nonparametric Statistics for the Behavioral Sciences, New York: McGraw-Hill Publishing Co., Inc., 1956. 110. Subramanian, N., “Introduction to Computers,” New Delhi: Tata McGraw-Hill Publishing Co. Ltd., 1986. 111. Summers, Gene F., (Ed.), Attitude Measurement, Chicago: Rand McNally & Co., 1970. 112. Takeuchi, K., Yanai, H. and Mukherjee, B.N., The Foundations of Multivariate Analysis, New Delhi: Wiley Eastern Ltd., 1982. 113. Tandon, B.C., Research Methodology in Social Sciences, Allahabad: Chaitanya Publishing House, 1979. 114. Thorndike, Robert L. and Hagen, Elizabeth P., Measurement and Evaluation in Psychology and Education, 4th ed., New York: John Wiley & Sons, 1977. 115. Thurstone, L.L., The Measurement of Values, Chicago: University of Chicago Press, 1959. 116. Torgerson, W., Theory and Methods of Scaling, New York: John Wiley & Sons, 1958. 117. Travers, Robert M.W., An Introduction to Educational Research, 4th ed., New York: Macmillan Publishing Co., Inc., 1978. 118. Tryon, R.C., and Bailey, D.E., Cluster Analysis, New York: McGraw-Hill, 1970. 119. Ullman, Neil R., Elementary Statistics, New York: John Wiley & Sons, Inc., 1978. 120. Whitney, F.L., The Elements of Research, 3rd ed., New York: Prentice-Hall, 1950. 121. Wilkinson, T.S. and Bhandarkar, P.L., Methodology and Techniques of Social Research, Bombay: Himalaya Publishing House, 1979. 122. Willemsen, Eleanor Walker, Understanding Statistical Reasoning, San Francisco: W.H. Freeman and Company, 1974. 123. Yamane, T., Statistics: An Introductory Analysis, 3rd ed., New York: Harper and Row, 1973. 124. Young, Pauline V., Scientific Social Surveys and Research, 3rd ed., New York: Prentice-Hall, 1960
, Attitude Measurement, Chicago: Rand McNally & Co., Takeuchi, K., Yanai, H. and Mukherjee, B.N., The Foundations of Multivariate Analysis, New Delhi: Wiley Eastern Ltd., Tandon, B.C., Research Methodology in Social Sciences, Allahabad: Chaitanya Publishing House, Thorndike, Robert L. and Hagen, Elizabeth P., Measurement and Evaluation in Psychology and Education, 4th ed., New York: John Wiley & Sons, Thurstone, L.L., The Measurement of Values, Chicago: University of Chicago Press, Torgerson, W., Theory and Methods of Scaling, New York: John Wiley & Sons, Travers, Robert M.W., An Introduction to Educational Research, 4th ed., New York: Macmillan Publishing. Co., Inc., Tryon, R.C., and Bailey, D.E., Cluster Analysis, New York: McGraw-Hill, Ullman, Neil R., Elementary Statistics, New York: John Wiley & Sons, Inc., Whitney, F.L., The Elements of Research, 3rd ed., New York: Prentice-Hall, Wilkinson, T.S. and Bhandarkar, P.L., Methodology and Techniques of Social Research, Bombay: Himalaya. Publishing House, Willemsen, Eleanor Walker, Understanding Statistical Reasoning, San Francisco: W.H. Freeman and. Company, Yamane, T., Statistics: An Introductory Analysis, 3rd ed., New York: Harper and Row, Young, Pauline V., Scientific Social Surveys and Research, 3rd ed., New York: Prentice-Hall,")
Similar presentations
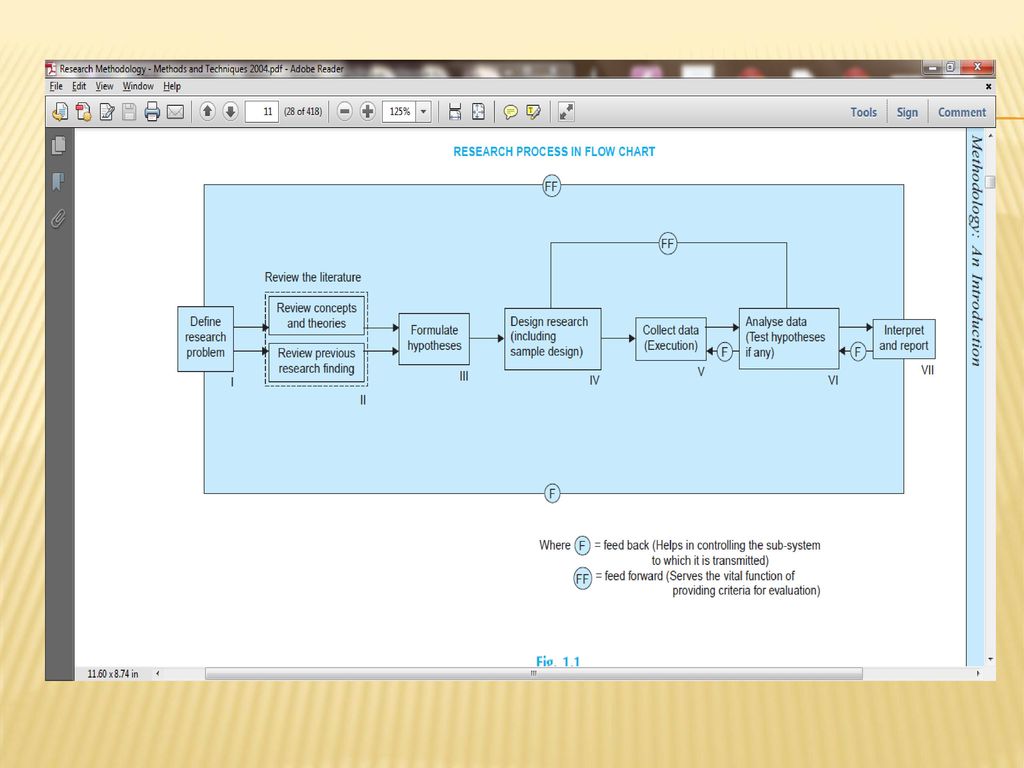
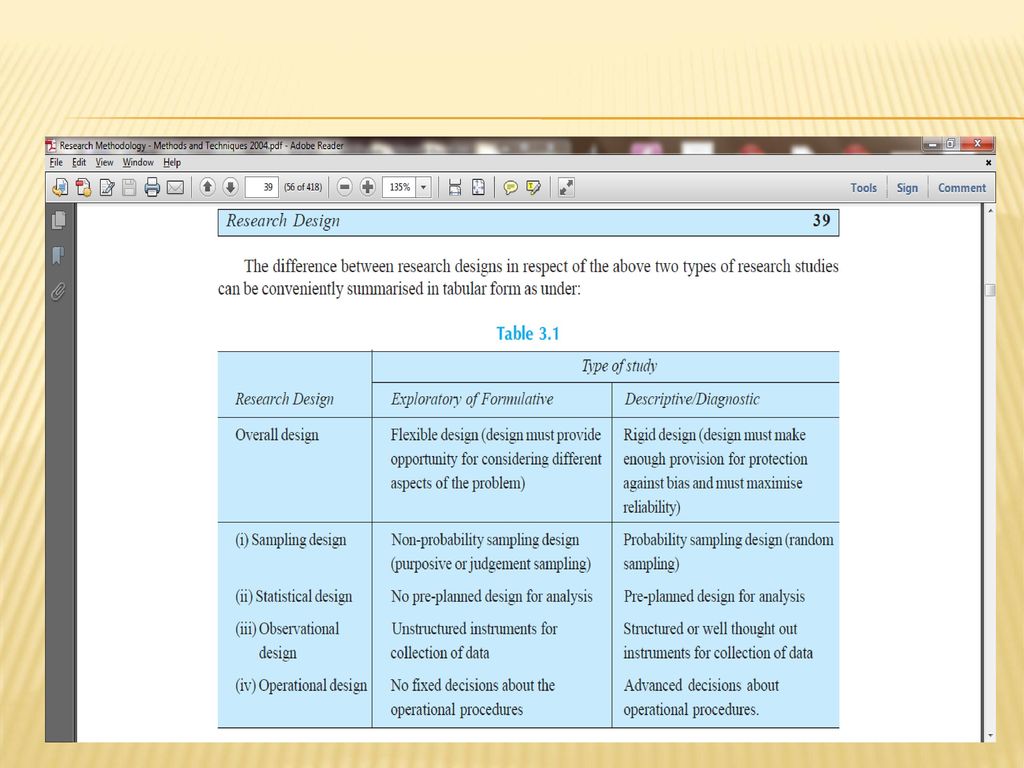

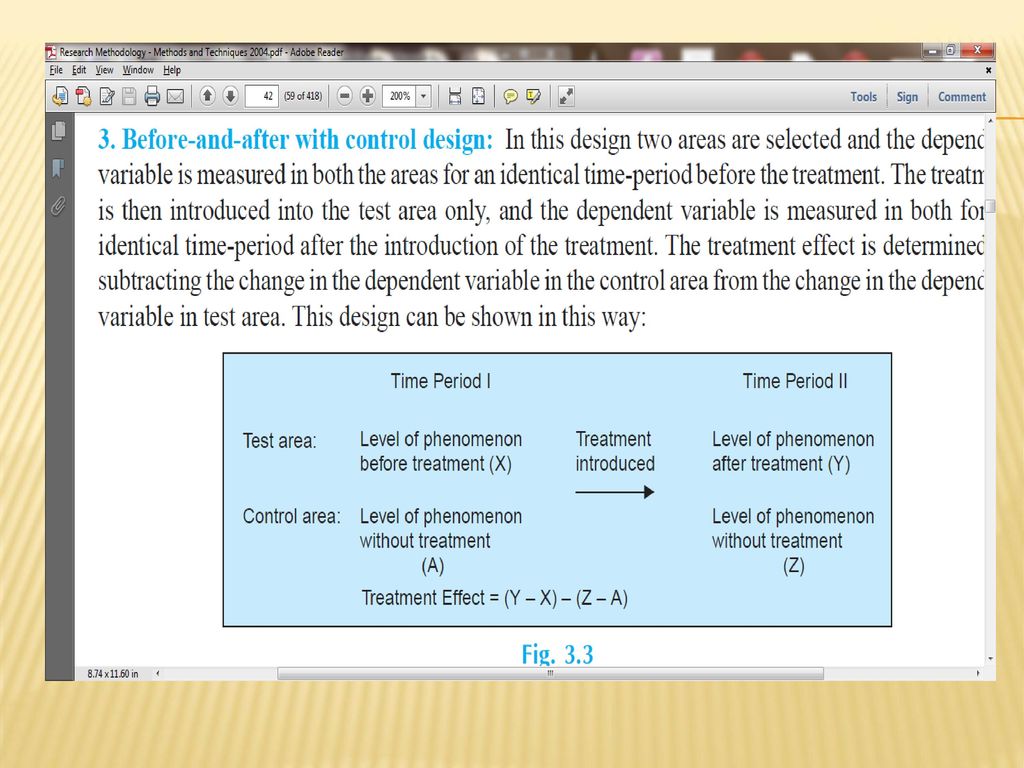
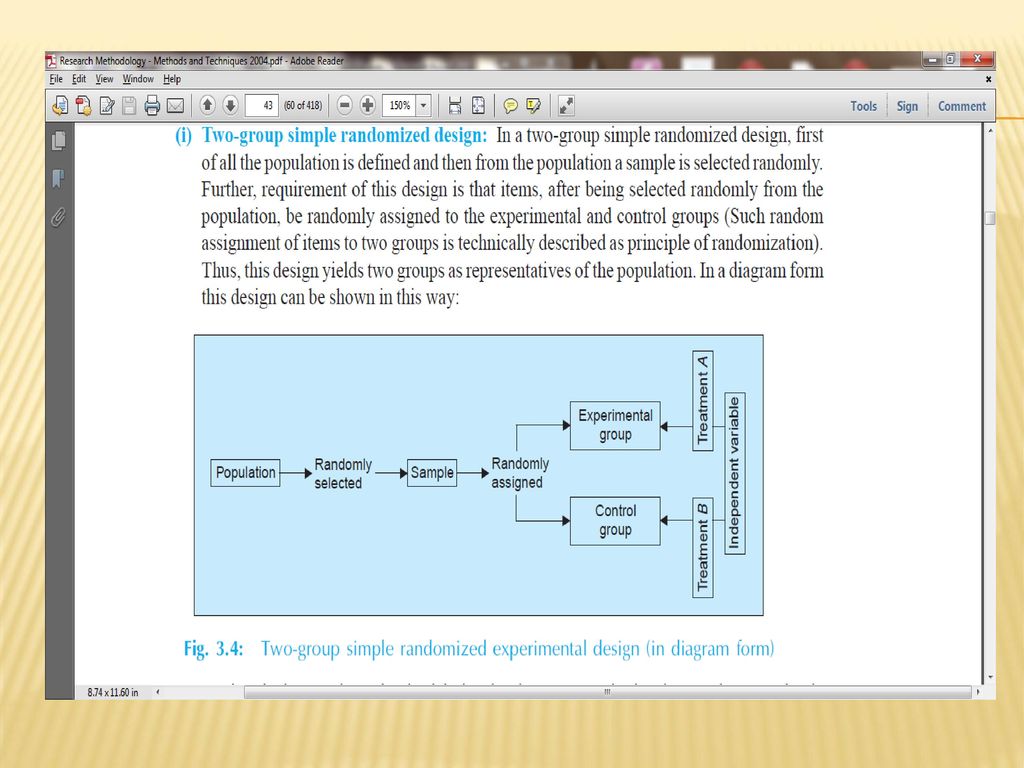

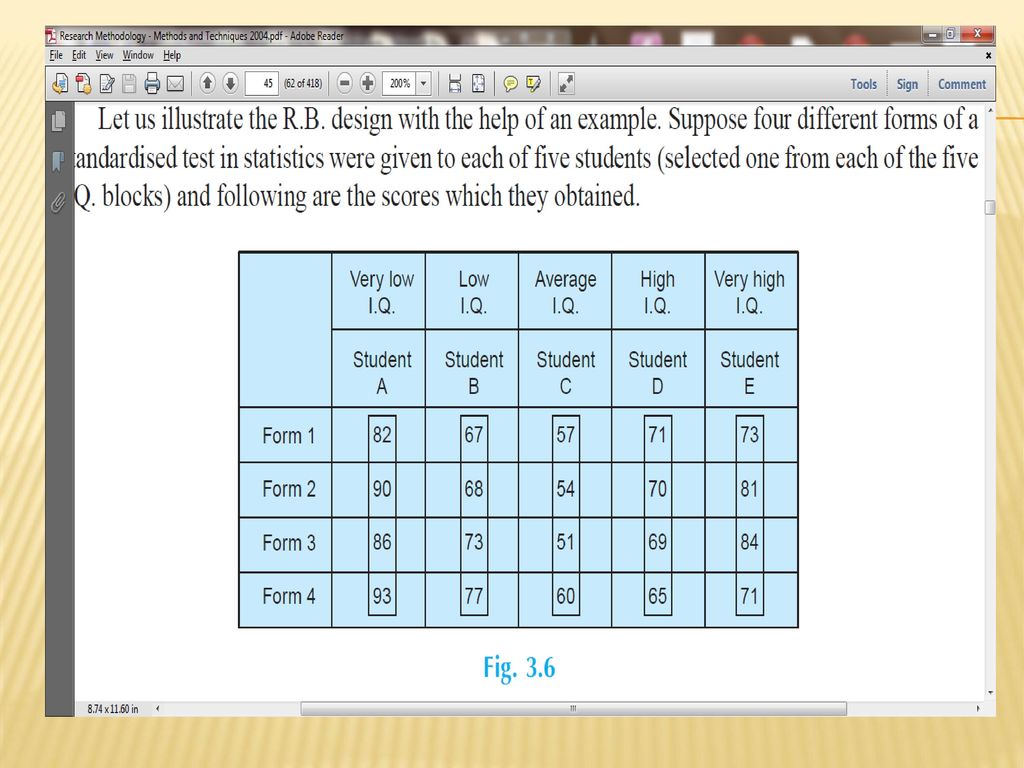
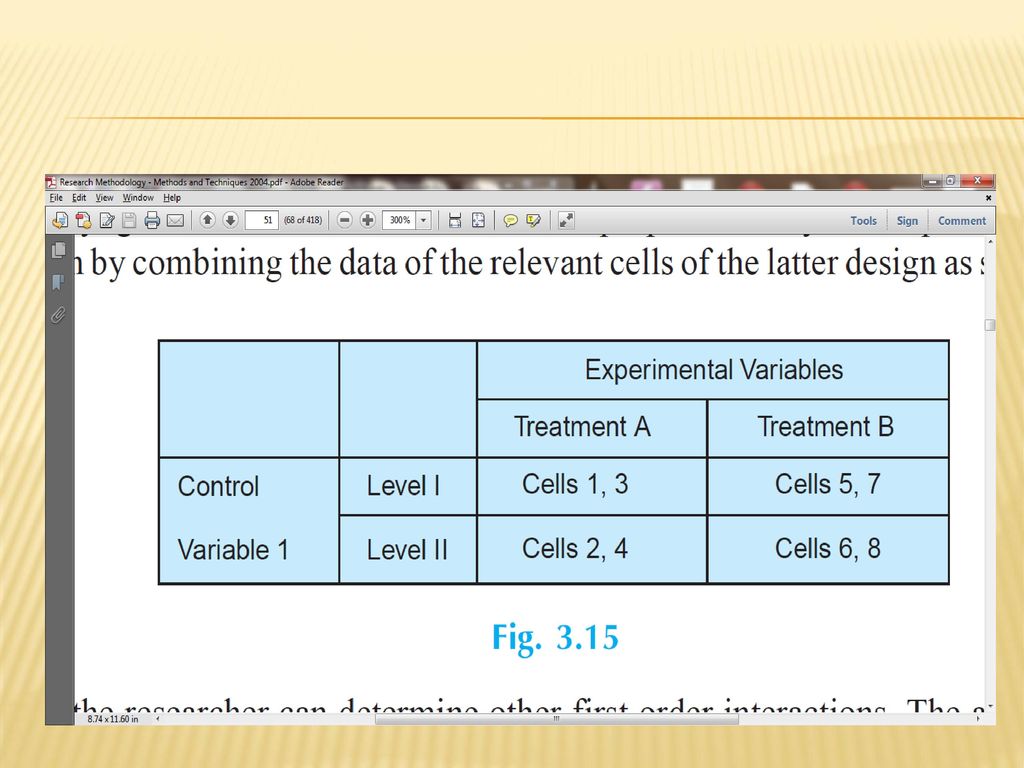


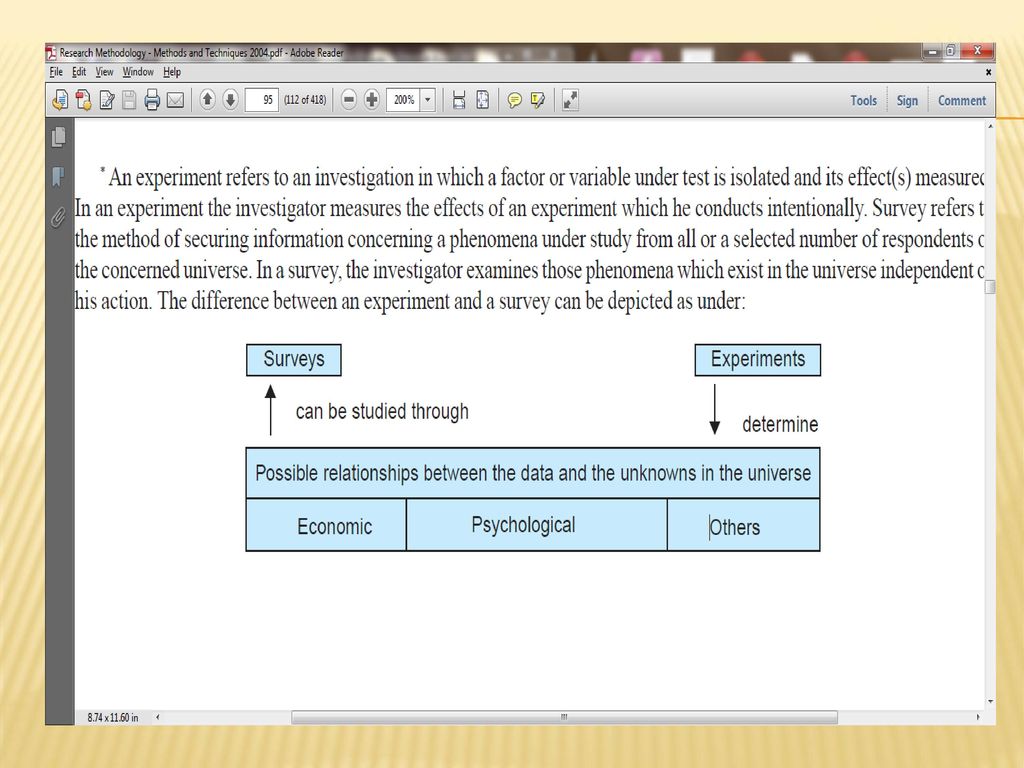


 Quantitative Educational Research Design 2 Dr Jacky Pow.>")


