Download presentation
Presentation is loading. Please wait.

1
Phylogeny and Taxonomy

2
Phylogeny and Systematics The evolutionary history of a species or related species Reconstructing phylogeny is done using evidence from systematics – field of study that focuses on classifying organisms based on evolutionary relationships and diversity

3
Areas of Study Fossils Relative dating (layers) and absolute dating (radioisotopes and half-lives) are used to show the passing of geologic time Can be used to reconstruct life history Found mostly in sedimentary rocks Fossil record is substantial, but incomplete
 and absolute dating (radioisotopes and half-lives) are used to show the passing of geologic time Can be used to reconstruct life history Found mostly in sedimentary rocks Fossil record is substantial, but incomplete")
4
Areas of Study Continental Drift Used to explain current geographic distribution Correlated with evolutionary episodes like mass extinctions and explosive increases in diversity Change in geographic location can affect survival Mass Extinctions Represented in fossil record Probably due to habitat destruction or environmental change Followed by extensive diversification of survivors

6
Areas of Study Morphology/Anatomy Homologous structures – similarities due to shared ancestry Vertebrate limbs and appendages Looking alike does not always mean that species are related! (analogous structures) Molecular Data Uses DNA and other molecules to determine relatedness The more alike the DNA sequences, the more closely related the species
 Molecular Data Uses DNA and other molecules to determine relatedness The more alike the DNA sequences, the more closely related the species.")
7
Taxonomy The naming and classification of species Began with Carolus Linnaeus and his book Systema naturae Includes a two-part naming system and hierarchical classification from broader groups to more specific

8
Binomial nomenclature Two-part, latinized naming system Includes the genus and species Genus is capitalized and both parts are italicized Examples: Homo sapiens, Felis domesticus, Canis familiaris, Drosophila melanogaster

9
Hierarchy From the broadest group (Domain) to the individual (species) Domain Kingdom Phylum Class Order Family Genus Species Each level is called a taxon (taxa) The lower the shared taxa, the more closely related the organisms
 to the individual (species) Domain Kingdom Phylum Class Order Family Genus Species Each level is called a taxon (taxa) The lower the shared taxa, the more closely related the organisms")
11
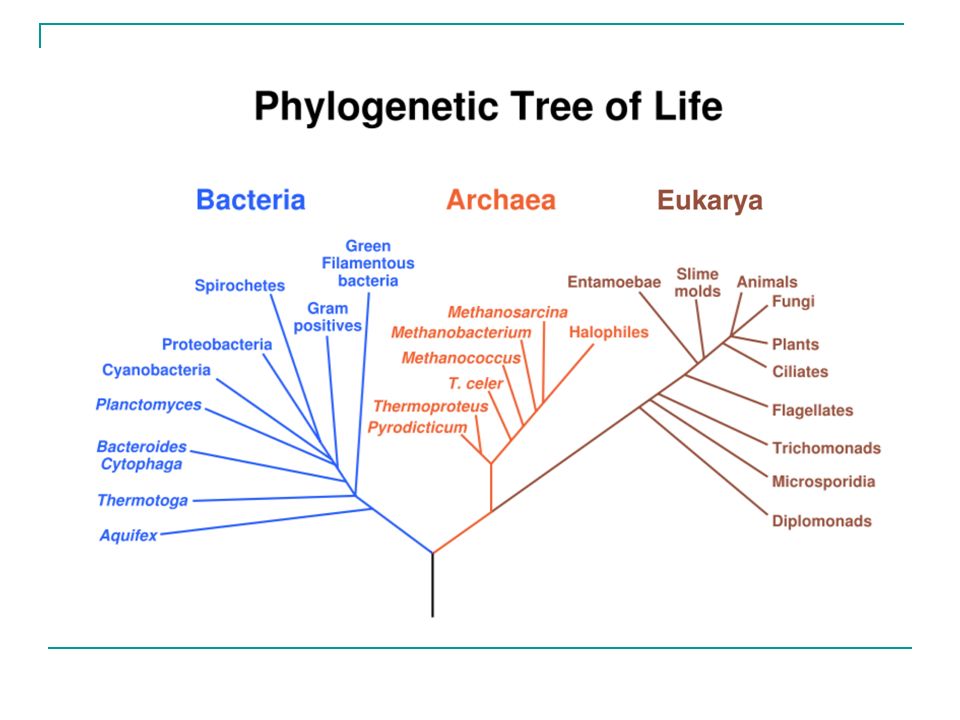
Three Domains Bacteria – includes common bacteria whose cell walls contain peptidoglycan; Kingdom Eubacteria Archaea – includes extreme bacteria that lack peptidoglycan; Kingdom Archaebacteria Eukarya – includes all eukaryotes; protist kingdoms and Kingdoms Fungi, Plantae, and Animalia

12
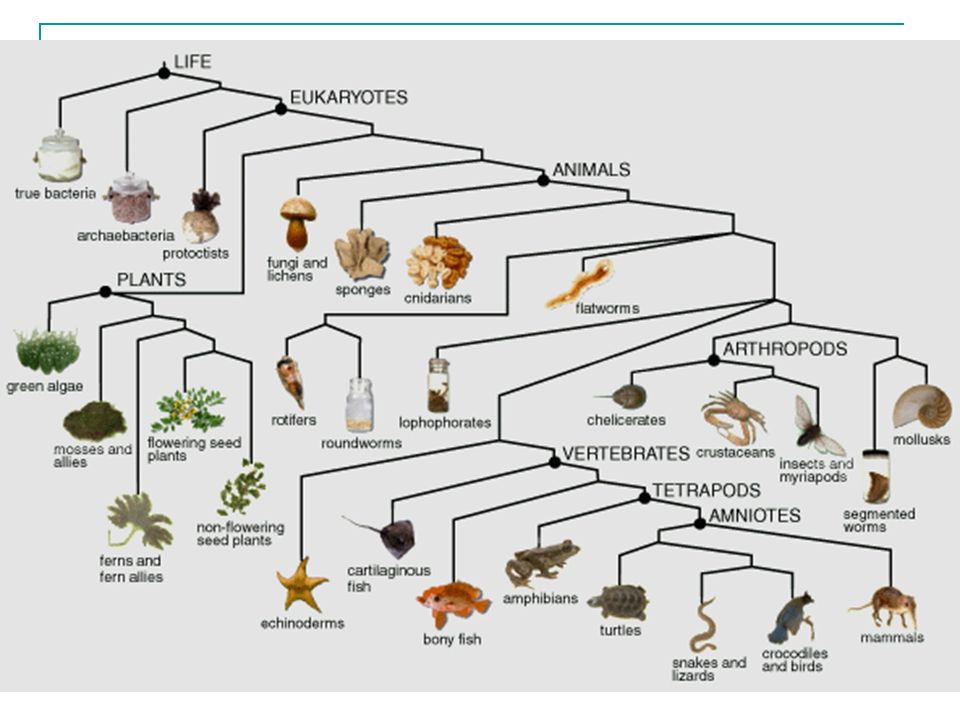
Phylogenetic Trees and Cladograms Diagrams constructed to reflect the hierarchical classification and the phylogeny of different groups (hypothetical) Represent the divergence of species from a common ancestor Often involves the emergence of innovative characteristics Sequence of branching represents historical chronology
 Represent the divergence of species from a common ancestor Often involves the emergence of innovative characteristics Sequence of branching represents historical chronology")
16
Cladograms Each evolutionary branch is called a clade May be nested (smaller into larger groups) Consists of ancestral species and all of its descendants – monophyletic Other groupings Paraphyletic – consists of ancestor and some descendants Polyphyletic – lacks the common ancestor Would not be considered clades
 Consists of ancestral species and all of its descendants – monophyletic Other groupings Paraphyletic – consists of ancestor and some descendants Polyphyletic – lacks the common ancestor Would not be considered clades")
17
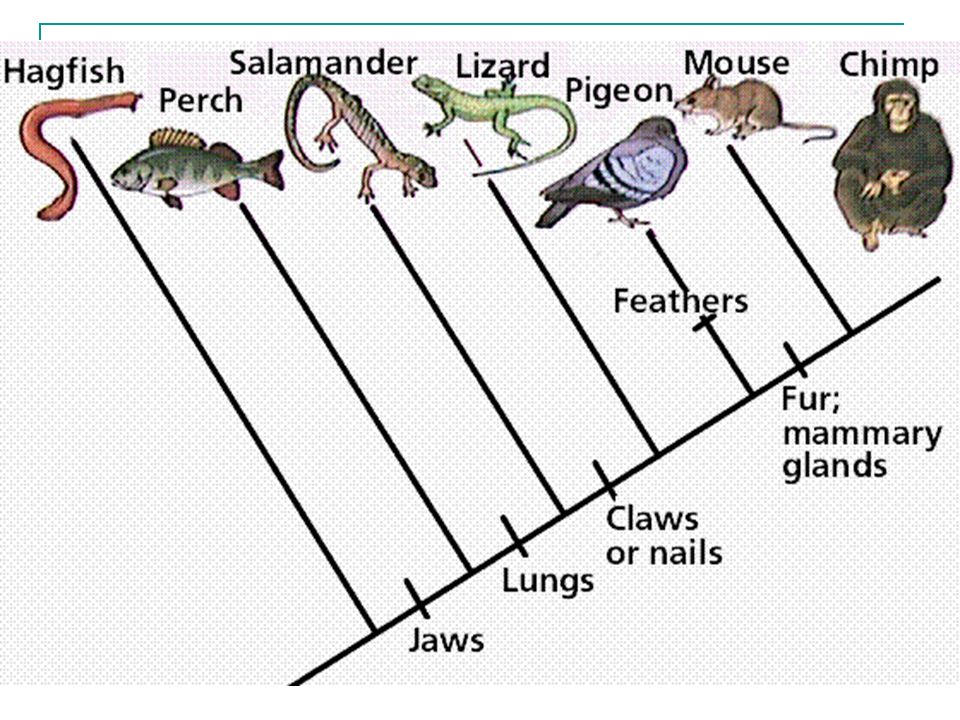
Determining the Sequence… Branches are determined by Homology – the greater number of homologous parts, the more closely related Shared Derived Characters – an evolutionary novelty unique to a clade (hair and mammals) Outgroup comparisons – uses a species that is the least closely related as a comparison for the related groups (ingroup)
 Outgroup comparisons – uses a species that is the least closely related as a comparison for the related groups (ingroup)")
18
DNA provides most evidence Bioinformatics is a field that analyzes DNA sequences using complex mathematics and computer programs. Functional genomics assigns functions to the products of genes. Comparative genomics compares a newly sequenced genome with sequences from other organisms. Comparison of nucleotide sequences help to construct cladograms with branch points defined by mutations

19
Rates of change in DNA vary in the genome Coding for rRNA changes slowly – used to analyze relationships between taxa long ago (broader groups) Mitochondrial DNA evolves rapidly – used to compare closely related species and more recent evolutionary events
 Mitochondrial DNA evolves rapidly – used to compare closely related species and more recent evolutionary events")
20
Molecular Clocks Timing methods based on the regions of the genome that evolve at a constant rate The number of nucleotide and amino acid substitutions is proportional to the time that has elapsed since two taxa diverged from a common ancestor

21
Principle of Parsimony “Keep it simple” Phylogeny is usually based on the idea that the simplest explanation is probably the best Also known as “Occam’s Razor” – from the English philosopher who advocated the minimalist approach (shave off unneeded complications)
")
Similar presentations


>")


