Download presentation
Presentation is loading. Please wait.

1
Phylogeny and Systematics
Chapter 26: (Making “Trees of Life”)
")
2
Macroevolution studies focus on change that occurs at or above the level of species The origin of taxonomic groups higher than species level How does this occur? Evolution of new traits (novelties) mass extinctions Open adaptive zones (divergent evolution)
 mass extinctions. Open adaptive zones (divergent evolution)")
3
Currently, scientists use
Morphological, biochemical, and molecular comparisons to infer evolutionary relationships Obtained through fossil studies, DNA technology and current organisms

4
Phylogeny What is phylogeny? The evolutionary history of a group
Systematics attempts to reconstruct phylogeny, by analyzing evolutionary relatedness. Use morphological and biochemical similarities Molecular systematics uses DNA, RNA and proteins to infer evolutionary relatedness. Different tools are used to reconstruct phylogenies called phylogentic trees.

5
Molecular systematics

6
Systematics Uses evidence from fossil record and existing organisms to reconstruct phylogeny (Linneaus) Binomial nomenclature Genus species keeps identity of organism universal Other taxa used to classify Domain, Kingdom, Phylum, Class, Order, Family, Genus, species

7
Taxonomy Linnaeus ordered division of organisms into categories based on a set of characteristics used to assess similarities and differences

8
Linking Classification and Phylogeny
Systematists depict evolutionary relationships In branching phylogenetic trees Panthera pardus (leopard) Mephitis mephitis (striped skunk) Lutra lutra (European otter) Canis familiaris (domestic dog) Canis lupus (wolf) Panthera Mephitis Lutra Canis Felidae Mustelidae Canidae Carnivora Order Family Genus Species Figure 25.9
 Mephitis mephitis (striped skunk) Lutra lutra (European otter) Canis familiaris (domestic dog) Canis lupus (wolf) Panthera. Mephitis. Lutra. Canis. Felidae. Mustelidae. Canidae. Carnivora. Order. Family. Genus. Species. Figure")
9
Each branch point Represents the divergence of two species Leopard
Domestic cat Common ancestor

10
“Deeper” branch points
Represent progressively greater amounts of divergence Leopard Domestic cat Common ancestor Wolf

11
Cladistics Cladogram is a tree with two way branch points
Each branch point represents divergence from common ancestor Each branch is called a clade Clades Can be nested within larger clades, but not all groupings or organisms qualify as clades 3 types of groupings Monophyletic Polyphyletic Paraphyletic

12
Different Types of Clades
Monophyletic = single ancestor gave rise to all species in the taxon; ONLY valid clade Polyphyletic = includes numerous types of organisms that lack a common ancestor; not a valid clade Paraphyletic = a grouping that consists of an ancestral species and some, but not all, of the descendants; not a valid clade

13
Clades Grouping 1 Grouping 2 Grouping 3 Monophyletic Paraphyletic
Polyphyletic

14
Let’s practice…

16
Making “Trees”: Morphological & molecular homologies
similarities based on shared ancestries bone structure DNA sequences beware of analogous structures convergent evolution

17
Not all Similarities Represent Common Ancestry
Homologous structures indicate shared common ancestry Homologous structures are therefore evidence of divergent evolution Analogous structures are similar in function but not in evolutionary history Analogous structures are evidence of convergent evolution It is not always easy to sort homologous from analogous structures

18
RECALL… Convergent evolution occurs when similar environmental pressures and natural selection Produce similar (analogous) adaptations in organisms from different evolutionary lineages Marsupial Eutherian (placental)
 adaptations in organisms from different evolutionary lineages. Marsupial. Eutherian. (placental)")
19
Making Evolutionary Life Trees: Illustrating Phylogeny
1. Cladistics = sorts homologous from analogous structures sorts primitive and shared derived characteristics Makes cladograms

20
The Universal Tree of Life
The tree of life is divided into three great clades called domains: Bacteria, Archaea, and Eukarya Bacteria Eukarya Archaea 4 Symbiosis of chloroplast ancestor with ancestor of green plants 1 3 Symbiosis of mitochondrial ancestor with ancestor of eukaryotes 4 Billion years ago 3 2 2 Possible fusion of bacterium and archaean, yielding ancestor of eukaryotic cells 2 3 1 Last common ancestor of all living things 1 Origin of life 4 Figure 25.18

21
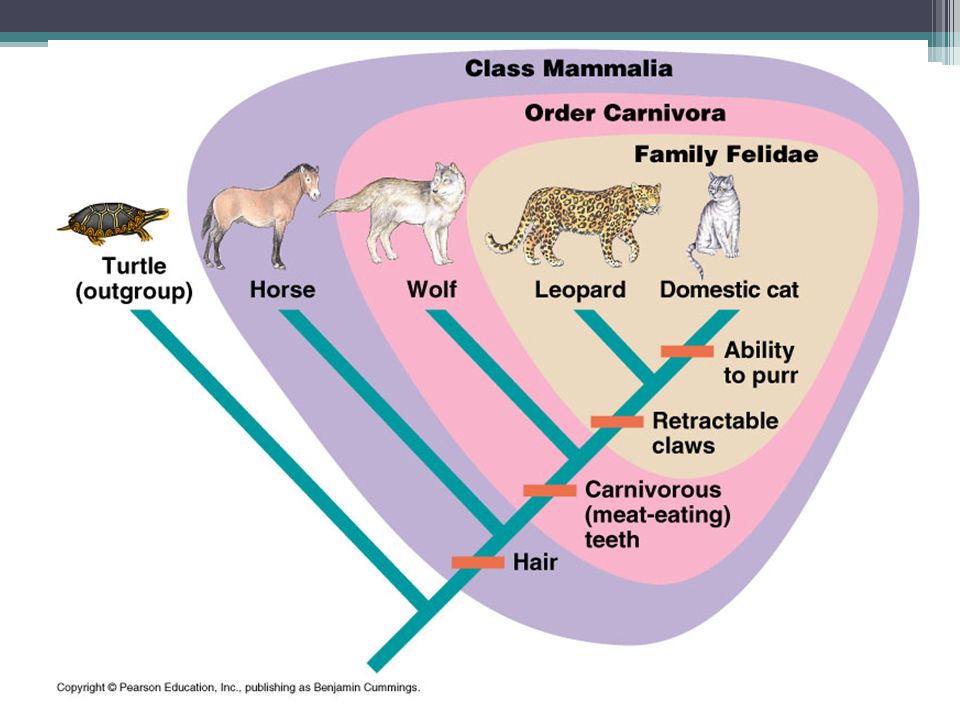
A shared primitive character
a homologous structure that is shared by all groups we are trying to define A shared derived character A new evolutionary trait unique to a particular clade(s) Making Cladograms Activity Time
 Making Cladograms Activity Time.")
23
What is the shared primitive characteristic? Notochord
A Cladogram What is the shared primitive characteristic? Notochord

25
Phylograms In a phylogram
Drosophila Lancelet Amphibian Fish Bird Human Rat Mouse Cenozoic Mesozoic Paleozoic Proterozoic 542 251 65.5 Millions of years ago In a phylogram The length of a branch in a cladogram reflects the number of genetic changes that have taken place in a particular DNA or RNA sequence in that lineage Involves timing cladograms do NOT!

Similar presentations


 zLinnaeus zBinomial system yGenus, species.>")


