Download presentation
Presentation is loading. Please wait.

1
Integration of BioInformatics tools at NUS

2
GenBank Growth Chart Year Bases

3
Use of Computers in Molecular Biology Powerful tools for organise the data itself. – Exponential growth. – A new release is made every two months. Data Analysis. – Retrieval. – Homology Search. – Modelling purposes - Drug Design Data Integration Data Visualisation

4
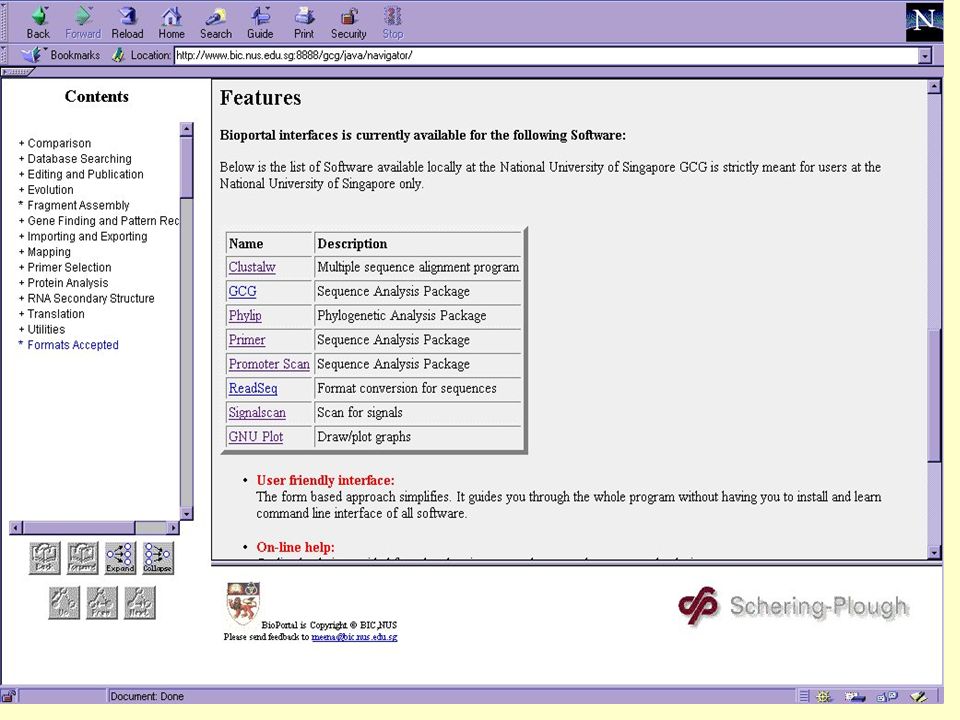
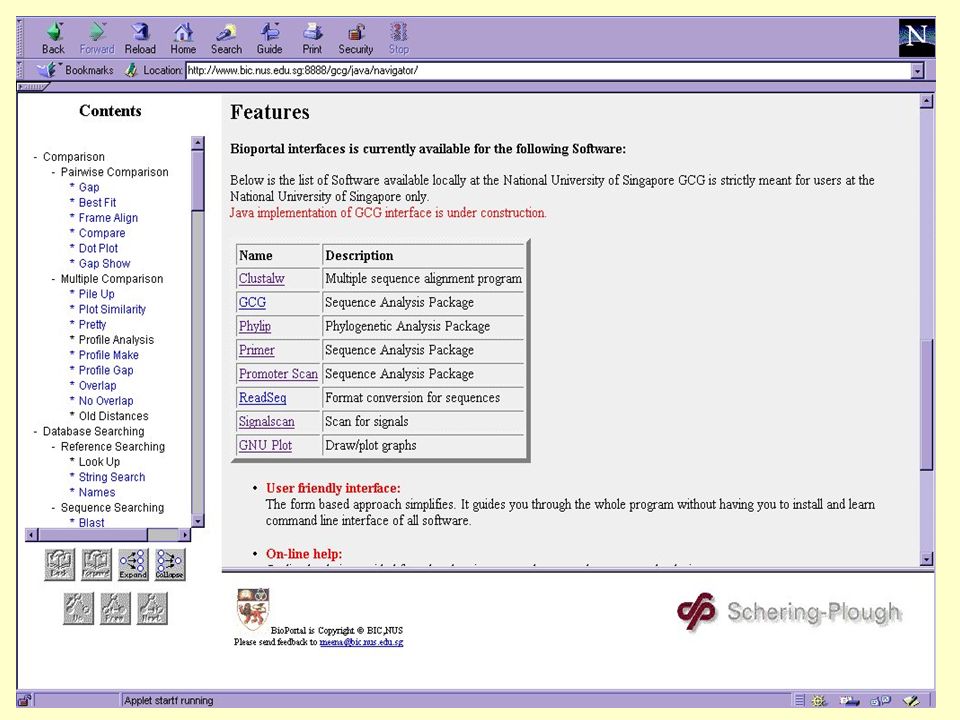
BioInformatics Tools at NUS BioPortal BioKris (formerly called BioKleisli) BioWebWatch (Bio-Eyes) BioJake Other projects
 BioWebWatch (Bio-Eyes) BioJake Other projects")
5
BioPortal BioPortal

6
BioPortal User friendly gateways to GCG and other software.

7
Prior Scenario Command line interface. Basic OS knowledge. User Interface(UI) for each program. Platform dependent. Transient phase Hyper text Menu Based Interface
 for each program. Platform dependent. Transient phase Hyper text Menu Based Interface.")
8
Present Scenario User-Friendly web interface to Biosoftware. Platform Independent. Depends on Client - Server Technology. Common Gateway Interface (CGI) programs written in PERL and C.
 programs written in PERL and C..")
9
Programs available GCG PHYLIP CLUSTALW GNUPLOT SIGNALSCAN LOCAL ALIGN TULLA

10
Graphical Representation of BioPortal Functionality

11
The web interface allows you to focus on "How will I solve my sequence analysis problems?" rather than on "How do I use this software?"

12
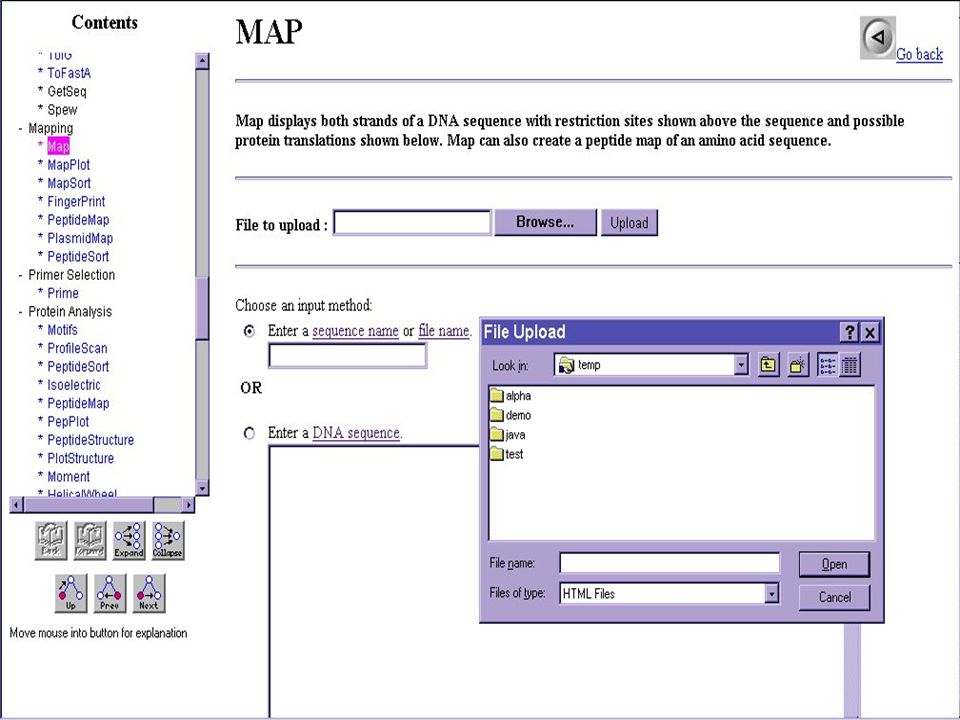
Special features User Friendly Interface The form based approach simplifies the task. It guides you through the whole program. No need to install and learn command line interface of all software. Format Independent Hyperlinks for Results

14
Formats supported

15
Results for Signal Scan

16
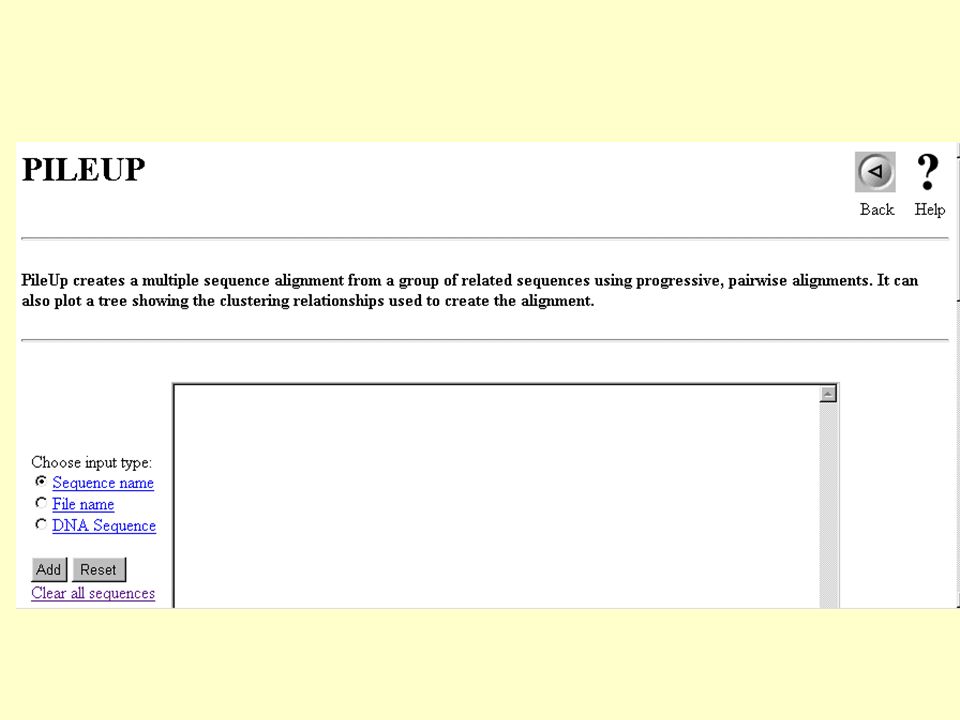
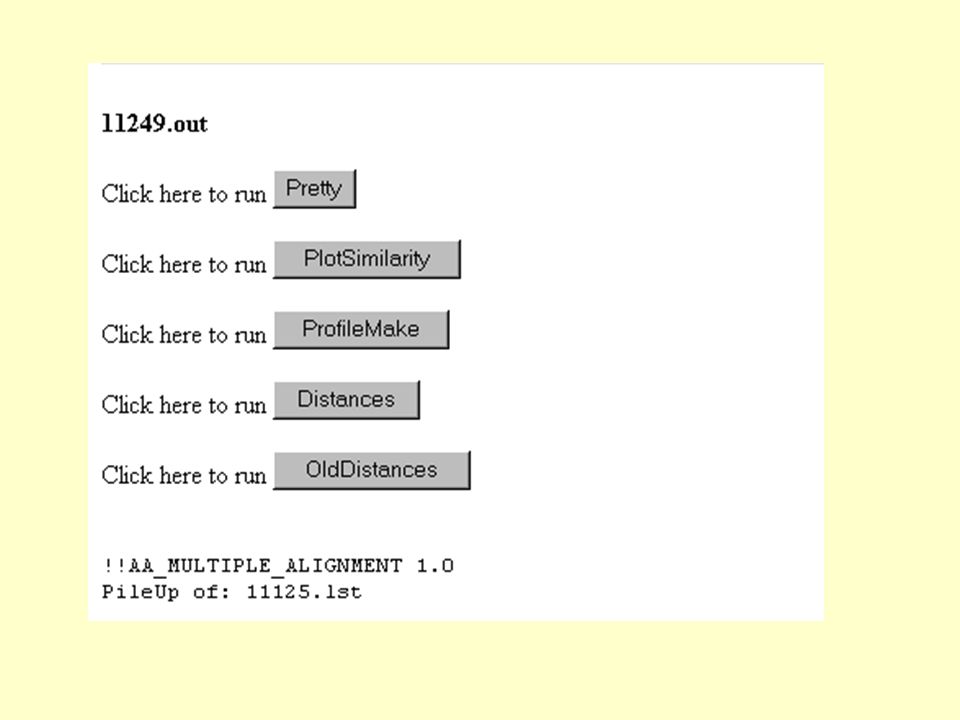
Special features Online Help Speeds up your data entry and analysis. Conduit Output can be piped to other programs for further analysis. Pileup Distances Growtree.

19
Special features Temp file usage: (a) Output of other programs is input for them. (b) Programs which take a lot of time. Improved Operation Control: A fully customisable interface provides a flexible environment. Shared Access: This interface allows several distant users to use the same program simultaneously. Remote retrieval and analysis: This interface allows you to access your program from anywhere in the world.
 Programs which take a lot of time. Improved Operation Control: A fully customisable interface provides a flexible environment. Shared Access: This interface allows several distant users to use the same program simultaneously. Remote retrieval and analysis: This interface allows you to access your program from anywhere in the world..")
20
Special features of JAVA ver. Navigation Panel : Java navigation allows to view the tree structure for the programs. File handling Capability: Local desk top file loading.

24
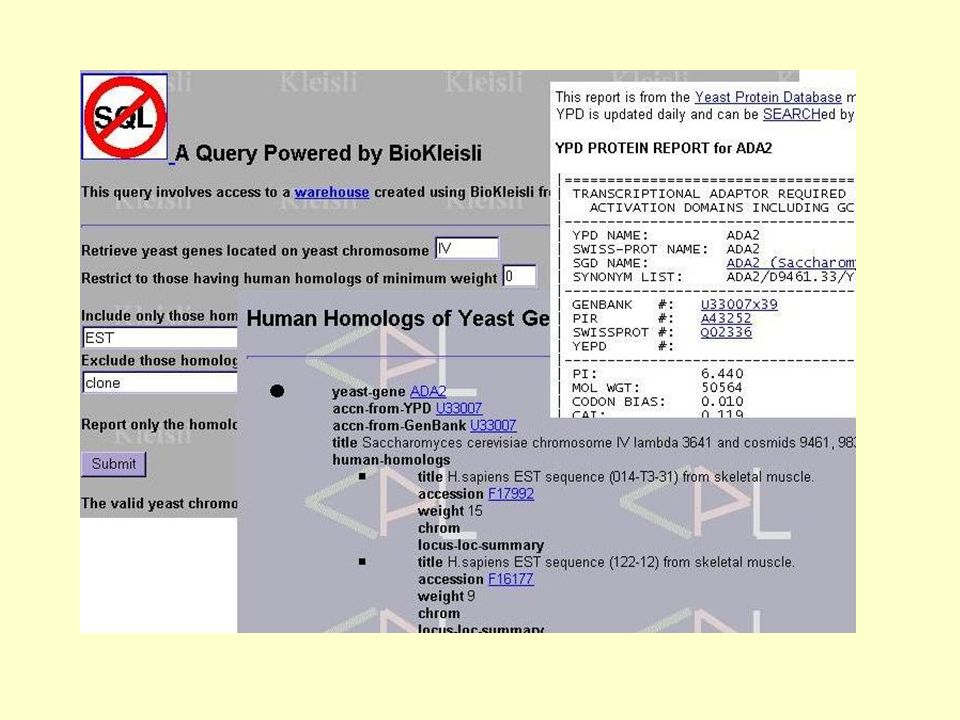
BioKleisli or BioKris

25
Introduction A BIC-KRDL collaboration Open query system for broad-scale integration of heterogeneous distributed databanks Flexible access for existing biological databanks

26
Features and Benefits Features Provides a query system that can integrate all types of biology databanks and analysis software express high level views and transformations that go beyond flat tables Flexible access = migrate + integrate + restructure Benefits More effective and easier access to world wide data for biologists Enhances productivity and simplifies programming tasks

35
BioWebWatchorBio-Eyes

36
Problems Too much Information? Many sites to cover despite automatic notification. Revisit your site of interest at least once a month.

37
BioWebWatch Allows users to automate queries. Channels. Users Keywords Websites

38
Goals Collecting, aggregating, managing and integrating information. Integration with existing software tools. Sharing information across the organisation. Collaboration with other information servers.

39
What’s out there? Electronic Journals Web Pages News Groups Databases

40
Cyberspace is a big place New Query Search Good Hits! Useless Hits

41
Staging and presenting Information Word Proc Biblio. Prog BioWebWatch Web tools E-mail BioWebWatch BioKleisli BioJake WWW

42
An Information Butler Information Management Automated Query Search Results Automated Dispersal Good Hits! Useless Hits

43
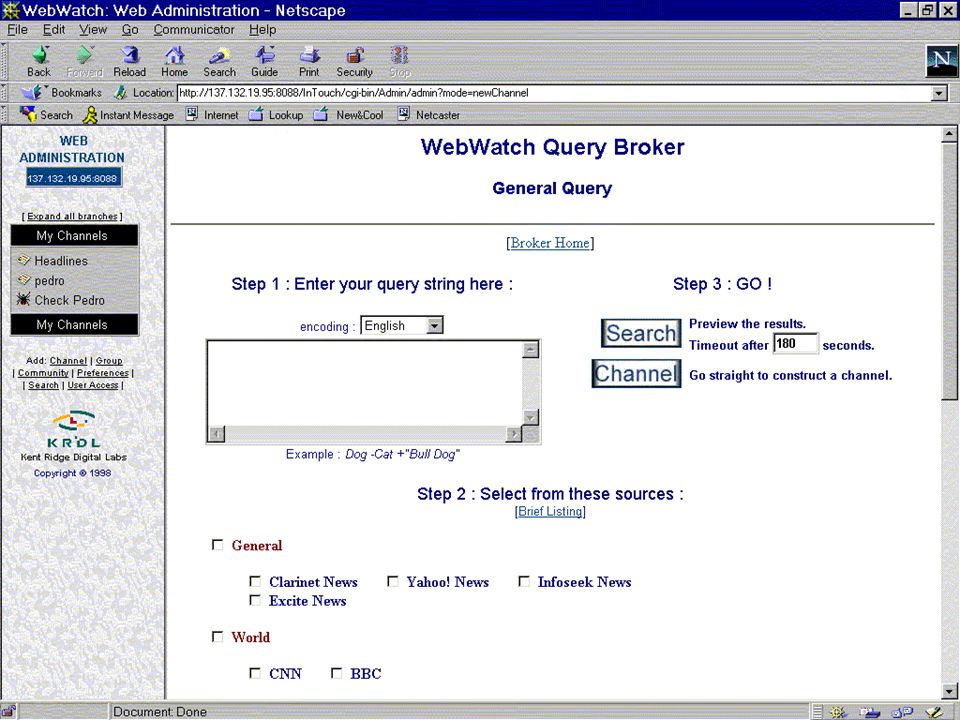
Creating a Query Enter search string Choose source Preview search Create Channel

45
Gathering Information

46
Working with Information

47
Distributed Processing for scalable performance

48
BioJake BioJake

49
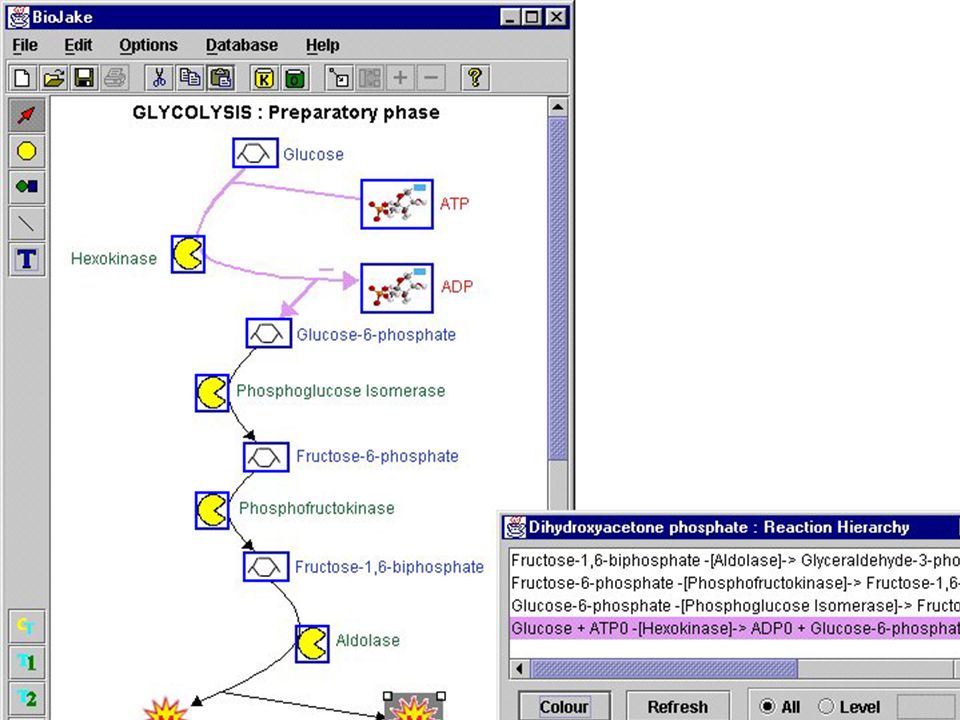
BioJAKE BioJAKE is a graphical program allowing for the onscreen creation, manipulation and visualization of metabolic pathways. Pathways are represented as a series of molecules (images) linked together by a series of reactions (lines). Each molecule is defined through it’s image, name, type and states.
 linked together by a series of reactions (lines). Each molecule is defined through it’s image, name, type and states..")
Similar presentations