Download presentation
Presentation is loading. Please wait.

1
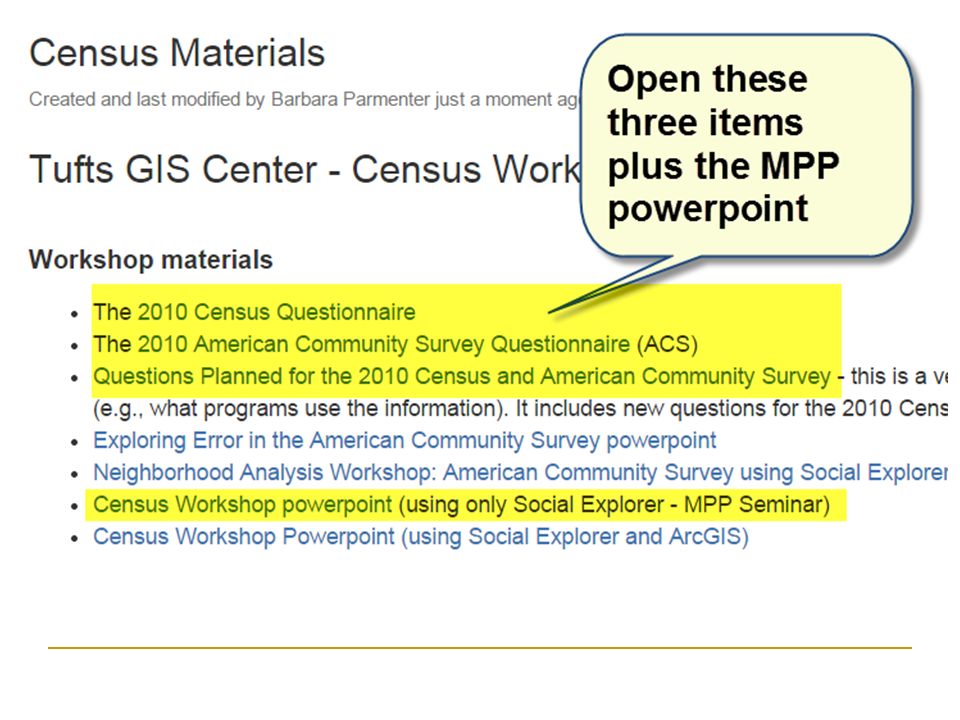
U.S. Census and American Community Survey Overview Open a web browser and go to: http://tinyurl.com/tufts-census

3
US Census Bureau Collection Methods Three basic methods of collection Census (100%) Survey (sample) Administrative records
 Survey (sample) Administrative records")
4
Two Types of Census by the US Decennial census: population and housing On the 0’s (2000, 2010) Economic census: business and industry On the 2’s and 7’s (2002, 2007, 2012) Census = the enumeration of entire population or universe of collection units such as housing units or businesses
 Economic census: business and industry On the 2’s and 7’s (2002, 2007, 2012) Census = the enumeration of entire population or universe of collection units such as housing units or businesses")
5
Survey Types Data collected from sample of population, that represents the full population American Community Survey - monthly Current Population Survey - monthly Survey of Income and Program Participation - monthly American Housing Survey - every 2 years

6
Administrative Records The Census Bureau also collects some administrative records (e.g., births and deaths, Medicare, Social Security, IRS, Customs Service) Population estimates and projections County Business Patterns Exports/Imports
 Population estimates and projections County Business Patterns Exports/Imports")
7
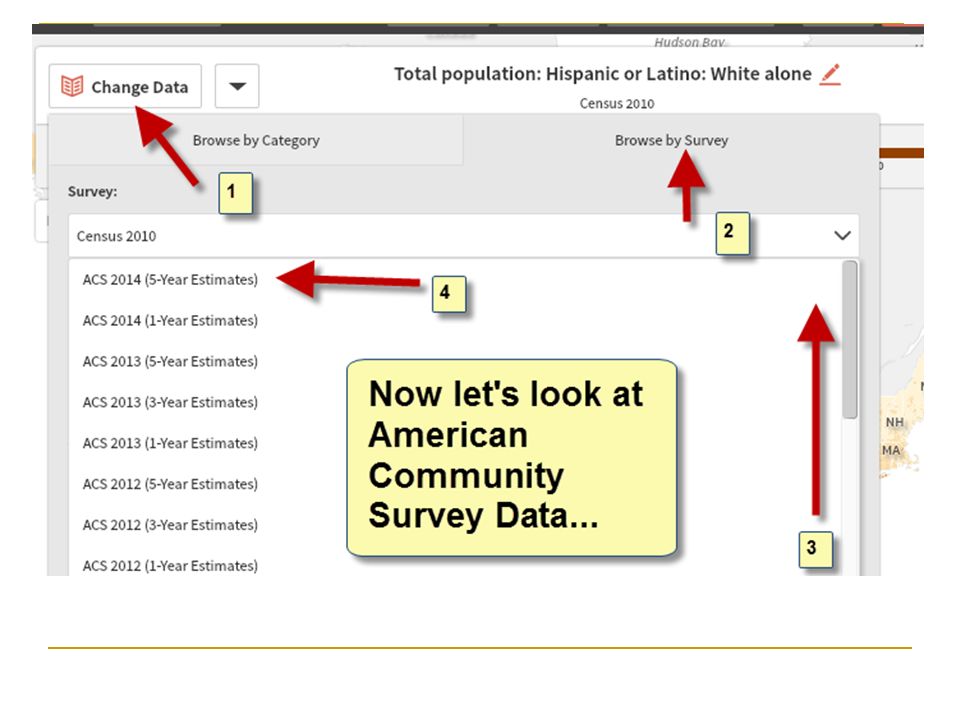
We will focus on: The 2010 Census The American Community Survey (ACS) How to map census / ACS data in Social Explorer Understanding sampling error for the ACS (may not get there today, read the powerpoint if not!)
 How to map census / ACS data in Social Explorer Understanding sampling error for the ACS (may not get there today, read the powerpoint if not!)")
8
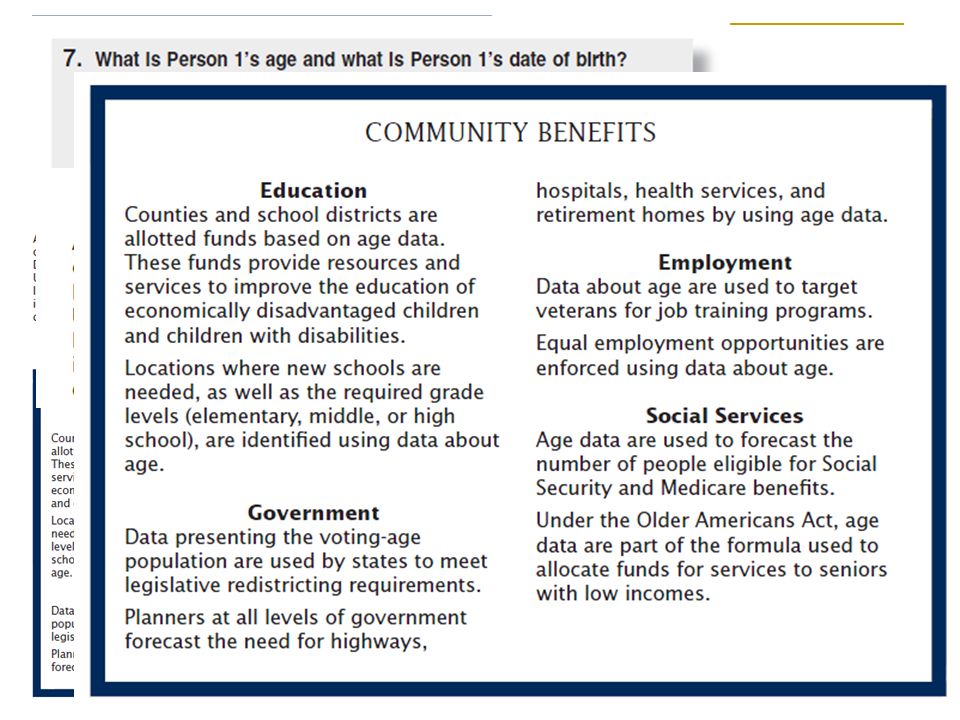
Let’s take a look at the 2010 Census form…

9
Why does the government ask these questions? This book is a good guide…book

11
Think about these questions when you use the data How would you answer the questions What about your roommates or family members Think about how race and Hispanic/Latino ethnicity are categorized Think about how people respond to those questions Many Hispanics marked “some other race” – why?

12
Race “Race” is a self-identification data item in which respondents choose the race or races with which they most closely identify.

13
Hispanic ethnicity– also self-identified Questions pertaining to Hispanic/Latino – a person’s options are either: Hispanic or Latino Mexican, Mexican American, Chicano Puerto Rican Cuban Other Not Hispanic or Latino

14
So understand you can’t combine numbers across race/Hispanic ethnicity Look for Hispanic and Non-Hispanic tabulations (requires you to be very observant of the details when getting data!)
")
15
American Community Survey Continuous monthly survey Began in 2005 It has replaced the decennial census long form

16
Look at the American Community Survey Questionnaire

17
Again, think about how people would respond to these questions Accuracy of answers? Would you know when your house was built? Do you know how much you spent for heating costs? Concerns about privacy?

18
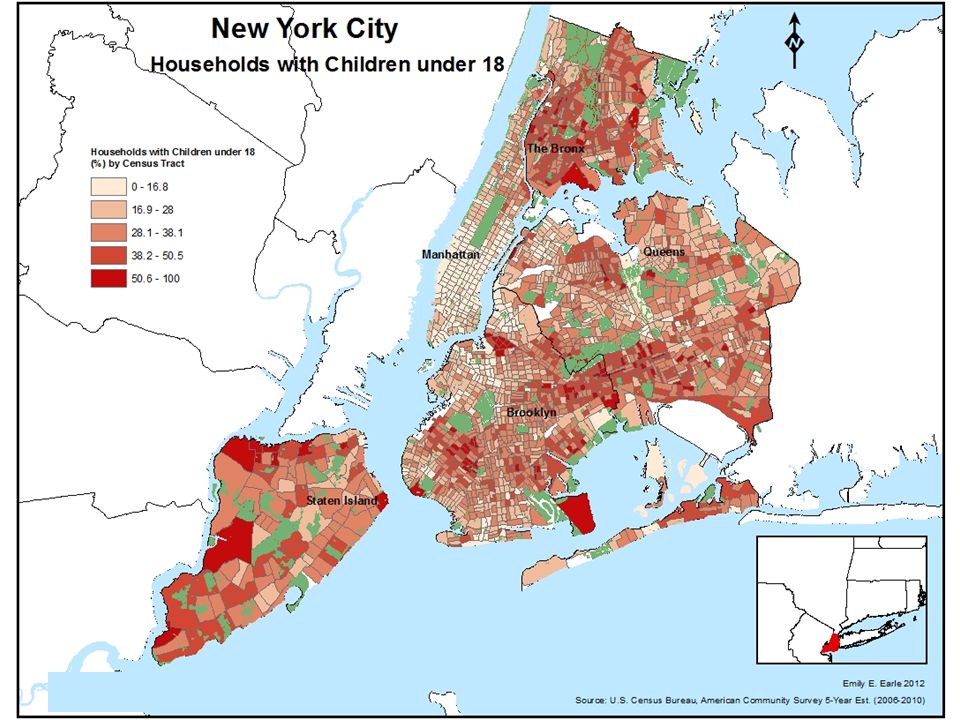
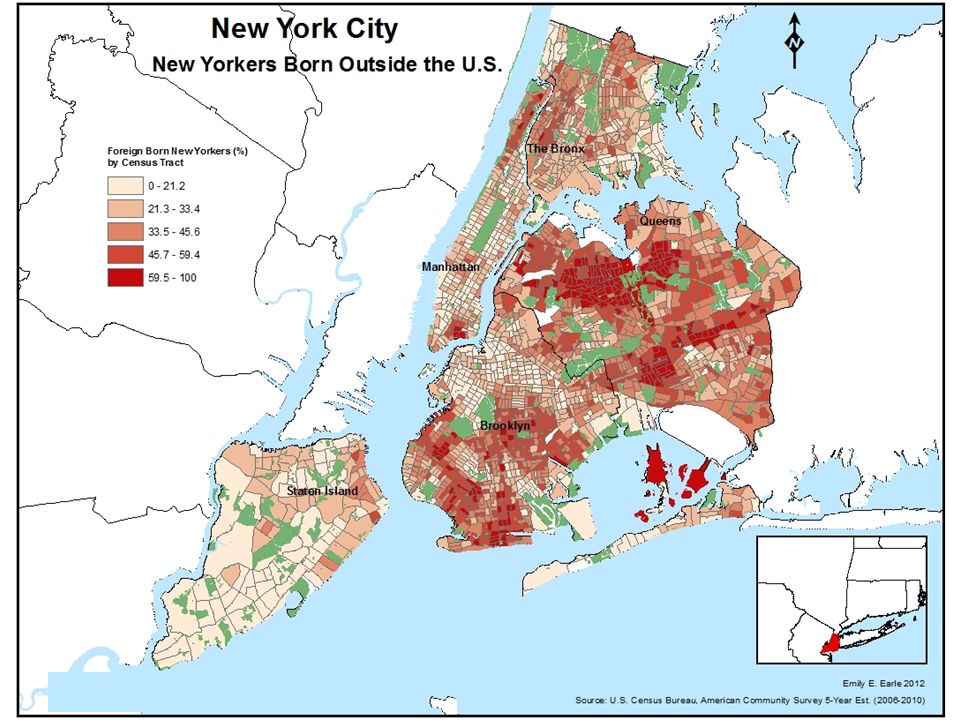
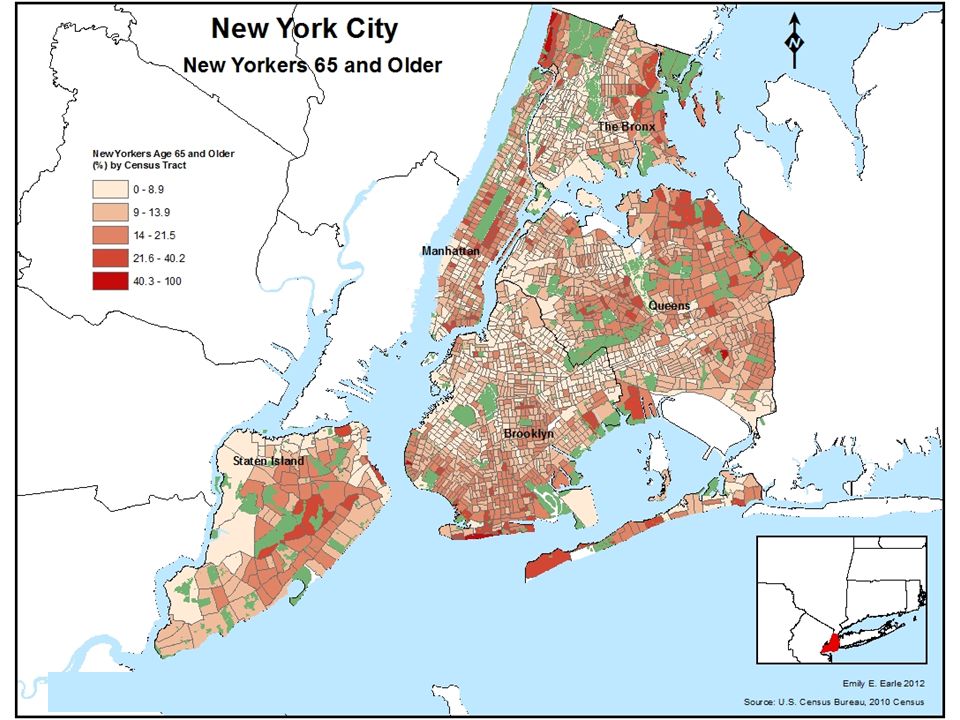
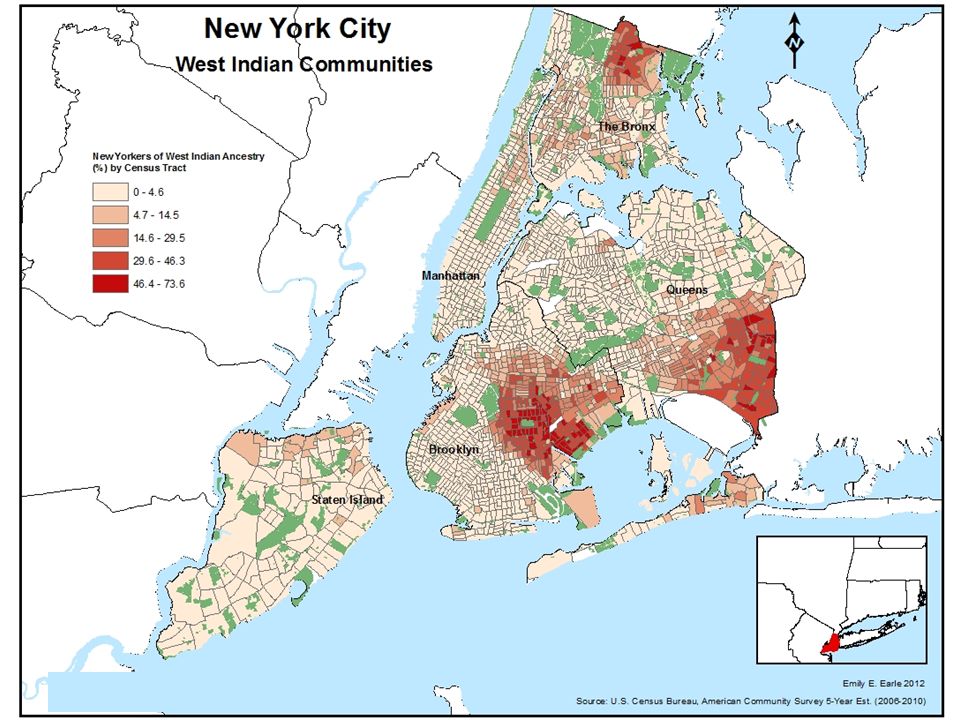
Look at the following maps of New York City by Emily Earle Would the data come from the Census or the American Community Survey (ACS)?
")
25
Most important for you: Decennial Census Once every 10 years 100% count* Basic information on population, race/Hispanic ethnicity, age, family structure, housing units, owner/renter housing tenure * Who might be missed? American Community Survey Sample survey Detailed information on income, education, commute, place of birth, etc. To be discussed – high sampling error at neighborhood level!

26
Some other important definitions to understand

27
Housing Unit A house, an apartment, a mobile home or trailer, a group of rooms, or a single room occupied as separate living quarters, or if vacant, intended for occupancy as separate living quarters. Separate living quarters are those in which the occupants live separately from any other individuals in the building and which have direct access from outside the building or through a common hall. For vacant units, the criteria of separateness and direct access are applied to the intended occupants whenever possible.

28
Living Quarters Housing unit: unit occupied as separate living quarters, or, if vacant, is intended for occupancy as a separate living quarters Group quarters Institutionalized population (such as correctional institutions, nursing homes, and juvenile institutions) Noninstitutionalized population (such as college dormitories, military quarters, and group homes)
 Noninstitutionalized population (such as college dormitories, military quarters, and group homes)")
29
Household Household: all persons who occupy a housing unit Important: housing unit and household are TWO different things! Don’t get them confused!

30
Two Types of Households Family Household: householder plus all persons in the household related by blood, marriage, or adoption Can also include: Subfamily Example: householder’s son and daughter-in-law Nonrelative Example: roomers, boarders Nonfamily Household: persons living alone or with nonrelatives only

31
The “universe” for each variable The total number of units, e.g., individuals, households, businesses, in the population of interest. This is important for understanding percentages Know your “universe”!

32
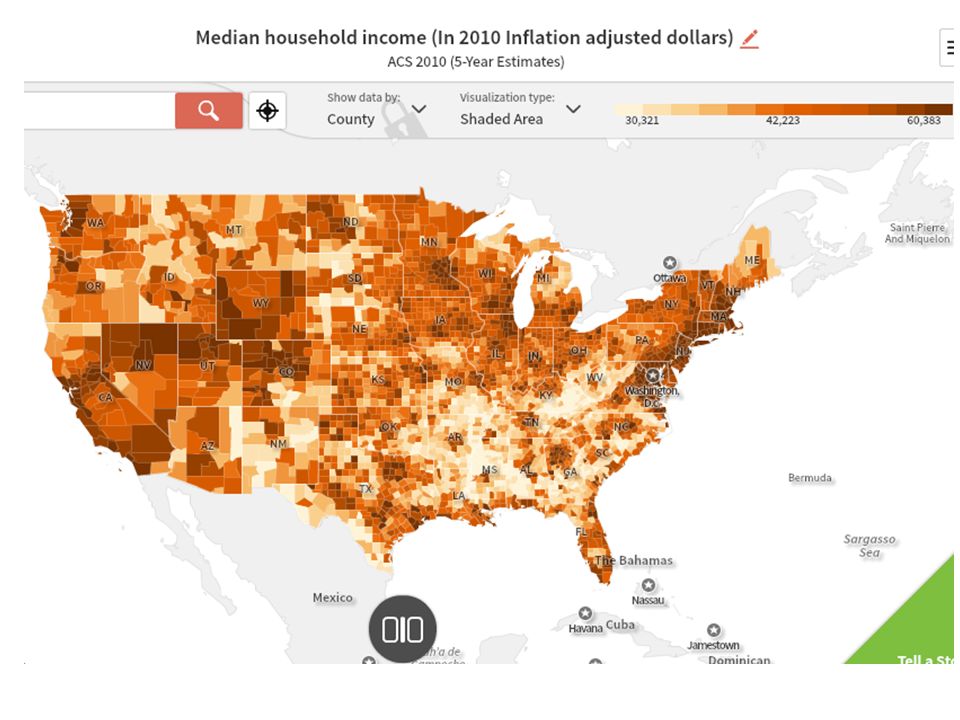
Barnstable County, MA

34
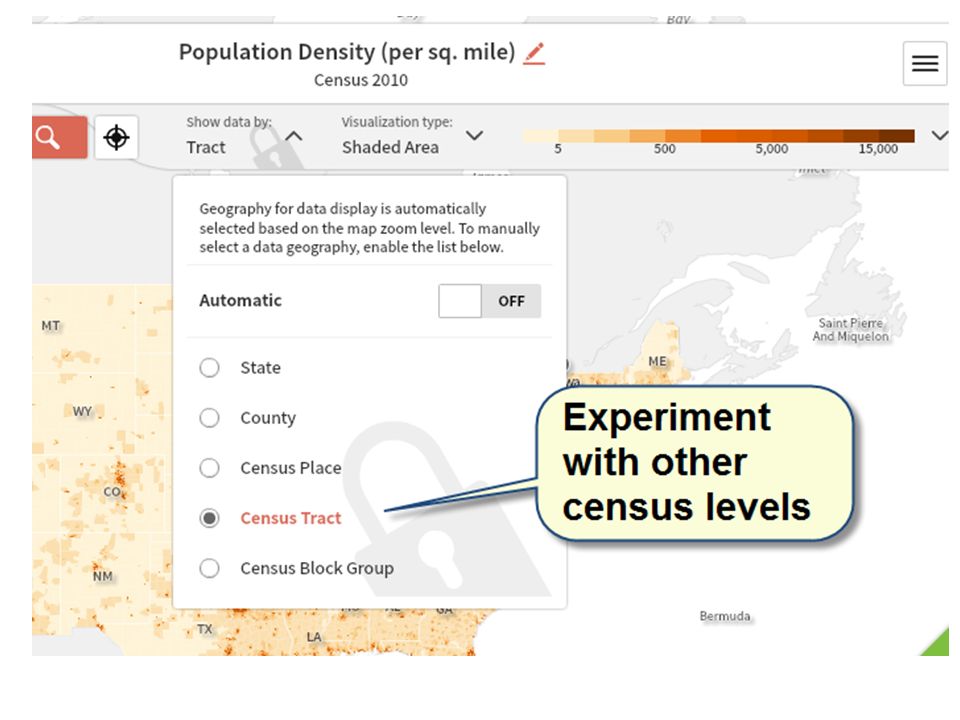
Census Tabulations The Census Bureau makes the data accessible by releasing tabulations tabulations are aggregations of the data in ways that are useful for most users The tabulations are for various levels of geography, e.g., Census block, blockgroup, tract City, County Metropolitan areas States

35
Census Geography

36
Census Blocks

37
Census Block Groups

38
Census Tracts

39
Neighborhood scale census geography levels: Blocks Average about 100 people In cities, these are often city blocks; farther out they are larger Block groups 300-1500 people Tracts 1000-8000 people

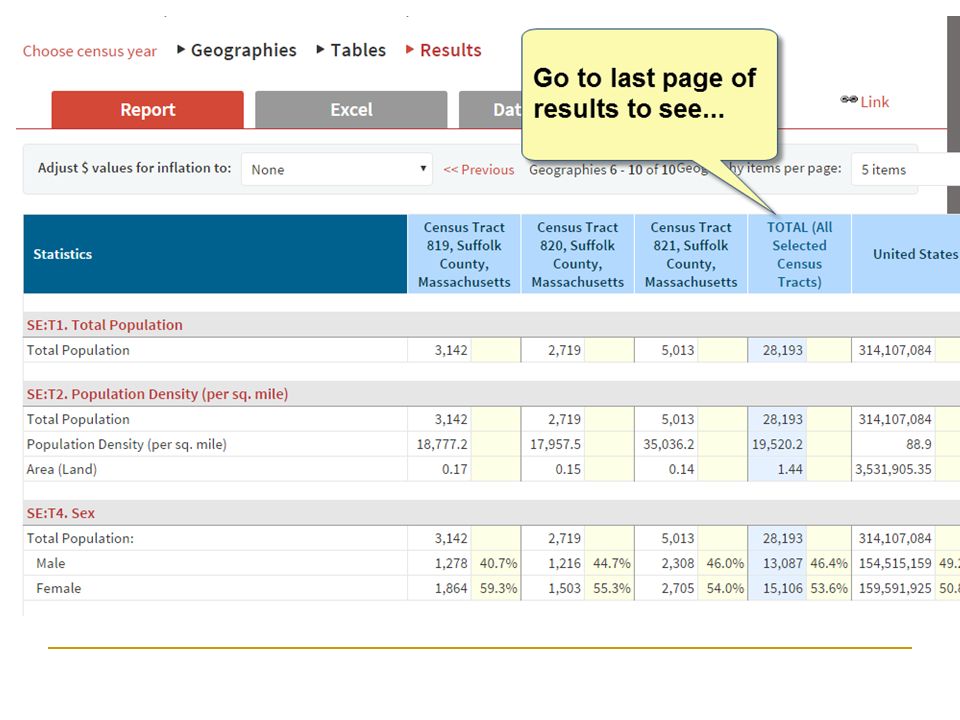
40
Census Blocks

41
Census Block Groups

42
Census Tracts

43
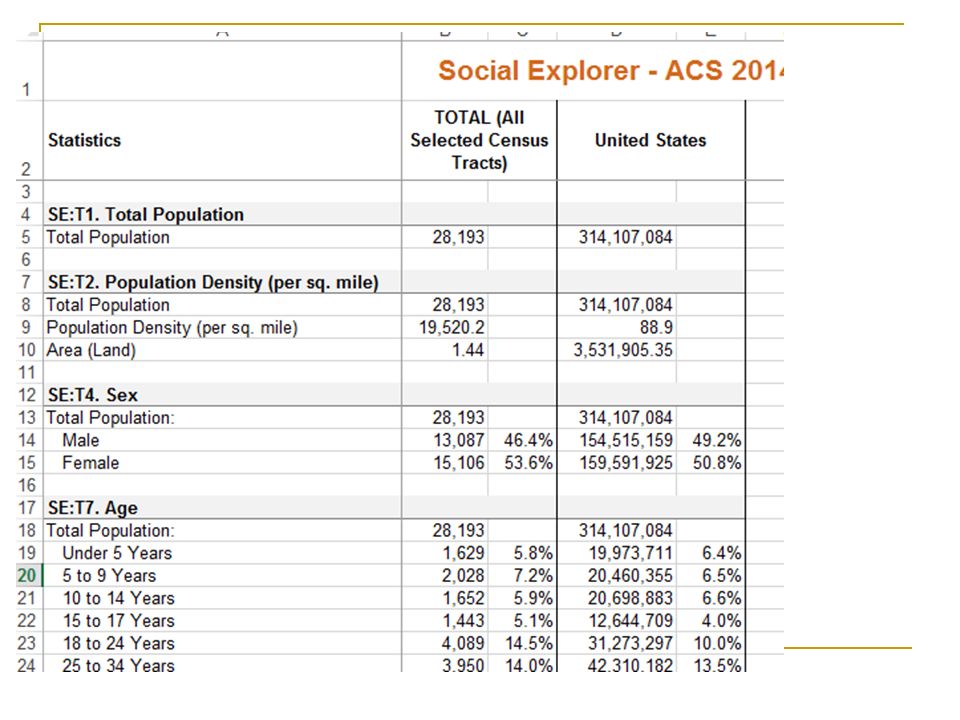
Census Geography

44
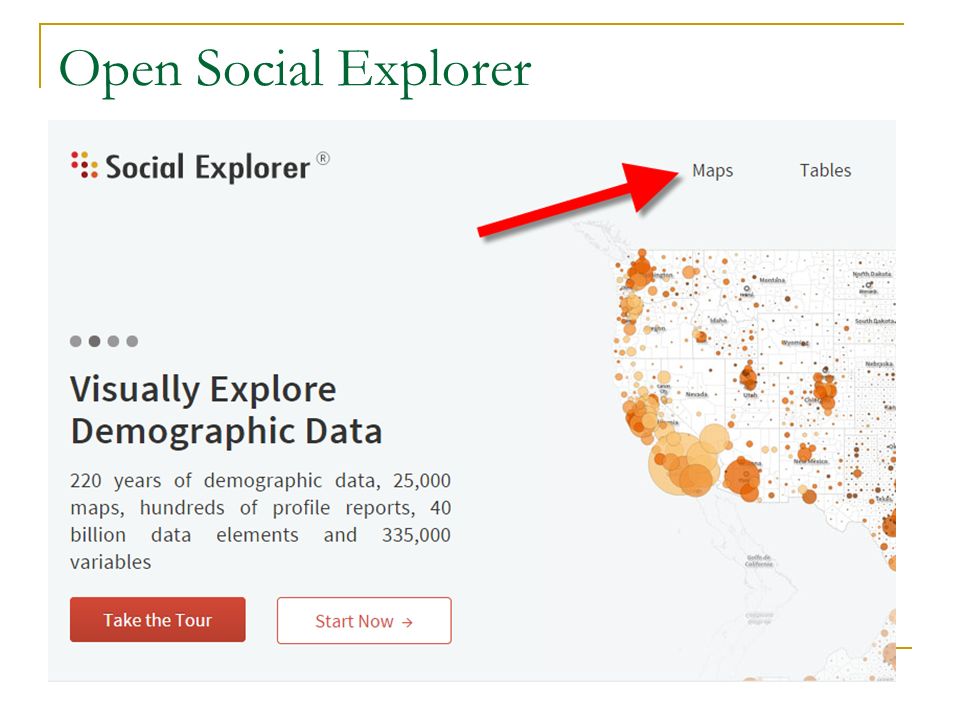
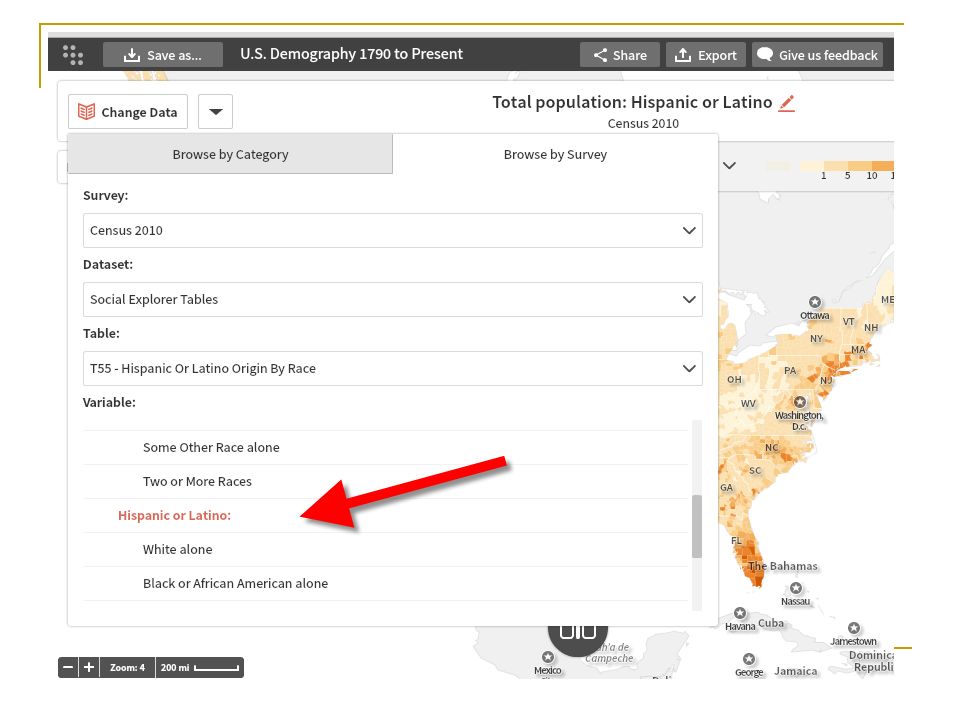
Open Social Explorer

68
So far, you’ve learned… The Decennial Census has fewer variables than the ACS Which kinds of data are covered in the Census vs. the ACS There are different levels of census geography

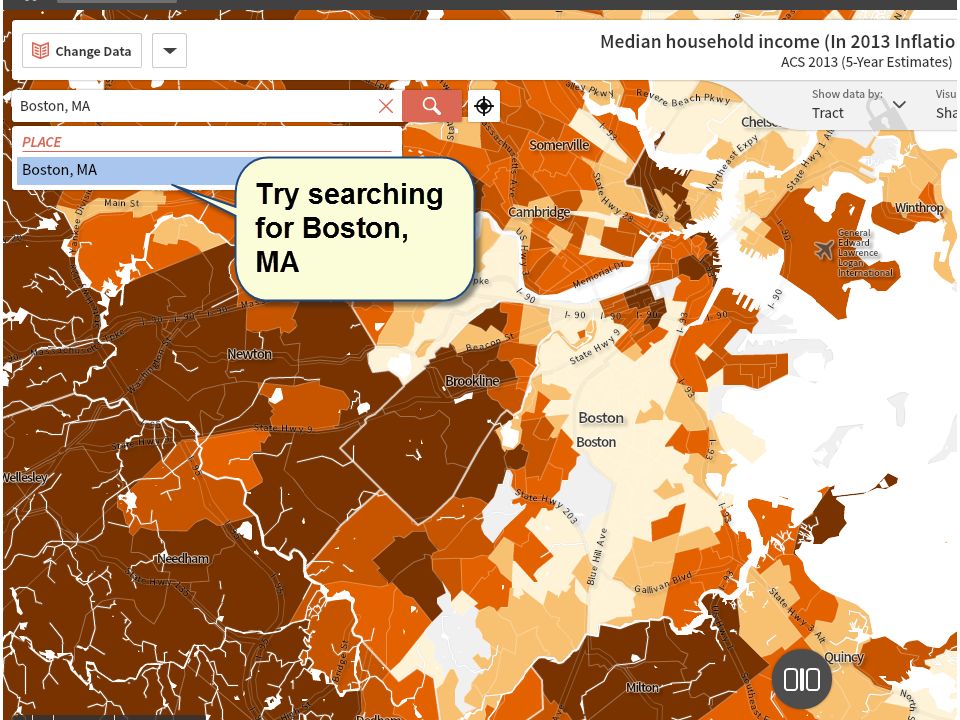
69
Making reports in Social Explorer Go back to Social Explorer Zoom in to Boston or another area

70
Things you can do: Create a series of maps (tell a story) Export to powerpoint Share a link Create a time series (tracts go back to 1940 in many cities) Create a tabular report in Excel
 Export to powerpoint Share a link Create a time series (tracts go back to 1940 in many cities) Create a tabular report in Excel")
71
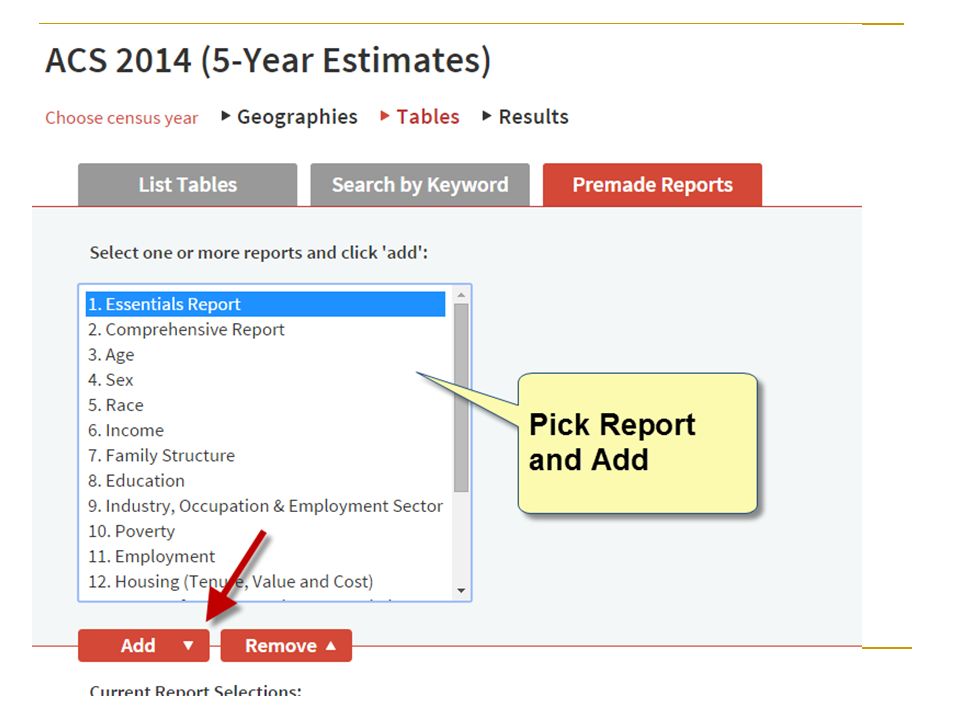
Create a report

72
Understand the interface…

76
Data for all selected tracts, totals at far end…

77
Totals only option…

78
To compare selected tracts with US or Massachusetts:

87
Experiment on your own! Try starting from the beginning…

88
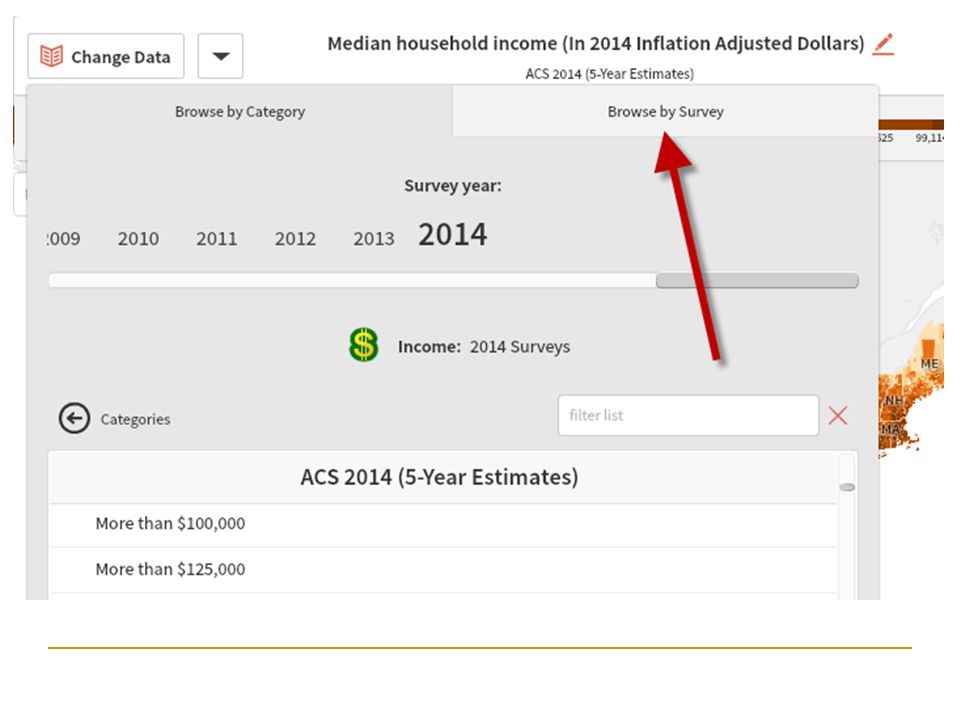
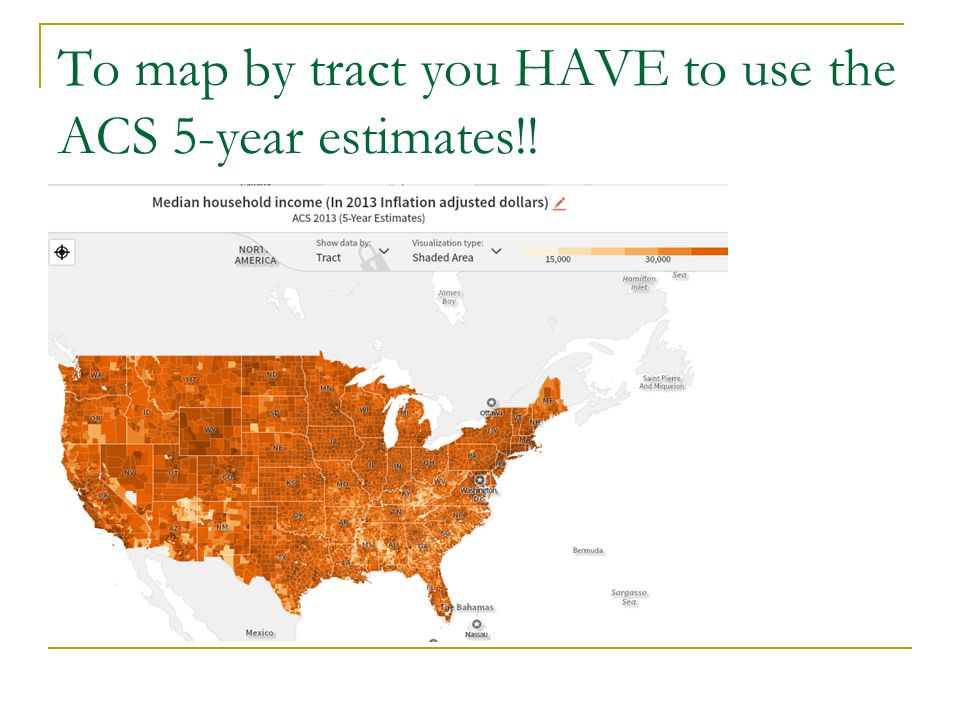
IMPORTANT: ACS Release Schedule – data is released as averages: 1 Year – areas with a population 65,000+ 3 Years – areas with a population 20,000+ 5 Years - all other areas (including census tracts and blockgroups) E.g., average median household income for 2009-2013 (released December, 2014)
 E.g., average median household income for (released December, 2014)")
89
Huh????

90
ACS is a monthly survey or a sample of households… You need a lot of responses for areas with small populations to have reliable data

92
IMPORTANT: ACS Release Schedule – data is released as averages: 1 Year – areas with a population 65,000+ 3 Years – areas with a population 20,000+ 5 Years - all other areas (including census tracts and blockgroups) E.g., average median household income for 2009-2013 (released December, 2014)
 E.g., average median household income for (released December, 2014)")
93
More counties are mapped…the ones with at least 20,000 people

94
IMPORTANT: ACS Release Schedule – data is released as averages: 1 Year – areas with a population 65,000+ 3 Years – areas with a population 20,000+ 5 Years - all other areas (including census tracts and blockgroups) E.g., average median household income for 2009-2013 (released December, 2014)
 E.g., average median household income for (released December, 2014)")
95
5-year estimates…

96
IMPORTANT: ACS Release Schedule – data is released as averages: 1 Year – areas with a population 65,000+ 3 Years – areas with a population 20,000+ 5 Years - all other areas (including census tracts and blockgroups) E.g., average median household income for 2008-2012 (released December, 2013)
 E.g., average median household income for (released December, 2013)")
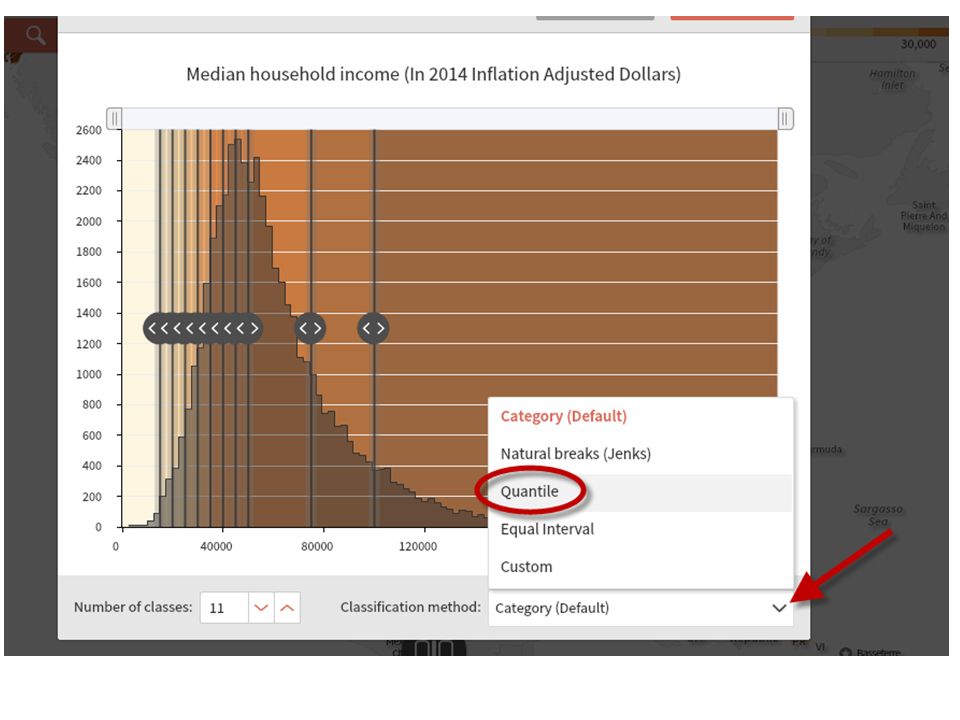
97
To map by tract you HAVE to use the ACS 5-year estimates!!

99
Warning: there is a BIG problem for neighborhood level analysis…

100
The decennial census data at the census block, block group and tract level is very reliable – why?

101
But the ACS is very problematic for those small areas. Why?

102
ACS and Margin of Error Means of transportation for commute – Tract Level - ACS 2005-2009 5 year estimates Universe is workers 16 and over Workers 16 and Over

103
So let’s understand sampling error…

104
What is Sampling Error? Definition The uncertainty associated with an estimate that is based on data gathered from a sample of the population rather than the full population 104

105
Illustration of Sampling Error Estimate average number of children per household for a population with 3 households living in a block: Household A has1 child Household B has2 children Household C has3 children The block average based on the full population is two children per household: (1+2+3)/3 105
/3 105")
106
Conceptualizing Sampling Error Three different samples of 2 households: 1. Households A and B (1 child, 2 children) 2. Households B and C (2 children, 3 children) 3. Households A and C (1 child, 3 children) Three different averages based on which sample is used: 1. (1 + 2) / 2 = 1.5 children 2. (2 + 3) / 2 = 2.5 children 3. (1 + 3) / 2 = 2 children 106
 2. Households B and C (2 children, 3 children) 3. Households A and C (1 child, 3 children) Three different averages based on which sample is used: 1. (1 + 2) / 2 = 1.5 children 2. (2 + 3) / 2 = 2.5 children 3. (1 + 3) / 2 = 2 children 106.")
107
Sampling Error Census 2010 is a 100% survey so has smaller error ACS data is based on samples – error is larger The smaller the geography, the larger the error (because the sample is smaller) Especially true for variables that sample a small number of people, e.g., bike commuters
 Especially true for variables that sample a small number of people, e.g., bike commuters")
108
ACS and Margin of Error Means of transportation for commute – Tract Level - ACS 2005-2009 5 year estimates Universe is workers 16 and over Workers 16 and Over

109
Bottom line for ACS vs. Census ACS has more up to date information Continuous (ACS) versus point in time measurement (Census) ACS - 5 year estimates are the most reliable because they have the largest samples But ACS has… Poorer precision at finer scales (e.g., census tract) or areas of low population (rural areas) Poorer precision for variables with low numbers (e.g., people who bike to work)
 versus point in time measurement (Census) ACS - 5 year estimates are the most reliable because they have the largest samples But ACS has… Poorer precision at finer scales (e.g., census tract) or areas of low population (rural areas) Poorer precision for variables with low numbers (e.g., people who bike to work).")
110
What have you learned?

111
Take home points There are two major Census Bureau products used for neighborhood analysis: The Decennial Census Basic data By block, block group, and tract Once a decade, one point in time The American Community Survey Lots of interesting data By block group and tract – may be unreliable at those levels! More up to date – 5-year rolling estimates

112
Policy Map is another mapping tool…

113
Census AND lots of other data from various agencies and organizations…

115
Also accessed through Tisch Library’s databases…

116
Take home points Social Explorer is a useful mapping, presentation, and reporting tool for current and historical census data Policy Map is another interesting tool for current and recent census data, as well as other policy-related data So far, only the Census web site via American Fact Finder will show the margin of error information

Similar presentations


 2005 Data Release.>")