Download presentation
Presentation is loading. Please wait.

1
Post Deyr ’10/11 January 24 th 2011 Integrated Nutrition Situation Analysis Middle and Lower Juba Regions Information for Better Livelihoods Food Security and Nutrition Analysis Unit Somalia EUROPEAN COMMISSION Swiss Agency for Development and Cooperation SDC

2
Main Livelihood Groups Sources of Food and Income 2 Agro-pastoral Livelihoods (Southern and Lower Juba Agro-pastoralists) Southern Agro-pastoral are more pastoral in the west than those in the east who are agriculturalists – main sources of income: sale of livestock & livestock products, self-employment, employment, crop sales; main source of food is purchase Lower Juba Agro-pastoral are more pastoralists than agriculturists – main source of income: sales of livestock products and wild food sales; main source of food: own production and purchases. Riverine (M. and L. Juba) Main source of income of poor : Crop sales, wage labour, self-employment (collection of bush products) Main sources of food of poor: Own production and market purchase Livelihood Groups & Main Sources of Food and Income 2 Pastoral Livelihoods Southeast- keep cattle sheep & goat Southern Inland- keep camel, sheep & goat Primary sources of income of poor: sale of livestock & livestock products Primary sources of food of poor: purchase Primary livelihood asset of poor: camel, cattle, sheep/goat
 Main source of income of poor : Crop sales, wage labour, self-employment (collection of bush products) Main sources of food of poor: Own production and market purchase Livelihood Groups & Main Sources of Food and Income 2 Pastoral Livelihoods Southeast- keep cattle sheep & goat Southern Inland- keep camel, sheep & goat Primary sources of income of poor: sale of livestock & livestock products Primary sources of food of poor: purchase Primary livelihood asset of poor: camel, cattle, sheep/goat.")
3
Outcome indicatorsMiddle and Lower Juba Pastoral, Summary of Findings Deyr’09/10, N=689Gu’10, N=1125Deyr’10/11 N=779 Child Nutrition status GAM (WHZ<-2 or oedema)23.5 (17.9-30.2)NA30.7 (2 6.1-35.7) WHZ meanNA 1.32±1.15 SAM (WHZ<-3 or oedema)>2.5 (Pro.90%)NA7.8 (5.8-10.5) Oedema0.40.1 1.2 (0.1-2.3) MUAC (<12.5 cm or oedema)12.6 (6.6-18.7)9.012.7 (9.7-15.2) MUAC (11.5 cm or oedema)NA2.0 1.6 (0.7-3.3) HIS Nutrition Trends High level & stable trend (Jul-Dec’09) Low (<10%) & decreasing(Jan- Jun’10) High (20%) and fluctuating trend Oct-Dec’10 TFPs/SFPs Admission trends High & stable numbers of admission Low and stable trends at OTP (Apr-June’10) )High and increasing number of admission (Oct-Dec’10) Crude death Rate/10,000/day (90days)2.20 (1.71-2.81)NA Under 5 death Rate/10,000/day (90days)3.01 (2.19-4.14)NA OVERALL NUTRITION SITUATIONVery CriticalLikely SeriousVery Critical Child Morbidity, Immunization, IYCF o Disease Oubreaks: o Morbidity based on 2wk recall Outbreak-425 AWD cases reported Dec’09 Morbidity – 57.7 AWD -827 cases reported in June’10 NA AWD 616 cases reported in Nov’10 Morbidity =21.8 o Immunization status/Vit. AMeasles: 61.7; Vit. A: 46.9NA o Children eating from <4 fdgpsN/ANA o Children meeting min. feeding freq.N/ANA Public Health Indicators; GenderN=395 NA o Households (HH) accessing safe water5.1NA o HH accessing sanitation facilities2.8NA o HH accessing health facilitiesN/ANA Gender : Relation between GAM & child sex Relation between GAM & sex of hh head Insignificant NA Food Security PhaseBFI/AFLCBFIBFI/AFLC Proportion of hh consuming <4 fd gpsN/AIncreased milk accessDecreased milk access Overall Risk to DeteriorationPOTENTIAL TO IMPROVE STABLEUNSTABLE
 accessing safe water5.1NA o HH accessing sanitation facilities2.8NA o HH accessing health facilitiesN/ANA Gender : Relation between GAM & child sex Relation between GAM & sex of hh head Insignificant NA Food Security PhaseBFI/AFLCBFIBFI/AFLC Proportion of hh consuming <4 fd gpsN/AIncreased milk accessDecreased milk access Overall Risk to DeteriorationPOTENTIAL TO IMPROVE STABLEUNSTABLE.")
5
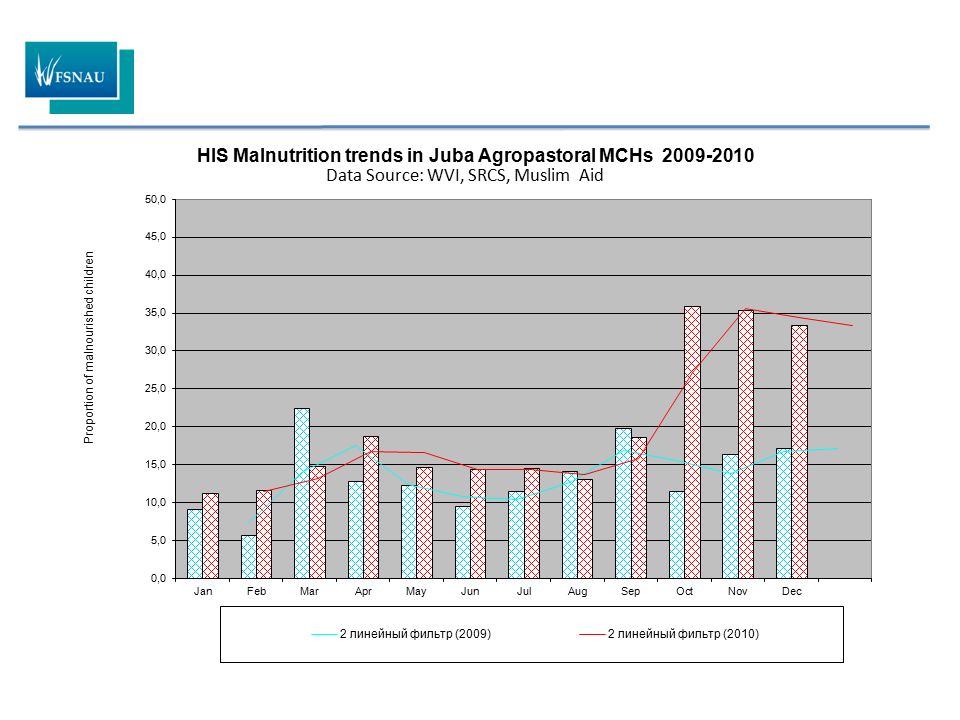
Outcome indicatorsMiddle and Lower Juba Agropastoral, Summary of Findings Deyr’09/10, N=203Gu’10, N=1167Deyr’10/11 N=850 Child Nutrition status o GAM (WHZ<-2 or oedema)>16.0 (Pro.90%)NA26.1 (21.9-30.9) o WHZ meanNA -1.22±1.12 o SAM (WHZ<-3 or oedema)>2.5 (Pro.90%)NA6.2(4.6-8.3) o Oedema00.3 0.2 (0.1-0.6) o MUAC (<12.5 cm or oedema)17.3 (11.4-23.3)10.612.8 (10.5-15.6) o MUAC (11.5 cm or oedema)NA2.50.5 (0.1-1.5) o HIS Nutrition TrendsHigh & stable trend (Jul-Dec’09) High (>10) & Stable trend (Jan- June’10) High (>20%) and fluctuating trend (Oct-Dec’10) o TFPs/SFPs Admission trendsHigh and stable trend of admission High & stable trend at OTP (Apr- May) High and stable admission trend (Oct-Dec’10) Crude death Rate/10,000/day (90days)N/ANA Under 5 death Rate/10,000/day (90days)N/ANA OVERALL NUTRITION SITUATIONCriticalLikely CriticalVery Critical Child Morbidity, Immunization, IYCF o Disease Oubreaks: o Morbidity based on 2wk recall Outbreak-425 AWD cases reported Dec’09; Morbidity – 567 AWD 827 cases in June’10 Morbidity – NA AWD 616 cases reported in Nov’10, suspected measles cases reported; Morbidity = 22.6 o Immunization status/Vit. AMeasles: 78.1; Vit. A: 89.4Measles: NA o Children eating from <4 fdgpsN/ANA o Children meeting min. feeding freq.N/ANA Public Health Indicators; GenderN=101 NA o Households (HH) accessing safe water16.2NA o HH accessing sanitation facilities40.0NA o HH accessing health facilitiesN/ANA o Relation between GAM & child sexSignificantNAInsignificant o Relation between GAM & sex of hh headInsignificantNA Food Security PhaseBFI/AFLCBFIAFLC Proportion of hh consuming <4 fd gpsN/AIncreased milk accessDecreased milk access Overall Risk to DeteriorationPOTENTIAL TO DETERIORATE STABLE UNSTABLE
 accessing safe water16.2NA o HH accessing sanitation facilities40.0NA o HH accessing health facilitiesN/ANA o Relation between GAM & child sexSignificantNAInsignificant o Relation between GAM & sex of hh headInsignificantNA Food Security PhaseBFI/AFLCBFIAFLC Proportion of hh consuming <4 fd gpsN/AIncreased milk accessDecreased milk access Overall Risk to DeteriorationPOTENTIAL TO DETERIORATE STABLE UNSTABLE.")
7
Outcome indicatorsMiddle and Lower Juba Riverine, Summary of Findings Deyr’09/10, N=203Gu’10, N=1312Deyr’10,/11 N=785 Child Nutrition status o GAM (WHZ<-2 or oedema)>12,2 (Pro.90%)NA29.7 (24.5-35.4) o WHZ meanNA -1.22±1.11 o SAM (WHZ<-3 or oedema)>4.6 (Pro.90%)NA6.4(4.6-8.8) o Oedema1.00.8 2.5 (1.5-3.5) o MUAC (<12.5 cm or oedema)21.7 (15.1-28.2) 18.5 Kismayo IDP-15.5 21.3 (17.2-26.0) Kismayo IDPs :12.4 o MUAC (<11.5 cm or oedema)5.5; Kismayo IDP- 3.23.6 Kismayo IDP =0.7 o HIS Nutrition Trends High (>15%) and stable trend (Jul-Dec’09) High (>20%) and fluctuating trend (Jan- June’10) High (>20%) and fluctuating trend (Oct- Dec’10) o TFPs/OTPs Admission trends High with increasing trend of admission High and increasing trend of admission (Jan-June’10 ) High and fluctuating admission trend (Oct- Dec’10) Crude death Rate/10,000/day (90days)N/A Under 5 death Rate/10,000/day (90days)N/A OVERALL NUTRITION SITUATIONSeriousLikely Very Critical Very Critical Child Morbidity, Immunization, IYCF o Disease Oubreaks: o Morbidity based on 2wk recall Outbreak-425 AWD cases reported Morbidity – 57.1 AWD-827 cases /measles/Malaria Morbidity – NA AWD 616 cases reported in Nov’10 Suspected measles outbreak reported Morbidity – 39.4 o Immunization status/Vit. AMeasles: 80.3; Vit. A: 70.4NA o Children eating from <4 fdgpsN/ANA o Children meeting min. feeding freq.N/ANA Public Health Indicators; GenderN=97 NA o Households (HH) accessing safe water29.9NA o HH accessing sanitation facilities36.1NA o HH accessing health facilitiesN/ANA Gender: Relation btn GAM & child sex Relation btn GAM & sex of hh headInsignificant NA Food Security Phase Proportion of hh consuming <4 fd gps BFI N/A ALFC /HE Reduced food access due to flood and insecurity HE Reduced food access due to drought and insecurity Overall Risk to DeteriorationSTABLEUNCERTAINUNSTABLE
 accessing safe water29.9NA o HH accessing sanitation facilities36.1NA o HH accessing health facilitiesN/ANA Gender: Relation btn GAM & child sex Relation btn GAM & sex of hh headInsignificant NA Food Security Phase Proportion of hh consuming <4 fd gps BFI N/A ALFC /HE Reduced food access due to flood and insecurity HE Reduced food access due to drought and insecurity Overall Risk to DeteriorationSTABLEUNCERTAINUNSTABLE.")
8
Data Source: WVI, SRCS, Muslim Aid

9
A Malnourished Child (marasmus-kwashiokor) Juba Pastoral LZ, Dec 2010
 Juba Pastoral LZ, Dec 2010")
10
Water Scarcity increases women labour and affects child & family feeding

11
Driving Factors Aggravating factors Reducing food access due to impact of floods, drought and insecurity Reduced labour/income opportunity due to loss of farm labour and decreasing livestock prices Increased food prices and reduced term of trade (labour-maize) Negative impact of withdrawal of INGO providing health and nutrition services High morbidity (suspected measles, persistent AWD) Restricted immunization activity due to insecurity Poor child feeding practices Poor access to sanitation facilities and safe water Reduced milk access due to livestock outmigration and weakened body livestock condition and production & avoidance of zakat Mitigating factors Increased charcoal burning for income (Short term benefits only) Social support from local community/Humanitarian (limited) Sale of fodder among the riverine communities for income
 Negative impact of withdrawal of INGO providing health and nutrition services High morbidity (suspected measles, persistent AWD) Restricted immunization activity due to insecurity Poor child feeding practices Poor access to sanitation facilities and safe water Reduced milk access due to livestock outmigration and weakened body livestock condition and production & avoidance of zakat Mitigating factors Increased charcoal burning for income (Short term benefits only) Social support from local community/Humanitarian (limited) Sale of fodder among the riverine communities for income")
12
Nutrition Situation Estimates - Juba Regional Maps Juba Regions Nutrition Situation Estimates, January 2011 Juba Regions Nutrition Situation Estimates, August 2010

13
The End

Similar presentations


 - Somalia.>")
