Download presentation
Presentation is loading. Please wait.

1
Post Deyr ’10/11 January 24 th 2011 Integrated Nutrition Situation Analysis Northeast & Central Regions Information for Better Livelihoods Food Security and Nutrition Analysis Unit Somalia EUROPEAN COMMISSION Swiss Agency for Development and Cooperation SDC

2
Livelihood zones in the Northeast Pastoral- Coastal Deeh, East Golis/Kakaar, Nugal Valley, Sool Plateau and Hawd and Addun, cutting across the Northeast and Central. IDPs – Galkayo, Garowe, Bossaso and Qardho

3
Pastoral- Hawd Pastoral LZ : Mainly involved in rearing of camel. Sheep and goats are of subsidiary Addun Pastoral LZ : Sheep rearing is most important. Goats and camel are subsidiary. Agro-pastoral Cowpea Belt Agro- pastoral LZ involved in production & sale of cowpea Coastal Deeh LZ: Sheep rearing and fishing Central Regions Livelihood Zones

4
Outcome indicators Galkayo IDP, Summary of Findings Deyr’09/10, N=615Gu’10, N=198Deyr’10/11, N=869 Child Nutrition status o GAM (WHZ<-2 or oedema) 23.7 (Pr=0.90 )>11.4(Pr=0.90)16.3(13.2-20.0) o SAM (WHZ<-3 or oedema) 6.3(Pr=0.90>1.2(Pr=0.90)2.9 (1.8-4.5) o Mean weight-for-height -1.400.610.81 o Oedema 00.0 o MUAC (<12.5 cm or oedema) 25.4(17.2-33.7)7.1(3.3-10.8)5.1(3.5-7.3) o MUAC (<11.5 cm or oedema -0.10.0 o HIS Nutrition Trends High levels and stableN/A o TFPs/SFPs Admission trends High number with increasing trendN/A Crude death Rate/10,000/day (90days)N/A 1.0(0.52-1.93) Under 5 death Rate/10,000/day (90days)N/A 1.5(0.65-3.5) OVERALL NUTRITION SITUATIONVery CriticalSeriousCritical Child Morbidity, Immunization, IYCF o Disease Outbreaks: o Morbidity based on 2wk recall No Outbreak Morbidity– 47.1 No Outbreak Morbidity-46.9 No Outbreak Morbidity-43.4(35.9-50.8) o Immunization status/Vit. A Vit A : 89.2 Measles –: 85.6Measles:91.9: Vit A:95.5Measles:83.5: Vit A:81.6 o Children eating from <4 fdgps N/A 27.1(13.9-40.2)15 (4.3-25.7) o Children meeting min. feeding freq. N/A 26.0(14.3-37.7)8.7(6.3-11.4) Public Health Indicators;N=95N=480 o Households (HH) accessing safe water 94.894.765.4 (47.2-83.6) o HH accessing sanitation facilities 81.071.338.1(20.3-56.0) Gender o Relation between GAM & child sex o Relation between GAM & sex of hh head Insignificant Food Security Phase Proportion of hh consuming <4 fd gps N/A 1.1 N/A 12.1 Overall Risk to DeteriorationPotential to deteriorate UNSTABLE Deterioating
15 ( ) o Children meeting min. feeding freq. N/A 26.0( )8.7( ) Public Health Indicators;N=95N=480 o Households (HH) accessing safe water ( ) o HH accessing sanitation facilities ( ) Gender o Relation between GAM & child sex o Relation between GAM & sex of hh head Insignificant Food Security Phase Proportion of hh consuming <4 fd gps N/A 1.1 N/A 12.1 Overall Risk to DeteriorationPotential to deteriorate UNSTABLE Deterioating.")
5
Outcome indicatorsBossaso IDP, Summary of Findings Deyr’09/10, N=210Gu’10, N=210Deyr’10/11, N=749 Child Nutrition status o GAM (WHZ<-2 or oedema) 17.5 (Pr=0.90>26 (Pr=0.90)15.6 (12.7-19.1) o SAM (WHZ<-3 or oedema) 5.5 (Pr=0.90)>3.3(Pr=0.90)2.8 (1.6-4.8) o Mean weight-for-height -1.13-1.35-0.9 o Oedema 1.3(Pr=0.90)0.00.4 o MUAC (<12.5 cm or oedema) 14.8(9.20.3) 23.0(16.3-29.7)15.1(11.9-18.3) o MUAC (<11.5 cm or oedema) 8.1(4.1-12.2)4.3(2.6-6.0) o HIS Nutrition Trends High (>20%) & Stable(July – Dec’09) High (>15%) & Stable(Jan- Jun’09) High (>20%) & Stable( o TFPs/SFPs Admission trends High levels and fluctuating High levels -OTP admissions-in Bossaso n=1084,(Jan-May ’10) High levels -OTP admissions- Crude death Rate/10,000/day (90days)N/A 0.15(0.05-0.42) Under 5 death Rate/10,000/day (90days)N/A 1.24(0.51-2.99) OVERALL NUTRITION SITUATIONCriticalVery critical Critical Child Morbidity, Immunization, IYCF o Disease Outbreaks: o Morbidity based on 2wk recall No outbreaks Morbidity –53.8 No outbreaks Morbidity-72.2 No outbreaks Morbidity-62.5 o Immunization status/Vit. A Vit. A 94.7 ;Measles - 92.8Measles:89.5: Vit A: 92.8Measles:91.2: Vit A: 94.5 o Children eating from <4 fdgps N/A48.39.0 o Children meeting min. feeding freq. N/A57.530.9 Public Health Indicators;N=478N=107N=494 o Households (HH) accessing safe water 19.062.628.5 o HH accessing sanitation facilities 44.88660.7 Gender Relation between GAM & child sex Relation between GAM & sex of hh head Insignificant Food Security Phase Proportion of hh consuming <4 fd gps N/A N/A 17.8 N/A 8.5 Overall Risk to DeteriorationPotential to deteriorate Potential to deteriorate in upcoming season
 accessing safe water o HH accessing sanitation facilities Gender Relation between GAM & child sex Relation between GAM & sex of hh head Insignificant Food Security Phase Proportion of hh consuming <4 fd gps N/A N/A 17.8 N/A 8.5 Overall Risk to DeteriorationPotential to deteriorate Potential to deteriorate in upcoming season.")
8
Outcome indicatorsGarowe IDP, Summary of Findings Gu’09, N= 460Gu’10, N=198 Deyr’10/11, N=761 Child Nutrition status o GAM (WHZ<-2 or oedema) 24.5>11.5%(Pr=0.90 13.3 (11.0-15.9) o SAM (WHZ<-3 or oedema) 6.5>3.0%(Pr=0.90) 2.5 (1.6-3.9) o Mean weight-for-height N/A-0.96 o Oedema 0.0 0.1 o MUAC (<12.5 cm or oedema) 14.811.1(5.5-16.7) 9.6 (7.0-12.9) o MUAC (<11.5 cm or oedema) N/A 2.0(0.1-4.5) 0.4(0.1-1.2) o HIS Nutrition Trends N/A o TFPs/SFPs Admission trends N/A High levels -OTP admissions-in Crude death Rate/10,000/day (90days)N/A 0.24(0.10-0.60) Under 5 death Rate/10,000/day (90days)N/A 0.41(0.13-1.33) OVERALL NUTRITION SITUATION Very CriticalSerious Child Morbidity, Immunization, IYCF o Disease Oubreaks: o Morbidity based on 2wk recall No outbreak Disease Morbidity 57.4 No outbreak Disease Morbidity- 35.4 No outbreak Disease Morbidity-40.5 o Immunization status/Vit. A Vit. A: 67 Measles: 68 Measles:94.4: Vit A:95.9 Measles:79.2 Vit A: 84.2 o Children eating from <4 fdgps -12.9 6.9 o Children meeting min. feeding freq. -29.8 9.2 Public Health Indicators; N=88 N=468 Households (HH) accessing safe water 29.4 46.5 41.7 o HH accessing sanitation facilities 31.788.6 35.8 Gender o Relation between GAM & child sex o Relation between GAM & sex of hh head Insignificant Food Security Phase Proportion of hh consuming <4 fd gps N/A 33.3 N/A 2.1 N/A 8 Overall Risk to DeteriorationUNSTABLE UNSTABLE
 accessing safe water o HH accessing sanitation facilities Gender o Relation between GAM & child sex o Relation between GAM & sex of hh head Insignificant Food Security Phase Proportion of hh consuming <4 fd gps N/A 33.3 N/A 2.1 N/A 8 Overall Risk to DeteriorationUNSTABLE UNSTABLE.")
9
Qardho IDP, Summary of Findings Outcome indicators Deyr’10/11, N=214 Child Nutrition status o GAM (WHZ<-2 or oedema) >10.6(Pr=0.90) o SAM (WHZ<-3 or oedema) >2.7(Pr=0.90) o Mean weight-for-height -0.65 o Oedema 0.5 o MUAC (<12.5 cm or oedema) 13.2(16.3-29.7) o MUAC (<11.5 cm or oedema) 8.1(4.1-12.2) o HIS Nutrition Trends N/A o TFPs/SFPs Admission trends N/A OVERALL NUTRITION SITUATIONSerious Child Morbidity, Immunization, IYCF o Disease Outbreaks: o Morbidity based on 2wk recall Morbidity-9.8 Diarrhea 9.8, ARI. 3.7% o Immunization status/Vit. A Measles :63.5 Vit A: 91.1%, o Children eating from <4 fdgps N/A o Children meeting min. feeding freq. N/A Public Health Indicators; o Households (HH) accessing safe water N/A o HH accessing sanitation facilities N/A Gender o Relation between GAM & child sex o Relation between GAM & sex of hh head N/A Food Security Phase Proportion of hh consuming <4 fd gps AFLC N/A Overall Risk to DeteriorationRisk to deteriorate
 accessing safe water N/A o HH accessing sanitation facilities N/A Gender o Relation between GAM & child sex o Relation between GAM & sex of hh head N/A Food Security Phase Proportion of hh consuming <4 fd gps AFLC N/A Overall Risk to DeteriorationRisk to deteriorate.")
10
Outcome indicatorsHAWD Livelihood Zone, Summary of Findings Deyr’09/10, N=580Gu’10, N=647Deyr’10/11, N=593 Child Nutrition status o GAM (WHZ<-2 or oedema) 19.1 (15.3 - 23.0)15.3(12.02-18.6) 13.0(10.4-16.2) o SAM (WHZ<-3 or oedema) 4.3 (2.7 - 5.9)3.9(1.6-6.1)2.9(1.8-4.7) o Mean weight-for- height -1.05-0.89-0.76 o Oedema 0.2 (0.0-0.5)0.3(0.1-0.9)0.3 o MUAC (<12.5 cm or oedema) 6.7 (4.1 - 9.3)6.0(3.4-8.6)3.7(2.5-5.4) o MUAC (<11.5 cm or oedema) 1.08 (0.2 – 1.96)1.7(0.8-3.3) o HIS Nutrition Trends High levels and stable (Jul- Dec’09) Low proportion but increasing trends o TFPs/SFPs Admission trends High and stable ( July-Dec’09Higth levels and stable(Jan-June 09Higth levels and stable Crude death Rate/10,000/day (90days)0.90 (0.60 – 1.36)1.07(0.64-1.79)0.3(0.14-0.62) Under 5 death Rate/10,000/day (90days)2.00 (0.94 – 4.24)1.78(0.74-4.21)0.62(0.21-1.92) OVERALL NUTRITION SITUATIONCritical Serious Child Morbidity, Immunization, IYCF o Disease Oubreaks: o Morbidity based on 2wk recall Outbreak – 182 AWD cases Morbidity– 50.5 No outbreak Morbidity-58.4 No outbreak Morbidity-34.6 o Immunization status/Vit. A Vit.A -61.7 Measles – 55.0Measles;51.3: VitA;48.6Measles;58.3: VitA;48.6 o Children eating from <4 fdgps N/A 48.77.8 o Children meeting min. feeding freq. 27.739.740.6 Public Health Indicators;N=333N=378N=336 o Households (HH) accessing safe water 50.531.730.9 o HH accessing sanitation facilities 52.950.061.7 Gender o Relation between GAM & child sex o Relation between GAM & sex of hh head Insignificant Food Security Phase Proportion of hh consuming <4 fd gps HE /AFLC 4.5 HE /AFLC 0.8 HE /AFLC 0.8 Overall Risk to Deteriorationpotential to improveSTABLE POTENTIAL TO DETERIOATE
 accessing safe water o HH accessing sanitation facilities Gender o Relation between GAM & child sex o Relation between GAM & sex of hh head Insignificant Food Security Phase Proportion of hh consuming <4 fd gps HE /AFLC 4.5 HE /AFLC 0.8 HE /AFLC 0.8 Overall Risk to Deteriorationpotential to improveSTABLE POTENTIAL TO DETERIOATE.")
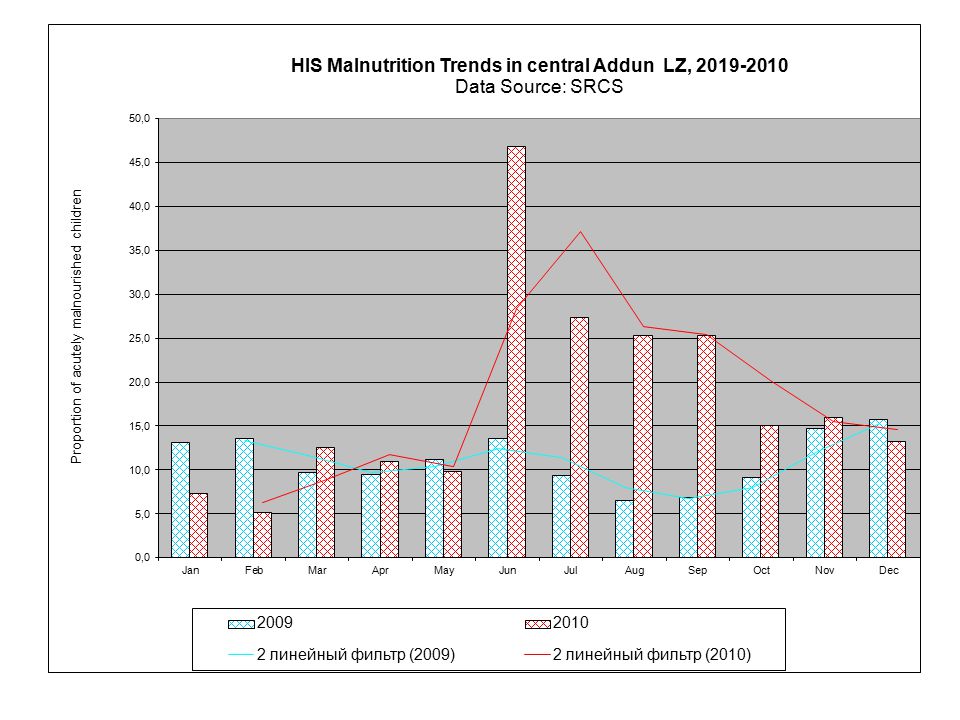
13
Outcome indicatorsADDUN Livelihood Zone, Summary of Findings Deyr’09/10, N=615Gu’10, N=667Deyr’10/11, N=591 Child Nutrition status o GAM (WHZ<-2 or oedema) 20.2(15.6-24.7)22.8(19.2-27.0) 11.0 (7.7-15.5) o SAM (WHZ<-3 or oedema) 4.6 (2.8-6.3)7.1(4.7-10.5)2.5 (1.3-5.1) o Mean weight-for-height -0.94-1.07-0.70 o Oedema 0.5 (0.0-1.0)0.0 o MUAC (<12.5 cm or oedema) 5.7 (3.1-8.2)5.2(2.7-7.8)2.8(0.2-5.4) o MUAC (<11.5 cm or oedema) 0.9 (0.1-1.7)0.6(0.0-1.3) o HIS Nutrition Trends High (>20%) & increasing trend Low proportion but increasing trends,Jan-June,10 Low proportion but increasing trends in NE and High >15%and decreasing trends in Central Jan-Dec,10 o TFPs/SFPs Admission trends High & increasing trend at OTP High OTP admission(235), Jan- May’10 Crude death Rate/10,000/day (90days)0.93 (0.38-2.28)0.52(0.30-0.829)0.71(0.41-1.20) Under 5 death Rate/10,000/day (90days)0.61(0.38-0.97)1.74((0.88-3.41)1.91(0.93-3.87) OVERALL NUTRITION SITUATIONCritical Very Critical Serious Child Morbidity, Immunization, IYCF o Disease Oubreaks: o Morbidity based on 2wk recall No outbreak Morbidity – 46.3% No outbreaks Morbidity45.4 No outbreaks Morbidity:32.8 o Immunization status/Vit. A Measles: 44.5; Vit. A: 40.4Measles:51.4, VitA:45.6Measles:71.7;VitA:74.7 o Children eating from <4 fdgps N/A13.85.3 o Children meeting min. feeding freq. N/A 46.359.4 Public Health Indicators;N=501 N=354 o Households (HH) accessing safe water 20.736.935.1 o HH accessing sanitation facilities 48.739.954.3 Gender o Relation between GAM & child sex o Relation between GAM & sex of hh head Insignificant Significant Insignificant Food Security Phase Proportion of hh consuming <4 fd gps HE 9.2 HE /AFLC 4.8 HE /AFLC 5.5 Overall Risk to Deterioration POTENTIAL TO DETERIOATE Uncertain POTENTIAL TO DETERIOATE
 accessing safe water o HH accessing sanitation facilities Gender o Relation between GAM & child sex o Relation between GAM & sex of hh head Insignificant Significant Insignificant Food Security Phase Proportion of hh consuming <4 fd gps HE 9.2 HE /AFLC 4.8 HE /AFLC 5.5 Overall Risk to Deterioration POTENTIAL TO DETERIOATE Uncertain POTENTIAL TO DETERIOATE.")
16
Outcome indicatorsEast Golis Livelihood Zone, Summary of Findings Deyr’09/10, N=213Gu’10, N=214Deyr’10/11, N=659 Child Nutrition status o GAM (WHZ<-2 or oedema) 8.2% (Pr= 0.90)>16.3(Pr 0.90)11.1(8.0-15.1) o SAM (WHZ<-3 or oedema) 0.3% (Pr= 0.90)>1.7(Pr 0.90)2.1(1.2-3.9) o Mean weight- for- height -0.53 o Oedema 0.5 (0.1-0.6)00.3 o MUAC (<12.5 cm or oedema) 1.7 (0.8-3.1)5.1 (2.0-8.3)5.8 (3.8-8.6) o MUAC (<11.5 cm or oedema) 0.5 (0.0-1.4)0.3 (0.0-2.4) o HIS Nutrition Trends High proportion &increasing trend (Jul-Dec’09) Low proportion and increasing trend Jan-june10 Low proportion and stable TFPs/SFPs Admission trendsN/A Crude death Rate/10,000/day (90days)N/A 0.13(0.05-0.33) Under 5 death Rate/10,000/day (90days) N/A 0.30(0.07-1.20) OVERALL NUTRITION SITUATIONSeriousCriticalSerious Child Morbidity, Immunization,IYCF o Disease Oubreaks: o Morbidity based on 2wk recall No outbreak Morbidity – 19.8% No outbreak Morbidity -38.3% No outbreak Morbidity -43.1% o Immunization status/Vit. A Measles: 82% ; Vit. A: 83.1%Measles: 72.9; Vit. A: 86.9Measles: 77.1; Vit. A: 80.9 Children eating from <4 fdgps N/A 2.0 o Children meeting min. feeding freq. N/A 35.0 Public Health Indicators;N/A o Households (HH) accessing safe water N/A 49.8 o HH accessing sanitation facilities N/A 61.7 Gender o Relation between GAM & child sex o Relation between GAM & sex of hh head Insignificant Food Security Phase Proportion of hh consuming <4 fd grps BFI 10.3 AFLC N/A AFLC 6.7 Overall Risk to Deterioration POTENTIAL TO DETERIOATE
 accessing safe water N/A 49.8 o HH accessing sanitation facilities N/A 61.7 Gender o Relation between GAM & child sex o Relation between GAM & sex of hh head Insignificant Food Security Phase Proportion of hh consuming <4 fd grps BFI 10.3 AFLC N/A AFLC 6.7 Overall Risk to Deterioration POTENTIAL TO DETERIOATE.")
18
Outcome indicatorsNugal Livelihood Zone, Summary of Findings Deyr’09/10, N=198Gu’10, N=200Deyr’10/11, N=516 Child Nutrition status o GAM (WHZ<-2 or oedema) >9.2(Pr.0.90)>8.8(Pr.0.90)10.3(7.0-14.8) o SAM (WHZ<-3 or oedema) >1.7(Pr.0.90)>0.6(Pr.0.90)1.0(0.4-2.3) o Mean weight- for height -0.63 o Oedema 0.0 o MUAC (<12.5 cm or oedema) 5.0(2.2-7.4) 2.0 (0.1-3.9)4.2 (2.5-6.0) o MUAC (<11.5 cm or oedema) 1.0(0.0-2.4)1.2(0.3-2.0) o HIS Nutrition Trends Low proportion but increasing trends,July-Aug,’10 Low and decreasing trend,Jan – June’10 Low <5% and increasing o TFPs/SFPs Admission trends High & increasing trend at OTP High OTP admission(235), Jan- High OTP admission Crude death Rate/10,000/day (90days)0.93 (0.38-2.28)0.52(0.30-0.829)0.71(0.41-1.20) Under 5 death Rate/10,000/day (90days)0.61(0.38-0.97)1.74((0.88-3.41)1.91(0.93-3.87) OVERALL NUTRITION SITUATIONSeriousAlertSerious Child Morbidity, Immunization, IYCF o Disease Outbreaks: o Morbidity based on 2wk recall No outbreaks Morbidity 21.5 No outbreak Morbidity 40.4 o Immunization status/Vit. A N/AMeasles :55.5; Vit.A;59.5Measles :55.3; Vit.A;52.5 o Children eating from <4 fdgps N/A o Children meeting min. feeding freq. N/A 22.3 o Public Health Indicators; o Households (HH) accessing safe water N=302 19.9 o HH accessing sanitation facilities N/A 30.3 Gender o Relation between GAM & child sex o Relation between GAM & sex of hh head Insignificant Food Security PhaseBFIAFLC Proportion of hh consuming <4 fd gps N/A 17.3 Overall Risk to DeteriorationPotential to deteriorate STABLEPOTENTIAL TO DETERIOATE
 accessing safe water N= o HH accessing sanitation facilities N/A 30.3 Gender o Relation between GAM & child sex o Relation between GAM & sex of hh head Insignificant Food Security PhaseBFIAFLC Proportion of hh consuming <4 fd gps N/A 17.3 Overall Risk to DeteriorationPotential to deteriorate STABLEPOTENTIAL TO DETERIOATE.")
20
Outcome indicatorsSool Plateau Livelihood Zone, Summary of Findings Deyr’09/10, N=198Gu’10, N=200 Deyr 2010/11 N= 637 Child Nutrition status o GAM (WHZ<-2 or oedema) >7.1(Pr=0.90)>5.0 (Pr 0.90) 8.3 (6.0-11.4) o SAM (WHZ<-3 or oedema) >2 (Pr=0.90)>0.6 (Pr 0.90) 1.6 (0.8-3.1) o Mean weight- for- height -0.46 o Oedema 0.5 (0.0-1.0)0 0.6 o MUAC (<12.5 cm or oedema) 5.7 (3.1-8.2)2.0 (0.7-4.0) 2.9 (1.7-5.0) o MUAC (<11.5 cm or oedema) 0 1.3 (0.5-3.1) o HIS Nutrition Trends Low proportion and stable 10-15% and stable trend o TFPs/SFPs Admission trends N/A Increasing trend Crude death Rate/10,000/day (90days)N/A 0.45 (0.25-0.80) Under 5 death Rate/10,000/day (90days)N/A 1.11( 0.49-2.47) OVERALL NUTRITION SITUATIONAlert Child Morbidity, Immunization, IYCF o Disease Oubreaks: o Morbidity based on 2wk recall No outbreak Morbidity – 22.6 No outbreak Morbidity -19.5 No outbreaks 48.9 Diarrhoea- 19.4 Pneumonia – 18.0 o Immunization status/Vit. A N/AMeasles: 69.5; Vit. A: 78.5 Vit A – 60.6, Measles- 68.9 o Children eating from <4 fdgps N/A 24.3 o Children meeting min. feeding freq. N/A 47.6 Public Health Indicators;N=373 o Households (HH) accessing safe water 20.7N/A 22.4 o HH accessing sanitation facilities 48.7N/A 66.1 Gender o Relation between GAM & child sex o Relation between GAM & sex of hh head Insignificant Food Security Phase Proportion of hh consuming <4 fd gps BFI 9.7 BFI HE 10.1 Overall Risk to DeteriorationPotential to improve STABLE
 accessing safe water 20.7N/A 22.4 o HH accessing sanitation facilities 48.7N/A 66.1 Gender o Relation between GAM & child sex o Relation between GAM & sex of hh head Insignificant Food Security Phase Proportion of hh consuming <4 fd gps BFI 9.7 BFI HE 10.1 Overall Risk to DeteriorationPotential to improve STABLE.")
22
Outcome indicatorsCoastal Deeh Livelihood Zone, NEZ, Summary of Findings Deyr’09/10, N= 198Gu’10, N=199Deyr’10/11, N=670 Child Nutrition status o GAM (WHZ<-2 or oedema) >6.9(Pr=0.90)>10.8(Pr=0.90)12.5 (10.5-14.9) o SAM (WHZ<-3 or oedema) >2.0(Pr=0.90)>2.2(Pr.0.90)2.8(1.7-4.6) o Mean weight- for height -0.66 o Oedema 00.00.6 o MUAC (<12.5 cm or oedema) 4.5 6.5(2.9-10.1) o MUAC (<11.5 cm or oedema) 2.5(0.4-4.6) o HIS Nutrition Trends <10% and Stable <10% and stableN/A Crude death Rate/10,000/day (90days)N/A 0.38(0.20-0.70) Under 5 death Rate/10,000/day (90days)N/A 1.01(0.51-2.0) OVERALL NUTRITION SITUATIONAlertSerious Child Morbidity, Immunization, IYCF o Disease Oubreaks: o Morbidity based on 2wk recall Morbidity 10.7 No outbreak Morbidity- 23.7 No outbreak Morbidity- 46.2 o Immunization status/Vit. A Vit.A 69.6;Measles -66Measles ;86.4 ;Vit A:94.5Measles ;79.3;Vit A: o Households (HH) accessing safe water N/APoor water and sanitation67.4 o HH accessing sanitation facilities N/A 61.5 Gender o Relation between GAM & child sex o Relation between GAM & sex of hh head Insignificant Food Security Phase Proportion of hh consuming <4 fd gps BFI AFLC Poor diet, no milk available HE 2.4 Overall Risk to DeteriorationPotential to deteriorateStablePotential to deteriorate
 accessing safe water N/APoor water and sanitation67.4 o HH accessing sanitation facilities N/A 61.5 Gender o Relation between GAM & child sex o Relation between GAM & sex of hh head Insignificant Food Security Phase Proportion of hh consuming <4 fd gps BFI AFLC Poor diet, no milk available HE 2.4 Overall Risk to DeteriorationPotential to deteriorateStablePotential to deteriorate.")
23
Outcome indicators - Coastal Deeh Livelihood Zone, Central, Summary of Findings Deyr’09/10, N= 198 -Gu’10, N=199Deyr’10/11, N=648 Child Nutrition status o GAM (WHZ<-2 or oedema) >6.9(Pr=0.90)>10.8(Pr=0.90)N/A o SAM (WHZ<-3 or oedema) >2.0(Pr=0.90)>2.2(Pr.0.90)N/A o Mean weight-for-height N/A o Oedema 00.00 o MUAC (<12.5 cm or oedema) 4.5 6.5(2.9-10.1)12.3 o MUAC (<11.5 cm or oedema) 2.5(0.4-4.6)3.0 o HIS Nutrition Trends <10% and Stable <10% and stableHigh and increasing Crude death Rate/10,000/day (90days)N/A Under 5 death Rate/10,000/day (90days)N/A OVERALL NUTRITION SITUATIONAlertSeriousCritical Child Morbidity, Immunization, IYCF o Disease Oubreaks: o Morbidity based on 2wk recall Morbidity 10.7 No outbreak Morbidity- 23.7 No Outbreak o Immunization status/Vit. A Vit.A 69.6;Measles -66Measles ;86.4 ;Vit A:94.5N/A o Households (HH) accessing safe water N/APoor water and sanitation o HH accessing sanitation facilities N/A Gender o Relation between GAM & child sex o Relation between GAM & sex of hh head Insignificant N/A Food Security Phase Proportion of hh consuming <4 fd gps BFI AFLC Poor diet, no milk available HE Overall Risk to DeteriorationPotential to deteriorateStablePotential t risk to deteriorate With deteriorating food security
 accessing safe water N/APoor water and sanitation o HH accessing sanitation facilities N/A Gender o Relation between GAM & child sex o Relation between GAM & sex of hh head Insignificant N/A Food Security Phase Proportion of hh consuming <4 fd gps BFI AFLC Poor diet, no milk available HE Overall Risk to DeteriorationPotential to deteriorateStablePotential t risk to deteriorate With deteriorating food security.")
25
Outcome indicatorsCowpea Central Livelihood Zone, Summary of Findings Deyr’09/10, N=643Gu’10, N=550Deyr’10, N=467 Child Nutrition status o GAM (WHZ<-2 or oedema) 12.5% (9.8-15.2)N/A o SAM (WHZ<-3 or oedema) 3.5% (2.2-4.9)N/A o Mean weight-for-height N/A o Oedema 000 o MUAC (<12.5 cm or oedema) 4.711.314.3 o MUAC (<11.5 cm or oedema) 2..33.0 o HIS Nutrition Trends High and stable proportionHigh and decreasing trend sHigh and Stable OVERALL NUTRITION SITUATIONSeriousCritical Child Morbidity, Immunization, IYCF o Disease Oubreaks: o Morbidity based on 2wk recall No Outbreak Morbidity-43.3 No outbreak N/A No outbreak N/A o Immunization status/Vit. A Measles : 38.2; Vit. A: 40.7;N/A Public Health Indicators;N=501 o Households (HH) accessing safe water 20.7 Poor water and sanitation o HH accessing sanitation facilities 48.7Limited o Relation between GAM & child sex o Relation between GAM & sex of hh head Insignificant N/A Food Security Phase Proportion of hh consuming <4 fd gps HE 9.2 HE/AFLC Low milk consumption HE/AFLC Low milk consumption Overall Risk to DeteriorationPotential to deteriorate StableDeteriorating
 accessing safe water 20.7 Poor water and sanitation o HH accessing sanitation facilities 48.7Limited o Relation between GAM & child sex o Relation between GAM & sex of hh head Insignificant N/A Food Security Phase Proportion of hh consuming <4 fd gps HE 9.2 HE/AFLC Low milk consumption HE/AFLC Low milk consumption Overall Risk to DeteriorationPotential to deteriorate StableDeteriorating.")
27
Key driving factors Hawd/Addun Worsening food security situation -Future outlook following Deyr failure High morbidity 34.6 and 32.8 and suboptimal child feeding is a concern in Hawd and Addun. Low access to safe water 30.9% & 35.6% sanitation facilities 50% & 39.9% in Hawd and Addun respectively Low coverage of health programmes <80 Insecurity IDPS Poor shelters, High morbidity, inappropriate child feeding and care practices Unless high levels of interventions are sustained, the situation is likely to deteriorate Golis,sool plateau,Coastal Cowpea belt & Nugal valley High morbidity (43.1 % in Golis, and 46.2 in Coastal deeh.) Low income and food access (low frankincense production, fishing low milk production in Golis/karkaar/coastal in NEZs Poor infrastructure in Golis and coastal areas. No milk available in Central Coastal and limited availability in Cowpea. Reduced income due to no salable animals in central coastal
 Low income and food access (low frankincense production, fishing low milk production in Golis/karkaar/coastal in NEZs Poor infrastructure in Golis and coastal areas. No milk available in Central Coastal and limited availability in Cowpea. Reduced income due to no salable animals in central coastal.")
28
Mitigating factors Improved intervention (Active case finding and referrals in Garowe and Galkayo. Child Health Days conducted mainly the NEs areas in the months of July /December 2010 Increased humanitarian programmes in the Addun/Hawd in NEZ and parts of central regions (health, nutrition, WASH and Food Aid) Improved coverage of health programmes (polio and Vit A) in all LZs, with exception of Hawd and Addun. Active but limited kinship support Unless high levels of interventions are sustained, the situation is likely to deteriorate in the IDP and populations groups in the Hawd, Addun, Coastal Deeh and Cowpea Belt.
 Improved coverage of health programmes (polio and Vit A) in all LZs, with exception of Hawd and Addun. Active but limited kinship support Unless high levels of interventions are sustained, the situation is likely to deteriorate in the IDP and populations groups in the Hawd, Addun, Coastal Deeh and Cowpea Belt..")
29
1. 5 yrs stunted child, Bossaso IDPs, Dec ‘10. 2. HH interview at Bossaso IDPs Dec ’10 3.Kwashiorkor, Qardho IDP Dec ‘10 1 2 3

30
1. Mother with twins in Guricel, Nov ‘10. 2. Poor Shalter IDPs Nov ’10 3.Unprotected Water in Addun Nov ‘10 1 2 3

31
Nutrition Situation, July 2010 Nutrition situation, Northeast Nutrition Situation, January 2011

32
Nutrition situation, Central

33
The End

Similar presentations


 - Somalia.>")
