Download presentation
Presentation is loading. Please wait.

1
Fig. 1 energy consumption in the US

2
Fig. 2 Sun, wind, and earth

4
Fig. 4 Division of renewable energy sources using the earth surface as reference

5
Fig. 5 The 25 turbines on a wind farm producing up to 90MW

7
Fig. 6 Mirrors in Arizona focus sunlight on a 25 kilowatt Stirling heat engine

8
Fig. 7 A schematic of Ausra’s “Desert Mirror Energy” plant

10
Fig. 9 Ausra hopes to drive down concentrating solar prices with inexpensive flat mirrors and a cool- running turbine generation system

11
Fig. 10 A map of the continental US showing where hot spots are for tapping geothermal energy

12
Fig 11. The Geysers geothermal project produces 750 megawatts of electricity, enough to power all of San Francisco, located 72 miles to the South. Proto: US Department of Energy

13
Fig. 12 Drilling for heat --- using enhanced geothermal systems for electric power generation

16
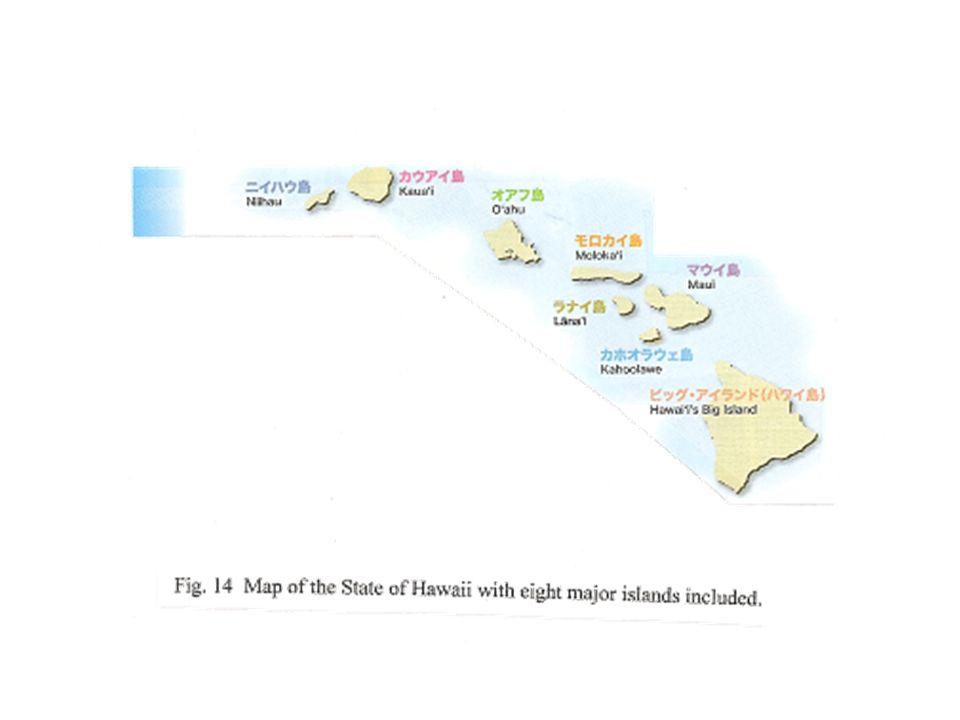
Fig. 15 Hawai’i is making strides towards energy independence

17
Fig. 16 Pine leftover from harvesting can be turned into ethanol

Similar presentations


>")


