Download presentation
Presentation is loading. Please wait.

2
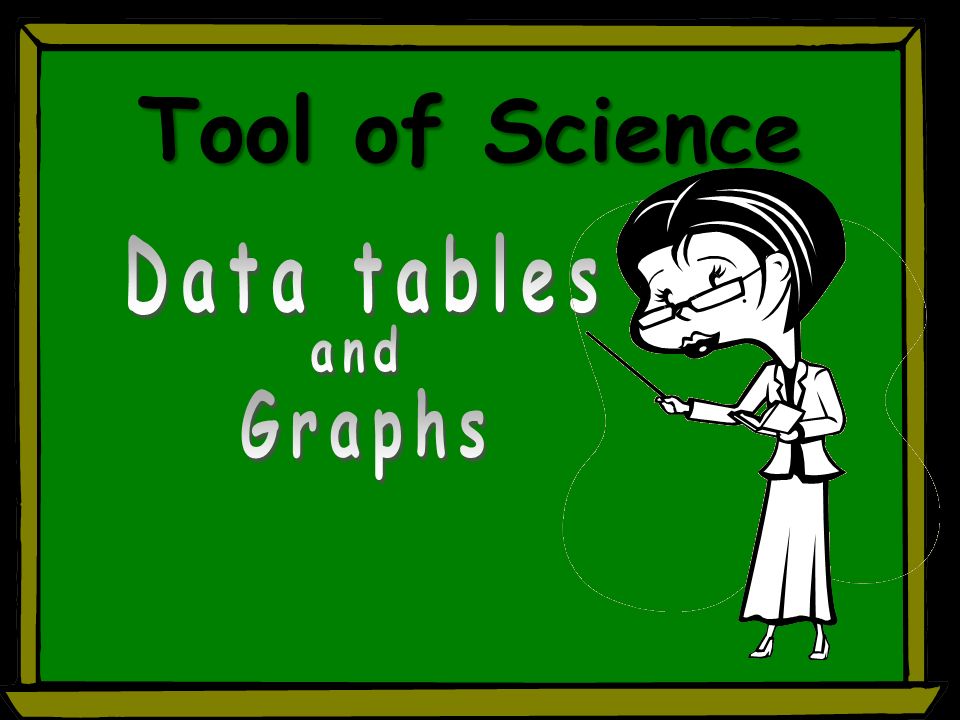
Tool of Science

3
WHAT is a A chart that lets you organize information in rows and columns. ABC 1 2 3 4 Girls Boys Total 1215 712 1927 DogsCats Row Column

4
ABC 1 2 3 4 Girls Boys Total 1215 712 1927 DogsCats Data tables should be Descriptive title Table number Both axis Columns & rows Why is Labeling a data table important?

5
Pie Bar WHAT is a A picture of the data. Line

6
Pie Graphs – parts of a whole When you want to show what portion or fraction of a group falls into certain categories, you use a pie graph.

7
Bar Graphs – to compare Bar graphs are best for showing comparisons between groups or categories.

8
Line Graphs – change over time When there is change occuring over a particular period of time, a line graph will be used

9
Graphs should be Descriptive titleGraph number Both axis – titles and data Graph 1 Why are units of measure are important in both graphs and data tables?

10
What type of graph? What kinds of pizza people in this class like? How much it rained each month this year? Which is the largest class at AHS? PIE BAR LINE

11
2/2/2016 10 Birthdays? Our birthday does deal with time (months/years) But, our birthday is constant - it never changes. A line graph shows change in time, so we would not use it for this type of graph. Would we use a line graph to show when our birthdays are? What kind of graph would we use?
 But, our birthday is constant - it never changes. A line graph shows change in time, so we would not use it for this type of graph. Would we use a line graph to show when our birthdays are. What kind of graph would we use .")
12
2/2/2016 11 How do we make a graph? Bar & line graphs have two different axis’s An axis is either the horizontal line (called x) or the vertical line (called y) that form the base lines of a graph. Y X
 or the vertical line (called y) that form the base lines of a graph. Y X.")
13
2/2/2016 12 What data goes on the Y axis? What data goes on the X axis? Y X

14
2/2/2016 13 X-axis and Y-axis x-axis is always horizontal y-axis is always vertical. The x and y-axis usually starts with zero Intervals on the y-axis are always equal. What is an interval? Why should they be equal?

15
2/2/2016 14 Is this an acceptable graph? Time Car Trip

16
2/2/2016 15 What is the independent variable?What is the dependent variable? How many miles were traveled on Thursday? Were more miles traveled on Monday or Friday?

17
2/2/2016 16 How much corn did the U.S. have in 1991? What does the y-axis represent in the graph? Can you think of another title for this graph? What is the dependent variable? What did it depend on?

18
The Special case of a PIE chart No axis’s How do you know what each section represents? # of Freshmen # of Sophomores # of Juniors # of Seniors

19
Show the percentage of the various animals in the M&M lab. Type of graph? Which table had the most giraffe (yellow M&Ms). Type of graph? Changes in the population size of the lions from 2000 to 2010? Type of graph?
. Type of graph. Changes in the population size of the lions from 2000 to Type of graph .")
20
2/2/2016 19 Great Job!

Similar presentations

>")
 Represents the passage of time and the numerical value of behavior. The Independent.>")


 The Independent Variable. A change in this variable affects the y variable. >")


 - parts of a whole: %>")