Download presentation
Presentation is loading. Please wait.

1
Making Graphs from Data

2
Bar, Line, or Pie? / One of the first things one needs to do when graphing is decide whether to make a bar graph or a line graph.

3
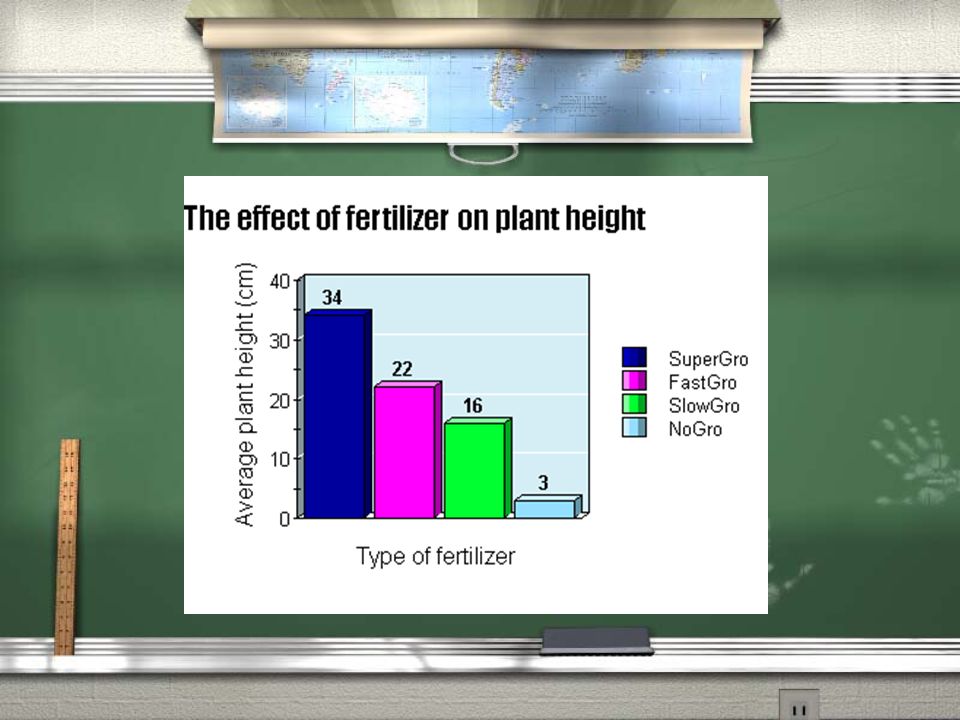
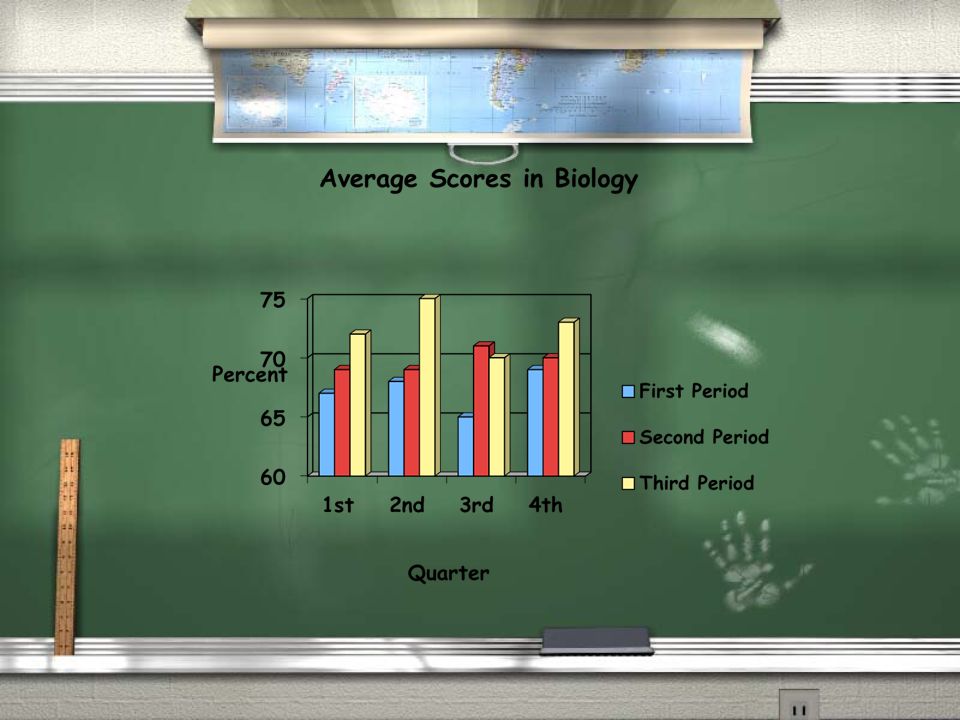
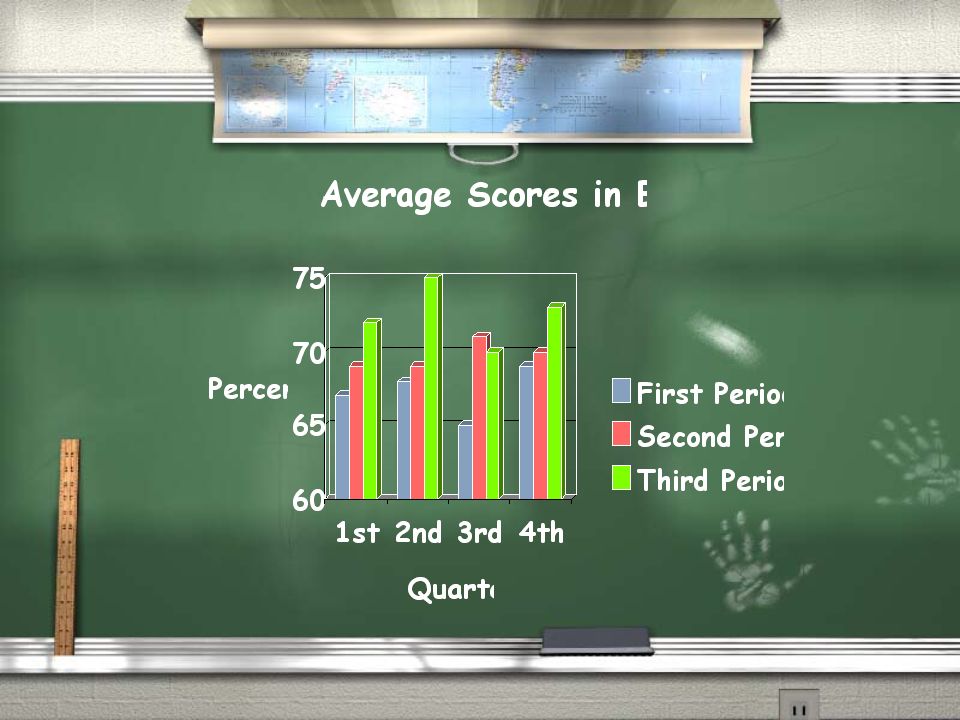
Bar graphs are descriptive. They compare groups of data such as amounts and categories. They help us make generalizations and see differences in the data. Bar Graphs

4
Bar Graphs are used for comparing

6
Line graphs show a relationship between the two variables. They show how the IV affects the DV. Many times, the IV plotted on the X-axis is time. They are useful for showing trends in data and for making predictions. Line Graphs

7
Line graphs are used for showing trends

8
Example

9
Line graphs also show relationships

10
A circle graph is used to show how a part of something relates to the whole. This kind of graph is needed to show percentages effectively. Pie Graph

12
One way to remember which data goes on which axis is the acronym DRY MIX. D.R.Y. M.I.X. D- DependentM- Manipulated R- Responding I- Independent Y- Y-axisX- X-axis DRY MIX

13
Draw the Axes

14
Identify the Axes Y- Axis X- Axis

15
Identify the Axes Y- Axis X- Axis Dependent Variable (what is observed and measured) Independent Variable (what is changed by the scientist)
 Independent Variable (what is changed by the scientist)")
16
TAILS: Another acronym to help remember what you need to create a graph….. T.A.I.L.S. Title Axis Interval Labels Scale

17
Title: Includes both variables Axis: IV on X-axis and DV on Y-axis Interval: The interval (4) is appropriate for this scale. Label: Both axes are labeled. Scale: Min and max values are appropriate. TAILS

18
Remember / TAILS / DRY / MIX / TAILS / DRY / MIX

19
TAILS / T is for Title

21
TAILS / A is for Axis

23
TAILS / I is for Interval

25
TAILS / L is for Label

27
TAILS / S is for Scale

29
Remember that A was for Axis??? When figuring out what goes on which axis remember: DRY MIX When figuring out what goes on which axis remember: DRY MIX

30
DRY / DRY means that the: / Dependent or / Responding variable belongs on the / Y-axis / DRY means that the: / Dependent or / Responding variable belongs on the / Y-axis

32
MIX / MIX means that the: / Manipulated or / Independent variable belongs on the / X-axis / MIX means that the: / Manipulated or / Independent variable belongs on the / X-axis

Similar presentations


>")
 Connect data points using a line or curve of best fit.>")


 The Independent Variable. A change in this variable affects the y variable. >")


? Do Now: Copy the following: Line Graph - A graph that is used to display data that shows how one variable.>")


 - parts of a whole: %>")

