Download presentation
Presentation is loading. Please wait.

1
Graphing

2
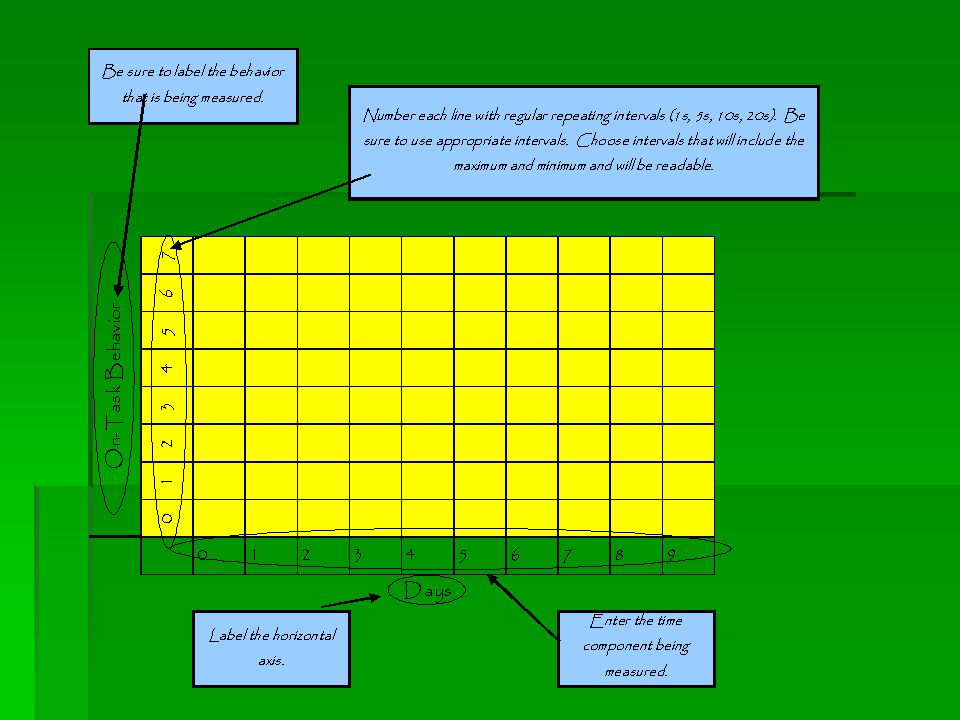
The Important Elements of a Graph Horizontal Axis (X-Axis) Represents the passage of time and the numerical value of behavior. The Independent Variable. Vertical Axis (Y-Axis) Represents the numerical property of the behavior. The Dependent Variable. Title Should explain the goal of the graph and what it measures. Scale The scale of the numbers is important to accurately interpreting the graph.
 Represents the numerical property of the behavior. The Dependent Variable. Title Should explain the goal of the graph and what it measures. Scale The scale of the numbers is important to accurately interpreting the graph..")
3
TYPES OF GRAPHS LINE GRAPH BAR GRAPH PIE CHART SCATTER PLOT

4
Line Graph The most common type of graph. Points connected by a line to make a visual pattern over time. This pattern is used to evaluate trends.

5
Bar Graph Often used when portions of a whole are being represented. Often used when representing percentage. Can be useful when the X-axis uses nonconsecutive data points. Works well to compare information across individuals, settings, or situations.

6
Pie Chart Useful in representing portions of a whole. Useful in representing percentages

7
Scatter Plot Used when a variety of measurements are taken consecutively. Each point is independent. Can see how one point compares with others.

8
Generating a Graph

11
Graphing Gives the viewer the ability to see trends and analyze data in a different way than simply looking at numbers.

Similar presentations

>")


 The Independent Variable. A change in this variable affects the y variable. >")


? Do Now: Copy the following: Line Graph - A graph that is used to display data that shows how one variable.>")


