Download presentation
Presentation is loading. Please wait.

3
Bookshelf APWA BookstoreFree Online

4
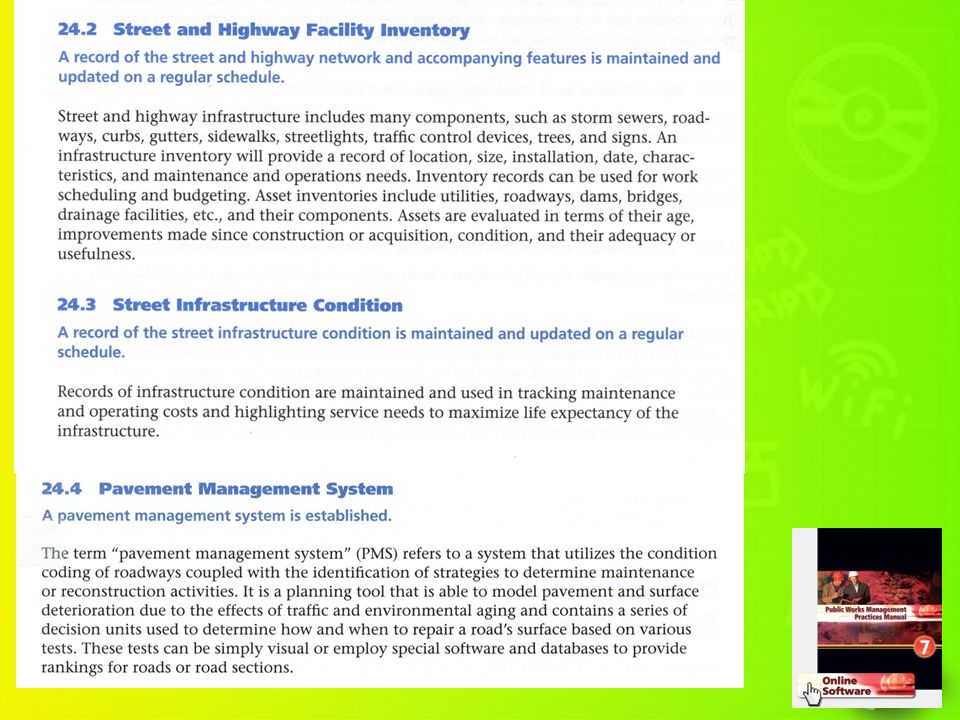
From APWA “Public Works Management Practices Manual,” Version 7

6
Why Manage Assets? Justify funding for preventative maintenance Establish scope and timing of rehab/replacement Establish budget/staffing to meet maintenance needs. Establish inventories for parts and materials. Evaluate effectiveness of new materials/methods. Build credibility with public/elected officials. Provide expected Level of Service (LOS) Establish “net worth” of asset to comply with GASB34 – (modified accounting method)
 Establish net worth of asset to comply with GASB34 – (modified accounting method).")
7
Asset Management Questions: What do I have? Where is it located? What condition is it in? What is its life expectancy? What condition will it be in the future? What’s my goal for its condition (LOS)? Should I maintain or replace it? How much should I budget for it? What is my annualized cost for this asset?
. Should I maintain or replace it. How much should I budget for it. What is my annualized cost for this asset .")
8
Why Manage Assets? Adapted from EPA’s Fact Sheet “Asset Management for Sewer Collection Systems” From “Pavement Management for Airports, Roads, and Parking Lots”, M. Y. Shahin

9
“Stages of Asset Management” Stage 1:Inventory – Network Division – GIS – Attributes Age Cost Stage 2:Condition – Repeatable measurement – Reliable/accurate – Comparative standard Stage 3:Life Expectancy – Sophisticated models – Simple Time to failure Stage 4:Full Asset Management – Model options – Optimize expenditures – Meet level of service goals – Reduce political influence 9

10
Maturity Scale

11
Asset Management Databases GIS Traffic Count Crash Data Asset Inventory Asset Condition Asset Vulnerability Climate Conditions (NOAA, StormWatch) Soil Characteristics
 Soil Characteristics")
12
Life ExpectancyModels Straight-line depreciation Manufacturer’s recommendations Deterioration models Lifecycle preservation model

13
Need to be: Based on Established Inspection Standards Repeatable Reliable Sampled or complete Frequent Condition Inspections

14
How Much to Inspect? Complete Partial Small Samples

15
Small Sampling Common characteristics allow a small sample to reliably measure condition of entire asset: Age Materials Load/Use Maintenance History Individual assets need to be carefully selected to enable small sampling statistics

16
OP Assets Poles Signs Lights Wiring Junction Boxes St. Light Controllers Cable Street Light Wiring Fiber Optic Cables Conduit Signal Cabinets Signal Controllers Signal Heads (incl. DMS) Auxiliary Equipment Pavement Markings Streets Street Curbs Sidewalks Sidewalk Ramps Storm Sewer Lines Storm Sewer Structures Storm Sewer Outfalls Fence Guard Fence Walls Bridges
 Auxiliary Equipment Pavement Markings Streets Street Curbs Sidewalks Sidewalk Ramps Storm Sewer Lines Storm Sewer Structures Storm Sewer Outfalls Fence Guard Fence Walls Bridges.")
17
Street Information

18
Maintenance Modeling

19
Modeling Against Budgets

20
Impact of Plan on Network

21
Modeled Network Performance Increasing funding from $7.7M to $12M stabilizes network condition

22
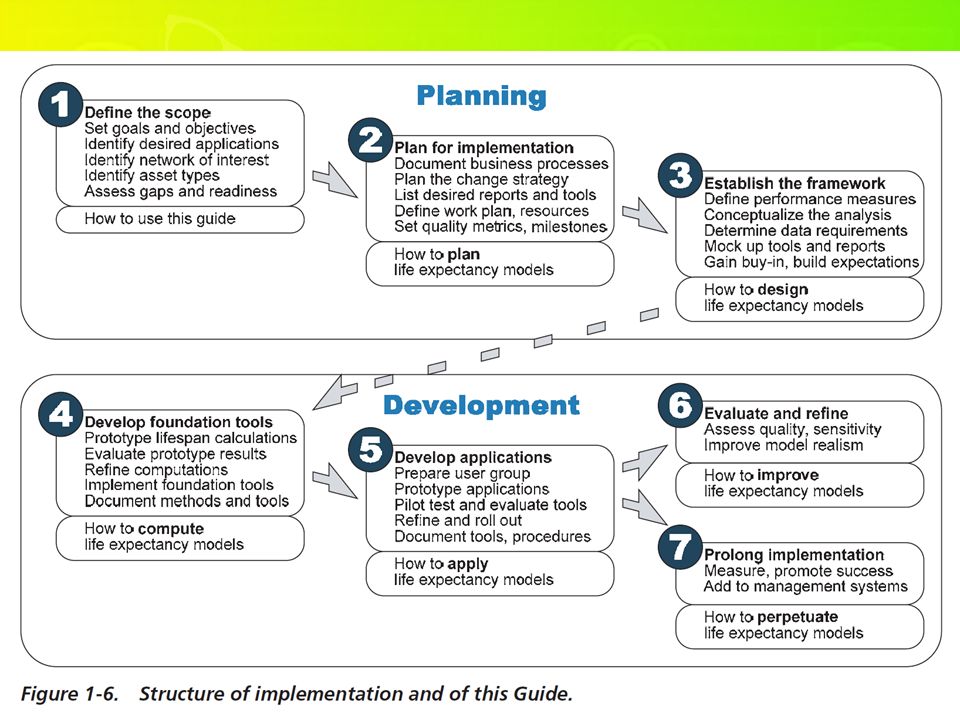
Asset Mgmt. Road Map

25
Work Management What? – Managing labor, material and equipment – Recording time and costs associated with assets – Keeping maintenance records and tracking work Why? – Tracking Service Requests – Work Scheduling/Planning – Performance Measures – Access to Historical Data – More Efficient Use of Resources – Reduce Equipment Downtime – FEMA Reimbursements

26
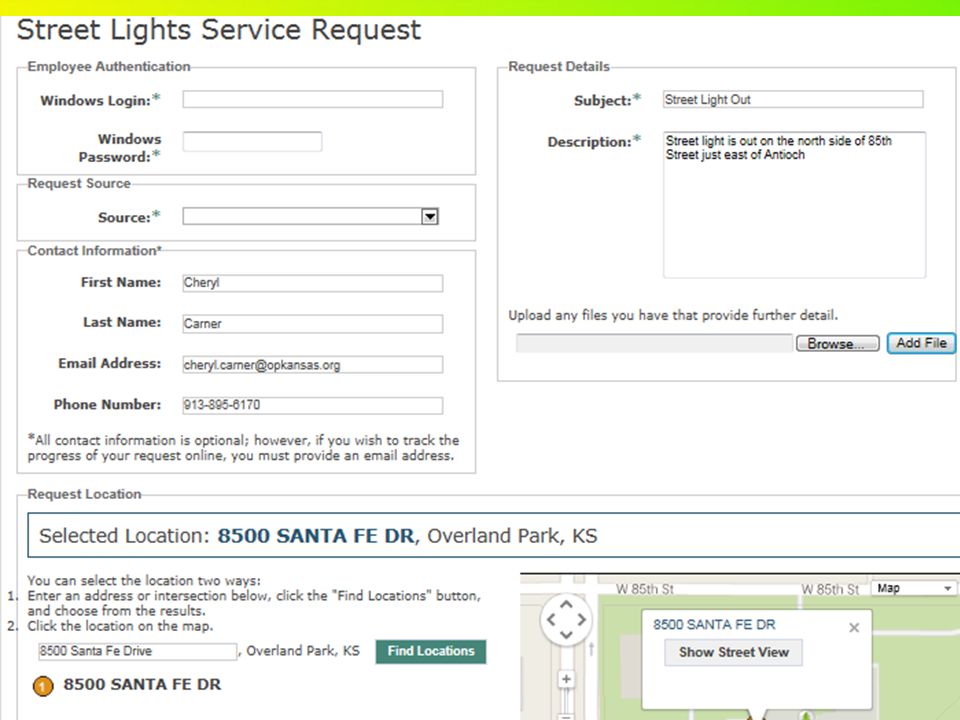
Service Requests Web-based submission Phone Walk-ins Routing based on work rules Automated alerts

28
Internal Data Entry Form

29
Custom On-line Interface

32
Automated Alerts

33
Work Scheduling/Planning Reactive Potholes Street Light Outages Accident Response Proactive Street Sweeping Inlet clean-out Equipment Maintenance Crack Seal Programmed Street Maintenance

34
Web-based Interface (Customized for Utility Locates)
")
36
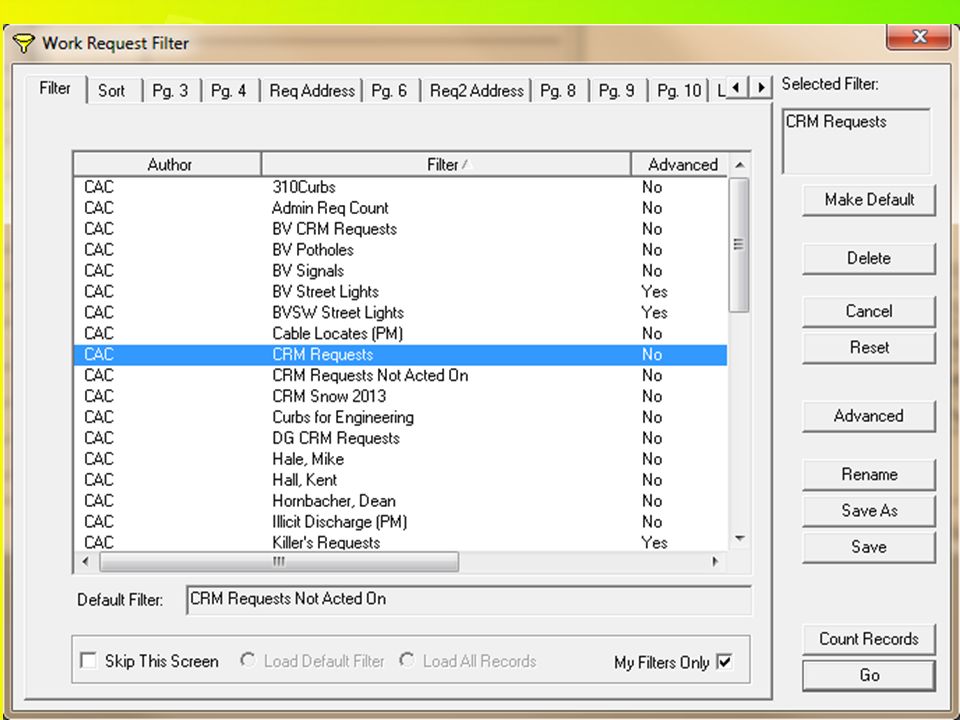
Filtering for Specific Work

37
Sod Damage Map

38
Performance Measures

39
Consistent Data One Answer, Not Three

40
Retrieving Data Through Reports

41
Access to Historical Data Interlocal Agreements Accident Reimbursements Cost Justification FEMA Reimbursement

42
Example: Annual Traffic Signal Maintenance Costs

43
Accident Damage Work Order – Results In……..

44
Itemized Billing to Responsible Party

45
Work Order for Special Events – Results In….

46
Cost Justification

47
Tracking Costs for FEMA

48
Example: FEMA Staff Hours Report (One of Many Reports)
")
49
For Any System: GIS What to Look For How to Integrate

50
GIS

51
What to Look For (Generally) Technology Platform Communication – Users, Customers Integration – Out of the box, or custom Scalability – Size of data store, number of users Licensing – Per seat, per floating seat, per site.
 Technology Platform Communication – Users, Customers Integration – Out of the box, or custom Scalability – Size of data store, number of users Licensing – Per seat, per floating seat, per site.")
52
Integration Open systems. Common platforms. Data dictionaries for each system’s database. Focus on the data (what you don’t see) not on the data editors (what you do).
 not on the data editors (what you do)..")
Similar presentations


>")


