Download presentation
Presentation is loading. Please wait.

1
Radar and Satellites AOS 101 Discussion Sections 302 and 303

2
Satellite History First satellite in space Sputnik 1 Launched on 4 October 1957 by the Soviet Union Orbited in the ionosphere Helped measure the density of the upper atmosphere layer Showed meteorologists the usefulness of using satellites for data Transmitter died after 22 days

3
Weather Satellite History First weather satellite in space Vanguard 2 Launched on 17 February 1959 by the United States Navy Designed to measure cloud cover Considered unsuccessful because of a poor rotation axis TIROS- 1 First successful weather satellite Launched on 1 April 1960 by NASA Lasted 78 days Surveyed atmospheric conditions from space

4
Current Satellite Information Now satellites can run for many years Satellites that are no longer function still remain in orbit around the Earth These are called space debris Two basic types of weather satellites GOES Geostationary Operational Environmental Satellites POES Polar Operational Environmental Satellites Also called LEO Low Earth Orbit Defined by their orbital characteristics

5
Geostationary vs. Polar Orbiting

6
GOES Geostationary Orbiting Environmental Satellite Geostationary means that the satellite is stationary with respect to one point on the ground Orbits as fast as the Earth spins Orbits the Earth at about 36,000 km high Designed by NASA Once in orbit, operations are managed by NOAA Nomenclature GOES is given a letter before placed in orbit Example: GOES-M or GOES-G Once successful, is given a number Example: GOES-11 or GOES-12

7
GOES Takes visible, infrared, and water vapor images Cons Poor spatial resolution Pros Imagery is obtained approximately every 15 minutes Can change the temporal resolution if an important meteorological event is unfolding Good for viewing large scale phenomena

8
GOES Currently two operational GOES in orbit GOES-11 Also called GOES-West 135 W GOES-12 Also called GOES-South 75 W GOES-13 Also called GOES-East 105 W

9
GOES Coverage

10
POES Polar Orbiting Environmental Satellite Rotates around the Earth from pole to pole Closer to the Earth than GOES About 850 km above the Earth surface Sees the entire planet twice in a 24-hour period

11
POES Cons Poor temporal resolution Only captures two images a day Pros Good spatial resolution Because so close to Earth Best resolution is over the poles

12
POES More then a few in orbit currently Two examples are TERRA and AQUA Have different viewing instruments on them One example is MODIS: Moderate Resolution Imaging Spectroradiometer Acquires data in 36 spectral bands (groups of wavelengths) As a result, MODIS can create a true color visible image, which can: Show changes in vegetation during fall/spring Show smoke plumes, dust plumes, etc.
 As a result, MODIS can create a true color visible image, which can: Show changes in vegetation during fall/spring Show smoke plumes, dust plumes, etc.")
13
MODIS February 15, 2011 Tropical Cyclone Bingiza (13S) approaching Madagascar
 approaching Madagascar")
14
MODIS February 18, 2011 Dust storm off Oman http://modis.gsfc.nasa.gov/ gallery/individual.php?db_ date=2011-02-18

15
MODIS Composite Hurricane Dennis - 2005

16
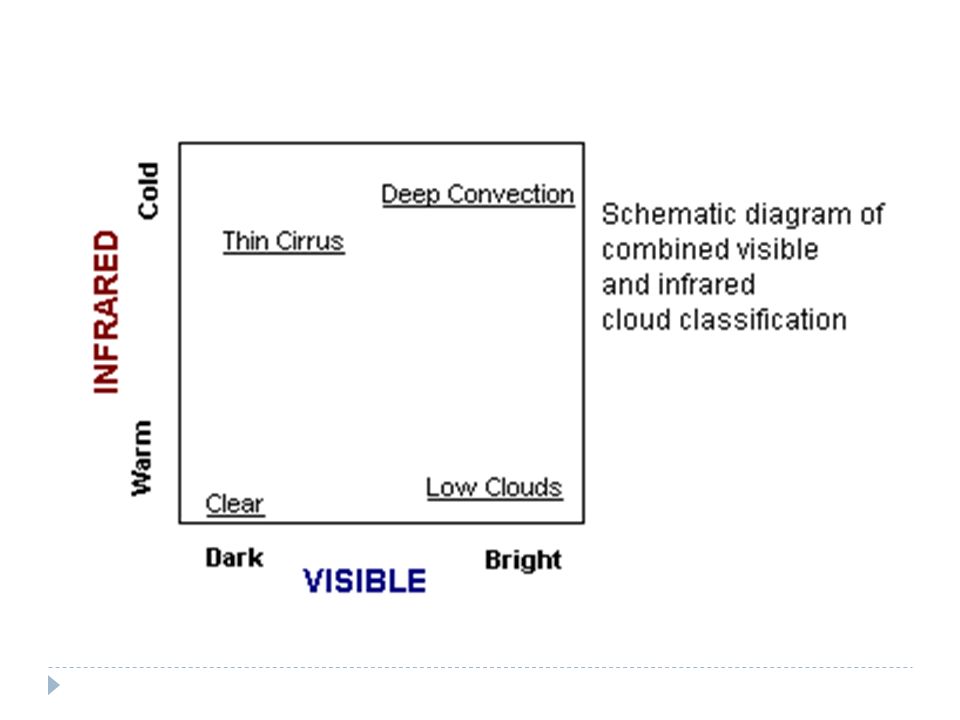
Types of Satellite Imagery Three Main Types of Satellite Imagery VisibleInfrared Water Vapor

17
Visible Satellite Imagery Measures visible light (solar radiation, 0.6 m) which is reflected back to the satellite by cloud tops, land, and sea surfaces. Thus, visible images can only be seen during daylight hours! Dark areas: Regions where small amounts of visible light are reflected back to space, such as forests and oceans Light areas: Regions where large amounts of visible light are reflected back to space, such as snow or clouds

18
Visible Satellite Imagery Pros: Seeing basic cloud patterns and storm systems Monitoring snow cover Shows nice shadows of taller clouds (has a 3-D look to it) Cons: Only useful during the daylight hours Difficult to distinguish low clouds from high clouds since all clouds have a similar albedo (reflect a similar amount of light) Hard to distinguish snow from clouds in winter
 Cons: Only useful during the daylight hours Difficult to distinguish low clouds from high clouds since all clouds have a similar albedo (reflect a similar amount of light) Hard to distinguish snow from clouds in winter")
19
Infrared (IR) Satellite Imagery Displays infrared radiation (10 to 12 m) emitted directly by cloud tops, land, or ocean surfaces Wavelength of IR depends solely on the temperature of the object emitting the radiation Cooler temperatures (like high cloud tops) are shown as light gray, or white tones Warmer temperatures (low clouds, ocean/lake surfaces) are shown dark gray Advantage: You can always see the IR satellite image
 Satellite Imagery Displays infrared radiation (10 to 12 m) emitted directly by cloud tops, land, or ocean surfaces Wavelength of IR depends solely on the temperature of the object emitting the radiation Cooler temperatures (like high cloud tops) are shown as light gray, or white tones Warmer temperatures (low clouds, ocean/lake surfaces) are shown dark gray Advantage: You can always see the IR satellite image")
20
Water Vapor (WV) Satellite Imagery Displays infrared radiation emitted by the water vapor (6.5 to 6.7 m) in the atmosphere Bright, white shades represent radiation from a moist layer or cloud in the upper troposphere Dark, grey or black shades represent radiation from the Earth or a dry layer in the middle troposphere
 Satellite Imagery Displays infrared radiation emitted by the water vapor (6.5 to 6.7 m) in the atmosphere Bright, white shades represent radiation from a moist layer or cloud in the upper troposphere Dark, grey or black shades represent radiation from the Earth or a dry layer in the middle troposphere")
21
VISIBLE

22
IR

23
WATER VAPOR

25
RADAR What does Radar mean? Radio Detection and Ranging During World War II, this Radio Detection and Ranging technique was developed to track enemy ship and aircraft However, it was soon noted that precipitation of any kind would obstruct this remote detection

26
RADAR Products Reflectivity What most people think of a radar image Shows power returned to the antenna at some tilt angle (usually base reflectivity at 0.5°) Radial velocity Shows the velocity of an echo using the Doppler effect Only available with Doppler radars Radar estimated precipitation Based on amount and duration of reflectivity, estimates precipitation hourly, weekly, or some other time interval Radar summaries
 Radial velocity Shows the velocity of an echo using the Doppler effect Only available with Doppler radars Radar estimated precipitation Based on amount and duration of reflectivity, estimates precipitation hourly, weekly, or some other time interval Radar summaries")
27
RADAR - Reflectivity Radar uses electromagnetic radiation to sense precipitation. Sends out a microwave pulse (wavelength of 4-10 cm) and listens for a return echo. If the radiation pulse hits precipitation particles, the energy is scattered in all directions The RADAR has a “listening” period When it detects radiation scattered back, the radiation is called an “echo”
 and listens for a return echo. If the radiation pulse hits precipitation particles, the energy is scattered in all directions The RADAR has a listening period When it detects radiation scattered back, the radiation is called an echo .")
28
RADAR - Reflectivity The RADAR beam is typically 0.5 o above the horizon This ensures that the beam is not immediately blocked by nearby trees, buildings, etc. It rotates in a full circle, with a radius of ~200 miles

29
RADAR Time difference between transmission and return of signal is the distance to the storm The intensity of precipitation is measured by the strength of the echo Units of decibels (dB) Just like intensity of sound waves
 Just like intensity of sound waves")
30
Reflectivity Image An image showing precipitation intensity is called a “reflectivity image”

31
Types of RADAR Conventional Radar Echoes are simply displayed on radar screen. Only produces reflectivity images. Can identify storm structure, locations of tornadoes, and even non-meteorological objects

32
RADAR Circular and vertical sweeps reconstruct the precipitation type and intensity throughout the atmosphere

33
Conventional Radar Pros: Seeing bands/location of precipitation and their intensity Hook echoes Bow echoes Cons: Ground clutter, bouncing off things other than precipitation Overestimation/Underestimation of precip Overestimation/Underestimation of precip Cannot tell type of precipitation by radar alone (Have to use temperatures, actual observations, etc.)
")
34
Doppler RADAR One of the most advanced versions of radar Does everything a conventional radar can do and more In addition to conventional techniques, it has a scan that operates on principle of the Doppler Effect Usually described using sound waves Definition The change in the observed frequency of waves produced by the motion of the wave source

35
Doppler RADAR Locations (NEXRAD)
")
36
RADAR – Radial Velocity Measures changes in wavelength of the RADAR beam after it is scattered from a travelling object Wavelength of the beam changes after it “strikes” the object Thus, wind direction AND speed can be measured by RADAR

37
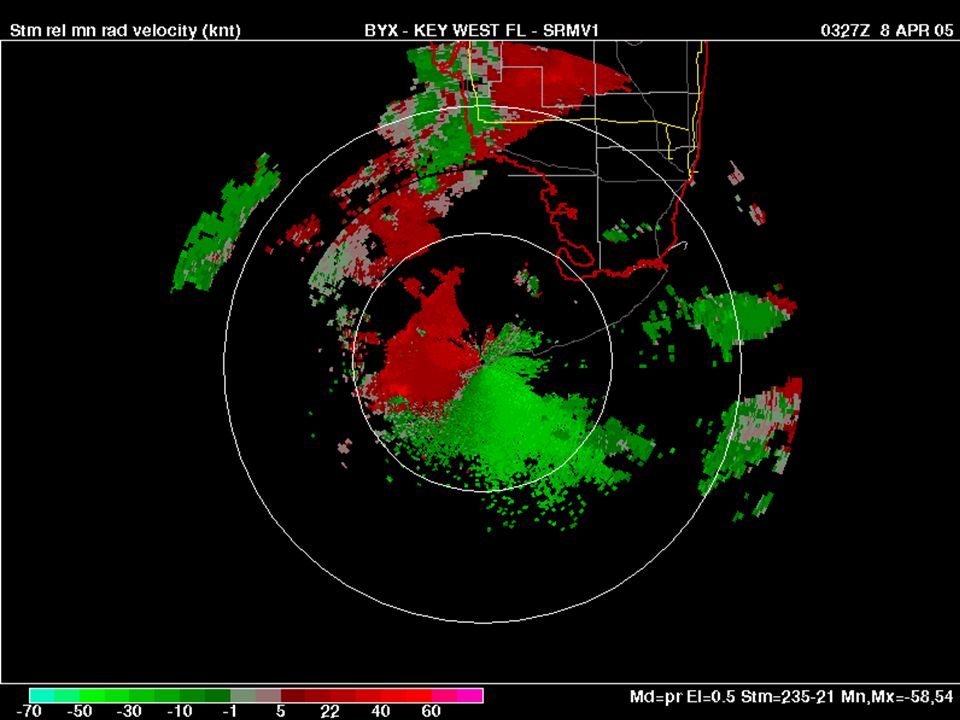
Doppler RADAR Useful in detecting tornado signals Can measure wind speed and direction in a storm Can be viewed in a storm-relative velocity image Red Winds AWAY from RADAR site Green Winds toward RADAR site This is how the National Weather Service issues tornado warnings

39
RADAR – Radar Estimated Precipitation

40
RADAR Summary A product mostly intended for aviation that gives a wide variety of information depending on the source Typically, at minimum, is a mosaic of base reflectivity with overlays of echo tops and echo movement Can have other information http://www.intellicast.com/National/Radar/Summary.aspx http://www.intellicast.com/National/Radar/Summary.aspx

41
RADAR Summary Cell movement: Arrow pointing towards the direction of movement or a wind staff (just like station model) pointing into the direction of movement Number adjacent the arrow indicates the speed in knots. Wind barbs/flags indicate speed on a wind staff Height of echo tops given in hundreds of feet (550 means 55,000 feet)
.")
42
RADAR Summary SIGMETs/AIRMETs Mesocyclone (abbreviated MESO) Computer algorithms detect large rotating echo Tornadic vortex signature (abbreviated TVS) Compact intense rotation is detected by computer algorithms Hail Algorithms are detecting the probability of hail within the storm Watch Boxes Thunderstorm and tornado watches issued by the Storm Prediction Center in Norman, OK. Blue box for thunderstorm watch, Red box for tornado watch

43
Radar Issues Not everything on the reflected radar image is precipitation, there can be many other things that create echoes Cars Birds and Insects Ground Clutter Buildings Hills Trees Anomalous propagation

44
VIPIR Radar Volumetric Imaging and Processing of Integrated Radar Used by television stations to see a three dimensional view of the radar echoes

Similar presentations
 period ( 24 hours for each orbit) Always above same location. Must.>")


![NEXRAD or WSR-88D [Next Generation Radar] [Weather Surveillance Radar, 1988, Doppler]](/13/4044452/big_thumb.jpg "NEXRAD or WSR-88D [Next Generation Radar] [Weather Surveillance Radar, 1988, Doppler]>")
 Atlas (1989)>")


