Download presentation
Presentation is loading. Please wait.

1
7. Radar Meteorology References Battan (1973) Atlas (1989)
Radar theory Atlas (1989) Early history of radar in meteorology. Doviak and Zrnic (1984) Recent developments and doppler techniques.
 Early history of radar in meteorology. Doviak and Zrnic (1984) Recent developments and doppler techniques.")
2
7.1 Introduction * Clouds appear mainly on the convective and mesoscale, most difficult to obtain atmospheric data * Clouds and mesoscale phenomena are too small to be resolved by conventional surface and upper-air networks, and too large to be observed locally * Radar is most effective instrument for obtaining observations in cloud systems. * Radar can observe the precipitation with mesoscale coverage (~200km) and convective-scale resolution (~1km) * Radar can also receive signals from cloud particles * Has been installed on land, ships, aircraft and spacecraft
 and convective-scale resolution (~1km) * Radar can also receive signals from cloud particles. * Has been installed on land, ships, aircraft and spacecraft.")
3
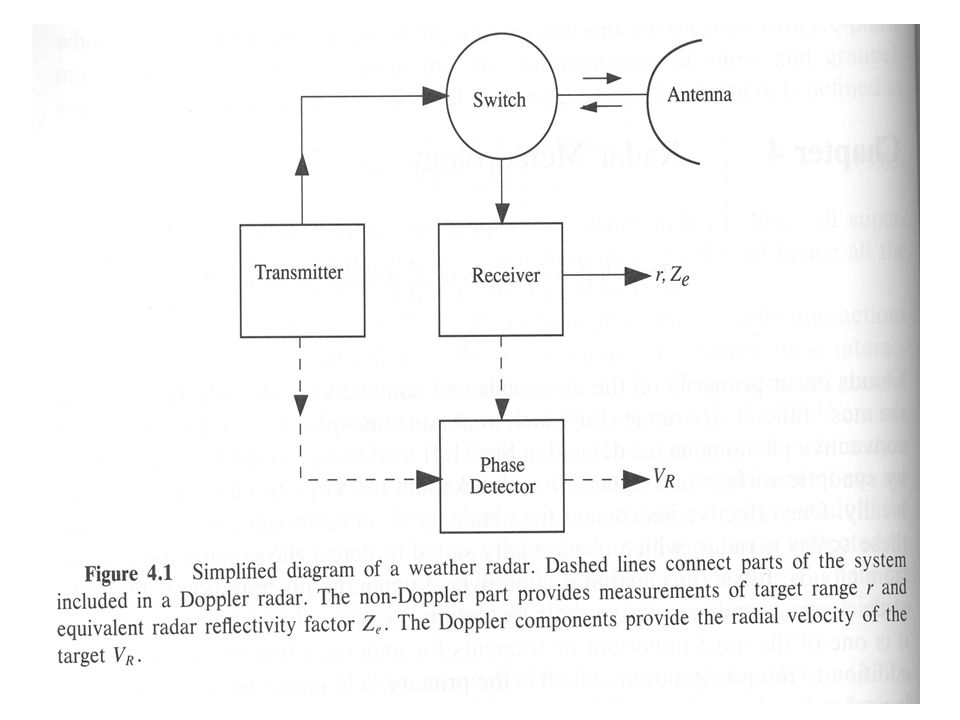
Three main components 7.2 General principles of radar Transmitter
Generates a short pulse of electromagnetic energy. Antenna Focuses energy into a narrow beam Generally 1 degree beamwidth. Receiver Detect the back-scattered signal from target if large enough.

6
Primary Function Detect the range and direction of back-scattered signal. Range: timing circuit PRF - Pulse repetition frequency. Velocity of propagation: c = speed of light. Depends on density and water content of air. Always within 0.03% of c. Direction: Antenna azimuth and elevation at the instant the signal is received.

7
Typical Parameters Peak Power, Pt: Radio frequency, : Wavelength, :
10 to 1000 kW. Radio frequency, : 3 to 30 GHz. Wavelength, : 1 to 10 cm. PRF, fr : 200 to 2000 Hz Pulse duration, : 0.1 to 5 s. Antenna area, Antenna gain, Beamwidth,

8
7.3 Radar equation 1. General Radar 2. Weather Radar
Distributed Targets Many scattering elements simultaneously illuminated by a transmitted pulse. Raindrops, snowflakes, and cloud droplets. Resolution volume: Volume containing those particles that are simultaneously illuminated. Function of beamwidth and pulse length. Targets move relative to each other. Power returned fluctuates in time. The instantaneous power depends on the arrangement of scatters and their motion. Not simply related to the backscatter cross-section.

9
Rayleigh Scattering Law
Applies to particles that are small compared to the wavelength () of the radar. Raindrops and snowflakes are good Rayleigh scatters to good approximation at ’s of cm. Common ’s for weather radars. K is a function of temperature (T), wavelength (), and sphere composition |K|2 0.93 for water. |K|2 0.21 for ice. Ice sphere has a radar cross section about 2/9 or 6.5 dB less than a water sphere.
 of the radar. Raindrops and snowflakes are good Rayleigh scatters to good approximation at ’s of 5-10 cm. Common ’s for weather radars. K is a function of temperature (T), wavelength (), and sphere composition. |K|2 0.93 for water. |K|2 0.21 for ice. Ice sphere has a radar cross section about 2/9 or 6.5 dB less than a water sphere.")
10
Reflectivity The main power received is determined by radar parameters, range, and two factors that depend upon the scatterers. |K|2 and D6. Reflectivity Number of drops Size (diameter) of drops. This is really what we are interested in from the radar equation. For raindrops: N(D) is the drop-size distribution. For snowflakes: N(D) is the distribution of melted diameters. If this convention is not included, a density adjustment would need to appear in |K|2.
 of drops. This is really what we are interested in from the radar equation. For raindrops: N(D) is the drop-size distribution. For snowflakes: N(D) is the distribution of melted diameters. If this convention is not included, a density adjustment would need to appear in |K|2.")
11
Average gain < axial gain.
Gain adjustment Beamwidth: angular separation between points where the transmitted intensity has fallen off to half its maximum value, or 3 dB below the maximum. Typically 1 degree. Assume a Gaussian beam pattern. Assumption: the antenna gain is uniform within its 3 dB limits. Average gain < axial gain.

12
7.4 Z-R relations for rain and snow
Relating reflectivity to precipitation: to estimate the precipitation rate; the precipitation content of the air; and the fall speed of the precipitation at the surface.

13
Bright band Snow and frozen precipitation will usually have a smaller
value of reflectivity (dBZ) because it is made of ice. When frozen precipitation falls to a level where the temperature is above freezing it begins to melt. The water surface on the outside will cause an increase in dBZ, which produces a bright band on the radar image at the height near the freezing level. The bright band does not extend to the surface because once the snowflake completely melts it falls faster. The drop concentration decreases as altitude decreases, resulting in less dBZ.
 because it is made of ice. When frozen precipitation falls to a level where the. temperature is above freezing it begins to melt. The water surface on the outside will cause an increase in. dBZ, which produces a bright band on the radar image at. the height near the freezing level. The bright band does not extend to the surface because. once the snowflake completely melts it falls faster. The drop. concentration decreases as altitude decreases, resulting in. less dBZ.")
14
Radar Display Systems:
Plan Position Indicator (PPI): maps the received signals on polar coordinates in plan view. Range Height Indicator (RHI): shows the vertical structure of echoes which is generated when the antenna scans in elevation with azimuth fixed. Microprocessors are used to convert the signals to reflectivity Z or rainfall rate.
: maps the received signals. on polar coordinates in plan view. Range Height Indicator (RHI): shows the vertical structure. of echoes which is generated when the antenna scans in. elevation with azimuth fixed. Microprocessors are used to convert the signals to. reflectivity Z or rainfall rate.")
15
7.5 Doppler Velocity Measurements
Klystron transmitters: pulse-modulating a free-running stable oscillator, the frequency of the transmitted signal is constant, each pulse bears the same phase relation. Because the target is moving, the frequency (amplitude and phase) of reflected waves will change with time. Two successive pulses will result in a frequency difference.
 of reflected waves. will change with time. Two successive pulses will result in a. frequency difference.")
16
The radial velocity is related to this frequency shift:
The backscattered radiation comes from the population of precipitation particles in the radar resolution volume The scatters are all moving at somewhat different velocities

17
Homework (6-7) 1. The precipitation water content (L) is given as
Meteorology 342 Homework (6-7) 1. The precipitation water content (L) is given as For the Marshall-Palmer distribution (10.1), show that 2. If a droplet population consists of droplets of a single size and fall speed (D=2 mm, u=5m/s), and the droplet density is 25 drops per cubic meter. Calculate the rainfall rate in mm/hr. 3. Use the Marshall-Palmer distribution (10.1), show that u (=5m/s) is the mean fall velocity of raindrops. Use this formula to find Z (in ) and dBZ for a rainfall rate of 1 inch per hour. 4. Problem 11.1 5. Problem 11.2
 1. The precipitation water content (L) is given as. For the Marshall-Palmer distribution (10.1), show that. 2. If a droplet population consists of droplets of a single size and fall speed (D=2 mm, u=5m/s), and the droplet density is 25 drops per cubic meter. Calculate the rainfall rate in mm/hr. 3. Use the Marshall-Palmer distribution (10.1), show that. u (=5m/s) is the mean fall velocity of raindrops. Use this formula to find Z (in ) and dBZ for. a rainfall rate of 1 inch per hour. 4. Problem Problem")
Similar presentations

 Most rain falls near the equator. Notice how dry it is on.>")


: The mass of condensed water substance (water or ice)>")


 -12 dBZ. Echoes in clear air from insects Common is summer. Watch for echoes to expand area as sun sets and insects.>")

 ATMOS ATMOS Delft University of Technology Tobias Otto: A short course on radar meteorology.1 A short course on.>")


 Coastal HF Radar IMCS Building Room 214C 732-932-6555 ext 251 Dunes of sand.>")


