Download presentation
Presentation is loading. Please wait.

1
Climate Variability and Basin Scale Forcing over the North Atlantic Jim Hurrell Climate and Global Dynamics Division National Center for Atmospheric Research (NCAR) jhurrell@ucar.edu BASIN Science Meeting 12-14 March 2005 Reykjavik, Iceland
 BASIN Science Meeting March 2005 Reykjavik, Iceland")
2
Climate Phenomena in the Atlantic North Atlantic Oscillation (NAO) Tropical Atlantic Variability (TAV) Meridional Overturning Circulation (MOC) MOC, TAV and NAO interact, but in ways that are not well understood MOC, TAV and NAO interact, but in ways that are not well understood Understanding Atlantic climate variability/change requires a global view Understanding Atlantic climate variability/change requires a global view
 Tropical Atlantic Variability (TAV) Meridional Overturning Circulation (MOC) MOC, TAV and NAO interact, but in ways that are not well understood MOC, TAV and NAO interact, but in ways that are not well understood Understanding Atlantic climate variability/change requires a global view Understanding Atlantic climate variability/change requires a global view")
3
The Mean State and Stationary Waves (DJF) L H L H H Sea Level Pressure Mid Tropospheric Height LOW HIGH
 L H L H H Sea Level Pressure Mid Tropospheric Height LOW HIGH")
4
Change in Winter Surface Temperature since 1980 Human activities are superimposed on the background “noise” of natural variability Cold Warm

5
Change in Winter Sea Level Pressure since 1980 (hPa)Dec-Mar Pressure Falls Pressure Rises (related to) El Niño/Southern Oscillation (ENSO) North Atlantic Oscillation (NAO)
Dec-Mar Pressure Falls Pressure Rises (related to) El Niño/Southern Oscillation (ENSO) North Atlantic Oscillation (NAO)")
6
The North Atlantic Oscillation Spatial Structure and Seasonal Variability DJF SON MAM JJA

7
Alternative Definition: Cluster Analysis (Winter Only) NAO- 29% NAO+ 20% Scand 21% Ridge 30%
 NAO- 29% NAO+ 20% Scand 21% Ridge 30%")
8
NAO+ NAO- Scand Ridge Time History of Occurrence

9
The North Atlantic Oscillation: Winter Spatial Structure Dec-Mar 39% SLP (hPa) Temporal Evolution Dec-Mar r = 0.92 Stronger Westerlies hPa
 Temporal Evolution Dec-Mar r = 0.92 Stronger Westerlies hPa")
10
Winter Surface Temperature Change since 1980 °C Cold Warm NAO influence (1 ) °C Cold Warm
 °C Cold Warm")
11
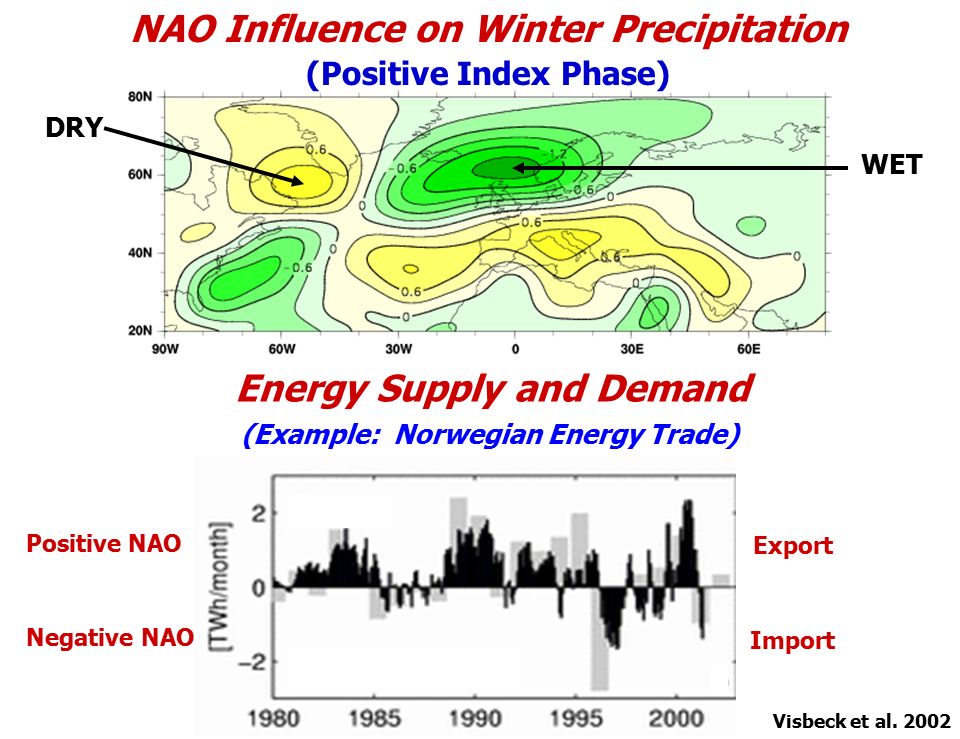
NAO Influence on Winter Precipitation DRY WET (Positive Index Phase) Energy Supply and Demand (Example: Norwegian Energy Trade) Export Import Positive NAO Negative NAO Visbeck et al. 2002
12
Ocean Response to NAO Variability

13
Leading patterns of North Atlantic climate variability Sea Surface Temperature 500 hPa Geopotential Height Ocean Response to NAO Variability r = 0.72

14
Ocean Response to NAO Variability Winter Index (1864-2002) Weaker Westerlies Stronger Westerlies SST
 Weaker Westerlies Stronger Westerlies SST")
15
(1967-2000) – (1921-1963) Annual SST (°C) Multi-decadal SST Variability Oceanic response to atmospheric decadal variability? Oceanic response to atmospheric decadal variability?

16
Multi-decadal SST Variability What is the role of non-local dynamical oceanic processes? What is the role of non-local dynamical oceanic processes? Oceanic response to atmospheric decadal variability? Oceanic response to atmospheric decadal variability?

17
Ocean Response to NAO Variability Visbeck et al. (2003) Courtesy of Igor Yashayaev Changes in Water Masses
 Courtesy of Igor Yashayaev Changes in Water Masses.")
18
Ocean Response to NAO Variability Curry and McCartney (2001) Circulation Changes Oceanic NAO analogue: Eastward Transport Index
 Circulation Changes Oceanic NAO analogue: Eastward Transport Index")
19
Deser et al. (2000) + - Sea Ice Response to NAO Variability
 + - Sea Ice Response to NAO Variability")
20
What Climate Processes Govern NAO Variability? Random and Unpredictable Variations Simulated (Dec-Mar) 200 years of CCM3 without variations in “external” forcings Basic structure & time scale arises from internal nonlinear atmospheric dynamics EOF1 SLP (Dec-Mar)
 200 years of CCM3 without variations in external forcings Basic structure & time scale arises from internal nonlinear atmospheric dynamics EOF1 SLP (Dec-Mar).")
21
What Climate Processes Govern NAO Variability? Random and Unpredictable Variations Consistent with Observations (Climate Noise Paradigm) Observed Simulated NAO Index A role for external forcing? Basic structure & time scale arises from internal nonlinear atmospheric dynamics 200 years of CCM3 without variations in “external” forcings EOF1 SLP (Dec-Mar) r (1yr) = -0.07 r (1yr) = -0.06 Except for the latter half of the 20 th Century Observed r (1yr) = 0.4
 Observed Simulated NAO Index A role for external forcing. Basic structure & time scale arises from internal nonlinear atmospheric dynamics 200 years of CCM3 without variations in external forcings EOF1 SLP (Dec-Mar) r (1yr) = r (1yr) = Except for the latter half of the 20 th Century Observed r (1yr) = 0.4.")
22
Rises JFM 500 hPa Height Trend (1950-1999) m Global SST Tropical SST Observed Falls The Role of Ocean Forcing
 m Global SST Tropical SST Observed Falls The Role of Ocean Forcing")
23
Reproducibility: Individual Runs GOGA (multi-model) Trend of JFM 500 hPa “NAO Index” (1950-1999) CNTRL (CCM3) -200 -100 0 100 200 (m) Observed TOGA (CCM3)
 Trend of JFM 500 hPa NAO Index ( ) CNTRL (CCM3) (m) Observed TOGA (CCM3)")
24
JFM Trend in Tropical SST (1950-1999) ColdWarm Warm Pool (60°-170°E; 15°S-15°N) 0.62 ± 0.13°C Tropics (15°S-15°N) 0.46 ± 0.25°C
 ColdWarm Warm Pool (60°-170°E; 15°S-15°N) 0.62 ± 0.13°C Tropics (15°S-15°N) 0.46 ± 0.25°C")
25
Precipitation (mm day -1 ) WETDRY JFM Response to Indo-W. Pacific SST Trend 500 hPa Height (m) FALLSRISES r = 0.80
 FALLSRISES r =")
28
Change in Tropical SST (1950-1999) 0.62 ± 0.13°C Observed Indian Ocean Temperature 0.59 ± 0.14°C Climate Model Forced with Observed Changes in Greenhouse Gas Concentrations Simulated Indian Ocean Temperature
 0.62 ± 0.13°C Observed Indian Ocean Temperature 0.59 ± 0.14°C Climate Model Forced with Observed Changes in Greenhouse Gas Concentrations Simulated Indian Ocean Temperature")
29
NAO is most prominent and recurrent pattern of atmospheric variability, driving upper-ocean and sea ice variations Basic structure and time evolution results from internal, nonlinear atmospheric dynamics Climate noise paradigm does not explain behavior in recent decades Concerning observed winter North Atlantic climate change Model experiments suggest North Atlantic climate change has been driven, at least in part, by warming tropical SSTs, with the Indo-Pacific region key Nonlinear approaches reveal spatial asymmetries between the two NAO phases

30
Cautionary notes NAO explains only a fraction of the total variability Nonlinear approaches give a different view of the dynamic signature of interannual North Atlantic climate variability No evidence for periodic behavior

31
Future Change ? Numerous modeling studies indicate two Atlantic phenomena that might change NAO and MOC

32
Future Change Most climate models simulate an increasing trend, with pressure decreases over the far North Atlantic and pressure increases in middle latitudes Details vary considerably from model-to-model, and the simulated trends are smaller than observed NAO

33
Future Change NAO Observed (low pass filtered) Simulated (7 models) Inability to capture mechanisms of by which stratospheric flow anomalies affect the tropospheric evolution Details of the simulated SST field are important Concerning the discrepancy with observations Gillett et al. 2003

34
Future Change Most, but not all, climate models project some weakening due to warming and freshening MOC Courtesy Jonathan Gregory

35
Future Change Most, but not all, climate models project some weakening due to warming and freshening Nature of changes and mechanisms vary considerably from model-to-model MOC Ongoing CMIP subproject to investigate model differences Effect of weakening is to moderate regional warming

Similar presentations


 Robert.>")


 JENNY KAFKA.>")


