Download presentation
Presentation is loading. Please wait.

1
El-Nino, climatic variability and North Pacific Surface Temperature Fields Analysis Prof. Victor I.Kuzin Institute of Computational Mathematics & Mathematical Geophysics SD RAS, Novosibirsk, 2005

2
Objectives The Pacific Ocean is the source of the climatic variability influencing to the atmospheric processes not only in local, but also in global scales. The mostly strong signal is the El- Nino/Southern Oscillation (ENSO) representing the inter- annual variability in tropics. In the middle latitude there exist the inter-decadal signal, so called the Pacific Decadal Oscillations (PDO) centered over the Pacific Ocean and North America. This variability can be analyzed in the sea surface temperature patterns with the use some statistical processing.
 representing the inter- annual variability in tropics. In the middle latitude there exist the inter-decadal signal, so called the Pacific Decadal Oscillations (PDO) centered over the Pacific Ocean and North America. This variability can be analyzed in the sea surface temperature patterns with the use some statistical processing..")
3
Content El-Nino phenomenon El-Nino phenomenon Climatic variability in the tropical and North Pacific Climatic variability in the tropical and North Pacific EOF analysis of the SST during the period 1981-1999 EOF analysis of the SST during the period 1981-1999 Cluster analysis of the SST during the period 1948-2002: Cluster analysis of the SST during the period 1948-2002: - Spatial classification - Temporal classification Numerical modeling of the ocean response to the atmospheric forcing during periods of El-Nino & La-Nina Numerical modeling of the ocean response to the atmospheric forcing during periods of El-Nino & La-Nina Conclusion Conclusion

4
The flooding in California after El-Nino 1997

5
The forest fire in Australia in 1998

6
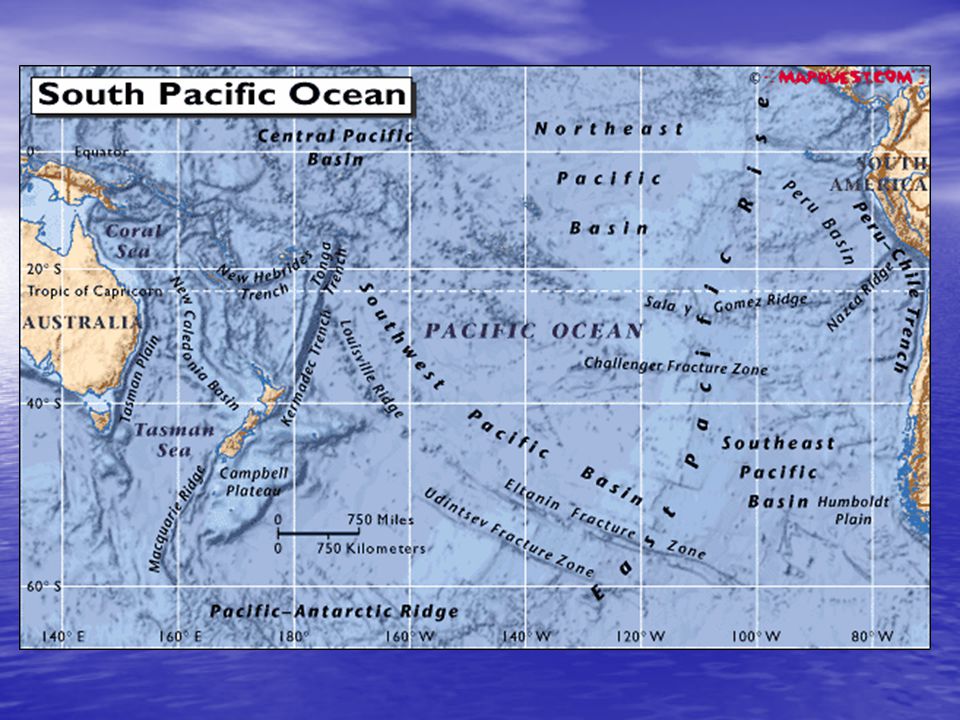
Pacific ocean

8
El-Nino/Southern Oscillation (J. Bierknes hypothesis) Arising of the positive SST anomaly in the tropical Pacific (El-Nino phenomenon) is influenced by the variations of the Walker Circulation of the tropical atmosphere (Southern Oscillation) and vice versa. Arising of the positive SST anomaly in the tropical Pacific (El-Nino phenomenon) is influenced by the variations of the Walker Circulation of the tropical atmosphere (Southern Oscillation) and vice versa. This is a result of strong nonlinear interaction of two components of the climatic system, which works like an oscillators: the fast, no inertial atmosphere and the slow, inertial ocean, influencing one to another. This is a result of strong nonlinear interaction of two components of the climatic system, which works like an oscillators: the fast, no inertial atmosphere and the slow, inertial ocean, influencing one to another. In this system ocean, by virtue of its slow adjustment between the thermocline and surface layer provides the “memory” that carries the system oscillations from cold phase La-Nina to warm phase El- Nino In this system ocean, by virtue of its slow adjustment between the thermocline and surface layer provides the “memory” that carries the system oscillations from cold phase La-Nina to warm phase El- Nino Over the past and the half decade the modeling results have provided strong evidence of this hypothesis Over the past and the half decade the modeling results have provided strong evidence of this hypothesis
 Arising of the positive SST anomaly in the tropical Pacific (El-Nino phenomenon) is influenced by the variations of the Walker Circulation of the tropical atmosphere (Southern Oscillation) and vice versa. Arising of the positive SST anomaly in the tropical Pacific (El-Nino phenomenon) is influenced by the variations of the Walker Circulation of the tropical atmosphere (Southern Oscillation) and vice versa. This is a result of strong nonlinear interaction of two components of the climatic system, which works like an oscillators: the fast, no inertial atmosphere and the slow, inertial ocean, influencing one to another. This is a result of strong nonlinear interaction of two components of the climatic system, which works like an oscillators: the fast, no inertial atmosphere and the slow, inertial ocean, influencing one to another. In this system ocean, by virtue of its slow adjustment between the thermocline and surface layer provides the memory that carries the system oscillations from cold phase La-Nina to warm phase El- Nino In this system ocean, by virtue of its slow adjustment between the thermocline and surface layer provides the memory that carries the system oscillations from cold phase La-Nina to warm phase El- Nino Over the past and the half decade the modeling results have provided strong evidence of this hypothesis Over the past and the half decade the modeling results have provided strong evidence of this hypothesis.")
9
El-Nino – Southern Oscillation (ENSO)
")
10
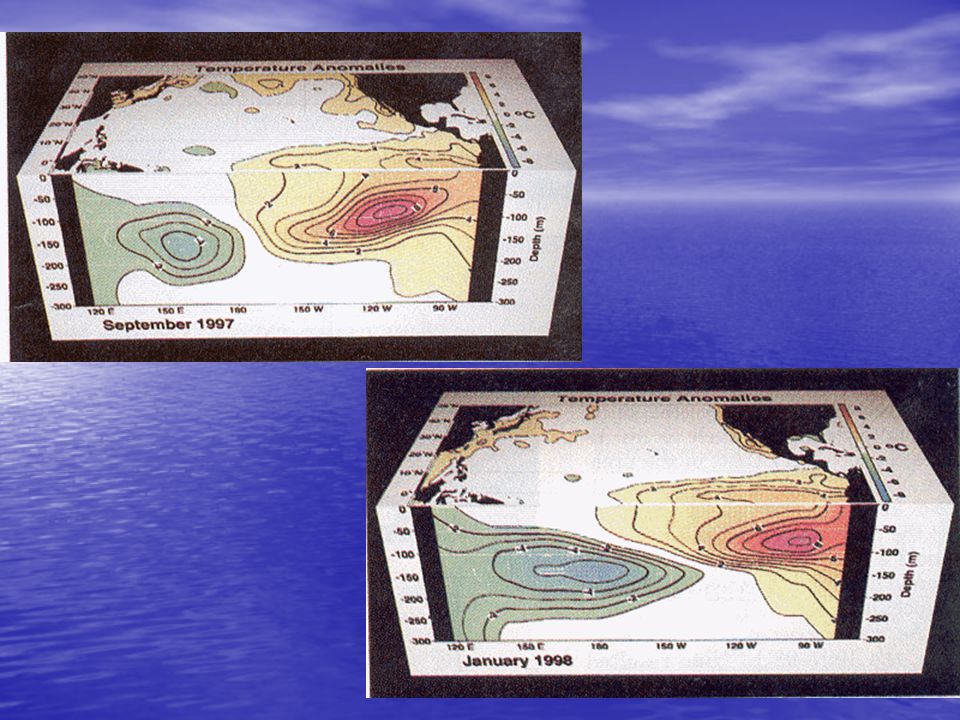
Climatic state of the tropical Pacific

11
Sequences of the events during El-Nino

13
Sequence of the events during El-Nino Arising of the positive SST anomaly in the eastern part of the tropical Pacific by the redistribution of the water masses after strong La-Nina state Arising of the positive SST anomaly in the eastern part of the tropical Pacific by the redistribution of the water masses after strong La-Nina state Weakening of the trade wind in the equatorial Pacific Weakening of the trade wind in the equatorial Pacific Increasing of the positive SST anomalies as a result of the eastward Kelvin waves propagation (El-Nino) Increasing of the positive SST anomalies as a result of the eastward Kelvin waves propagation (El-Nino) Shifting of the zone of convection and heat fluxes and output of the strong heat and moisture fluxes to the atmosphere Shifting of the zone of convection and heat fluxes and output of the strong heat and moisture fluxes to the atmosphere Redistribution of the heat and moisture anomalies in the atmosphere via the teleconnection mechanism to the tropical and extra-tropical zones Redistribution of the heat and moisture anomalies in the atmosphere via the teleconnection mechanism to the tropical and extra-tropical zones Climatic hazards in the tropical and midlatitudes (flooding, drought, storms, etc.) Climatic hazards in the tropical and midlatitudes (flooding, drought, storms, etc.) Reconstruction of the climatic state and transition of the ocean to the cold La-Nina faze Reconstruction of the climatic state and transition of the ocean to the cold La-Nina faze
 Increasing of the positive SST anomalies as a result of the eastward Kelvin waves propagation (El-Nino) Shifting of the zone of convection and heat fluxes and output of the strong heat and moisture fluxes to the atmosphere Shifting of the zone of convection and heat fluxes and output of the strong heat and moisture fluxes to the atmosphere Redistribution of the heat and moisture anomalies in the atmosphere via the teleconnection mechanism to the tropical and extra-tropical zones Redistribution of the heat and moisture anomalies in the atmosphere via the teleconnection mechanism to the tropical and extra-tropical zones Climatic hazards in the tropical and midlatitudes (flooding, drought, storms, etc.) Climatic hazards in the tropical and midlatitudes (flooding, drought, storms, etc.) Reconstruction of the climatic state and transition of the ocean to the cold La-Nina faze Reconstruction of the climatic state and transition of the ocean to the cold La-Nina faze")
14
Consequences of the El-Nino event The 1997-98 El-Nino resulted in drought over Indonesia, Australia & the Amazon basin The 1997-98 El-Nino resulted in drought over Indonesia, Australia & the Amazon basin The extremely wet conditions with floods was in California and Florida The extremely wet conditions with floods was in California and Florida The temperature of the Barents Sea upper layer decreased approximately to one degree (results based on the measurements on the Kolsky meridian cross-section) The temperature of the Barents Sea upper layer decreased approximately to one degree (results based on the measurements on the Kolsky meridian cross-section) The influence of El-Nino should be for the Siberian region, but the evident correlation between the temperature, precipitation and this event on the basis of the one hundred series of the meteorological measurements did not found yet The influence of El-Nino should be for the Siberian region, but the evident correlation between the temperature, precipitation and this event on the basis of the one hundred series of the meteorological measurements did not found yet
 The temperature of the Barents Sea upper layer decreased approximately to one degree (results based on the measurements on the Kolsky meridian cross-section) The influence of El-Nino should be for the Siberian region, but the evident correlation between the temperature, precipitation and this event on the basis of the one hundred series of the meteorological measurements did not found yet The influence of El-Nino should be for the Siberian region, but the evident correlation between the temperature, precipitation and this event on the basis of the one hundred series of the meteorological measurements did not found yet")
15
Analysis of the North & tropical Pacific SST Data sources: ECMRWF SST dataset 1981-1999 NCEP/NCAR SST dataset 1948-2002 Methods: Empirical Orthogonal Function (EOF) Analysis (classical variant without ortogonalization) Cluster Analysis (spatial & temporal classification of zones with high correlation
 Analysis (classical variant without ortogonalization) Cluster Analysis (spatial & temporal classification of zones with high correlation")
16
The first four EOF

17
Climatically averaged state, the first EOF & temporal behavior

18
Reconstruction of the anomalies field during La-Nina & El-Nino events (complete set of functions)
")
19
Reconstruction of the SST field anomalies with the use of first four EOF

20
Reconstruction of the SST in September 1984

21
Cluster analysis of SST for the period 1948-2002 (V.Efimov et al.,1995) Cluster analysis is a method of combining of the data by the criterion correlation between the spatial points or the time points. Cluster analysis method allows one to solve the problems: To classify the objects with taking into account the main features of the objects; To check some hypothesis about occurrence of some structure in the aggregate of the objects; Construction of the new classification for the poor investigated events, when it is necessary to establish the relations in the aggregate and to introduce some structure into it.

22
Two initial classes & temporal behavior

23
Ten spatial classification classes & temporal behavior

24
Temporal behavior & spectrum for the classes 7, 8

25
Six classes of the temporal classification

26
El-Nino modelling on the basis of the North Pacific circulation model

27
Main features of the North Pacific circulation experiment Mathematical model is based on the complete “primitive” nonlinear equations of the thermo-hydrodynamics of the ocean; The numerical technique is based on a combination of the finite element and splitting methods; The wind-stress & temperature, salinity fluxes at the surface was taken from ECMRWF reanalysis; Integration period starts from November 1981 until October 1988 (contains el-Nino 1982, 1986 & La-Nina 1988)
")
28
El-Nino 1982 & La-Nina 1988, model (upper), ECMRWF data (low)
, ECMRWF data (low)")
29
The first four EOF for the modeling results

30
ENSO predictability A hierarchy of ENSO predictions models has been developed, ranging from the statistical forecast models to fully coupled ocean- atmosphere models. Mathematical models gives sufficiently real picture of the oscillations in the Tropical Pacific and its influence to the atmospheric circulation, but can skillfully predict strong equatorial SST anomalies (catastrophical El-Nino) at lead times not more then six or twelve months. This forecast needs preliminary the initialization of the models with the use of previous information about ocean–atmosphere state. Possible reasons: ENSO irregularity “Deterministic chaos” – nonlinear interaction of the ENSO with annual cycle; “Weather noise” – nonlinear interaction of the ENSO low-frequency and high frequency weathr variations; Changing background state – nonlinear interaction between the ENSO and basic state of the climatic system (for ex. – mean depth of the thermocline)
 at lead times not more then six or twelve months. This forecast needs preliminary the initialization of the models with the use of previous information about ocean–atmosphere state. Possible reasons: ENSO irregularity Deterministic chaos – nonlinear interaction of the ENSO with annual cycle; Weather noise – nonlinear interaction of the ENSO low-frequency and high frequency weathr variations; Changing background state – nonlinear interaction between the ENSO and basic state of the climatic system (for ex. – mean depth of the thermocline).")
31
Conclusion The Pacific Ocean is the source of the climatic variability influencing to the atmospheric processes not only in local, but also in global scales. The mostly strong signal is the El-Nino- South Oscillation (ENSO) representing the inter-annual variability in tropics. Mathematical models gives sufficiently real picture of the oscillations in the Tropical Pacific and its influence to the atmospheric circulation, but can skillfully predict equatorial SST anomalies at lead times not more then six or twelve months. Mathematical models gives sufficiently real picture of the oscillations in the Tropical Pacific and its influence to the atmospheric circulation, but can skillfully predict equatorial SST anomalies at lead times not more then six or twelve months.
 representing the inter-annual variability in tropics. Mathematical models gives sufficiently real picture of the oscillations in the Tropical Pacific and its influence to the atmospheric circulation, but can skillfully predict equatorial SST anomalies at lead times not more then six or twelve months. Mathematical models gives sufficiently real picture of the oscillations in the Tropical Pacific and its influence to the atmospheric circulation, but can skillfully predict equatorial SST anomalies at lead times not more then six or twelve months..")
32
The EOF analysis enables us to separate the strongest signal in the Pacific Ocean and to reconstruct it with a few first harmonics. The periods between the El-Nino and the La-Nina events need a greater number of harmonics for reconstruction of the anomalies. This indicates that the state in these periods is governed by the first two climatic harmonics and finer processes form the anomalies. The spatial-temporal cluster analysis allows us to separate the typical structures if the SST variability, to indicate the inter-annual variability not only in the tropical, but in the subtropical and the subpolar regions and to establish the relations between the regions. It also allows us to indicate the marked signal of the inter-decadal variability in the subpolar-subtropical zones.

Similar presentations


![El Niño Southern Oscillation [ENSO] NORMAL: - Easterly trade winds between ± 30° latitude (Coriolis Force) - Sea Surface Height slant to west - Warm basin.](/15/4529057/big_thumb.jpg "El Niño Southern Oscillation [ENSO] NORMAL: - Easterly trade winds between ± 30° latitude (Coriolis Force) - Sea Surface Height slant to west - Warm basin.>")


 Ocean-atmosphere interactions.>")


 - El Nino (ocean) - change in equatorial Pacific circulation - produces global climate.>")


