Download presentation
Presentation is loading. Please wait.

1
Worthington Teacher Evaluation System 2013-2014 Dr. Trent Bowers

3
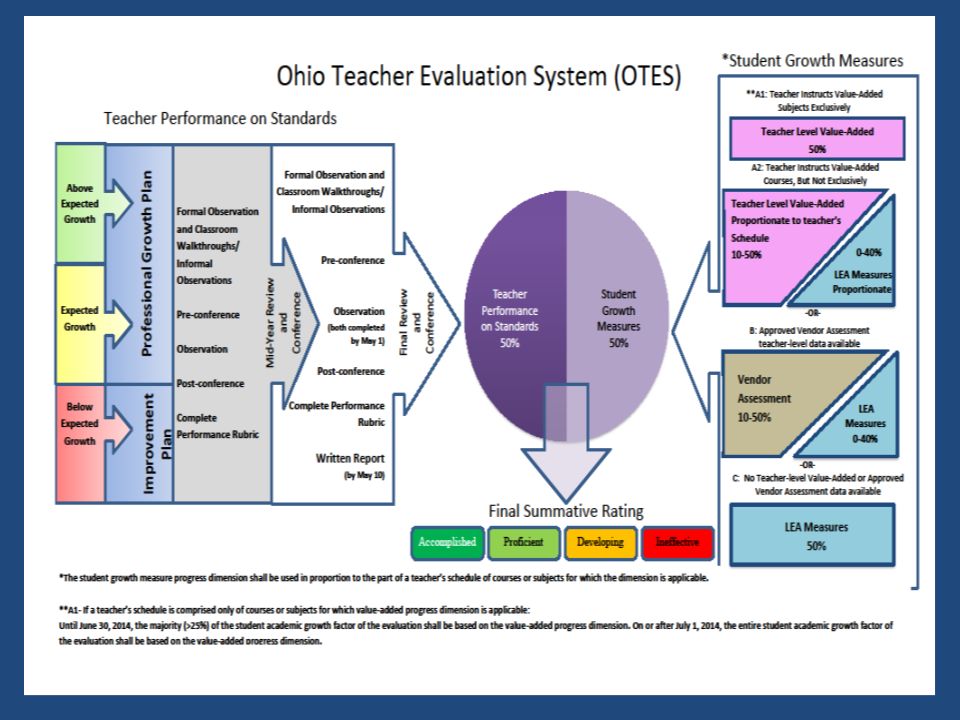
Teacher Performance on Standards Evidence of Teacher Performance Pre and Post Conferences Informal Observations (Walkthroughs) Formal Observations Holistic Rating - Accomplished, Proficient, Developing, or Ineffective
 Formal Observations Holistic Rating - Accomplished, Proficient, Developing, or Ineffective")
4
Student Growth Measures Value Added Data – 25% in 2013, 50% in 2014 (HB 555) MAP NWEA Data – 10% Student Learning Objectives – 35 – 50% Above Expected Growth, At Expected Growth, Below Expected Growth
 MAP NWEA Data – 10% Student Learning Objectives – 35 – 50% Above Expected Growth, At Expected Growth, Below Expected Growth")
5
Student Growth Examples Example #1: A sixth-grade math teacher in Category A1 only teaches sixth grade math, and will eventually use only Value-Added as her student growth measure component. In 2013-14, her Value-Added report must be at least 25% of the student growth measure component. An SLO will be 25%. In 2014-15, the Value-Added report would represent the entire 50% of the student growth measure component. Example #2: A fourth-grade teacher in a self-contained classroom teaches all four Core subjects and is in Category A2: The Value-Added composite report (which includes math and reading) would represent 25%. The remaining 25% would be an SLO for 25%. Example #3: A seventh-grade social studies teacher teaches four periods of history and one period of economics. Worthington uses an assessment that is on the Approved Vendor list for history so this teacher would be in Category B. Worthington determined that Category B teachers will use Approved Vendor Assessments (MAP NWEA) for 10% and SLO for40% Example #4: A high school music teacher without Value-Added or Approved Vendor Assessment data would be in Category C, and will utilize relevant Student Learning Objectives (SLOs) as Worthington measures: This music teacher will develop SLOs for 50% of the student growth component.
 would represent 25%. The remaining 25% would be an SLO for 25%. Example #3: A seventh-grade social studies teacher teaches four periods of history and one period of economics. Worthington uses an assessment that is on the Approved Vendor list for history so this teacher would be in Category B. Worthington determined that Category B teachers will use Approved Vendor Assessments (MAP NWEA) for 10% and SLO for40% Example #4: A high school music teacher without Value-Added or Approved Vendor Assessment data would be in Category C, and will utilize relevant Student Learning Objectives (SLOs) as Worthington measures: This music teacher will develop SLOs for 50% of the student growth component..")
6
Final Teacher Rating

7
Putting the Pieces Together

Similar presentations