Download presentation
Presentation is loading. Please wait.

1
“Comparison of model data based ENSO composites and the actual prediction by these models for winter 2015/16.” Model composites (method etc) 6 slides Comparison real time forecast to those composites
 6 slides Comparison real time forecast to those composites")
2
ENSO Precipitation and Temperature Forecasts in the NMME: Composite Analysis and Verification Li-Chuan Chen 1,2, Huug van den Dool 2, Emily Becker 2, and Qin Zhang 2 1. ESSIC/CICS-MD, University of Maryland, College Park 2. Climate Prediction Center/NCEP/NOAA 2

3
ENSO Composites The composite analysis is conducted using the 1982- 2010 hindcasts from the CFSv2, CanCM3, CanCM4, FLOR, GEOS5, and CCSM4 models. Composite years are selected based on the historical Ocean Nino Index (ONI). If the seasonal ONI just prior to the date the forecasts were initiated indicates a warm or cold ENSO episode, the forecasts are selected for the composite analysis. Lead=+1 month only. The composites apply to monthly mean conditions in November, December, January, February, and March, respectively, as well as to the five-month aggregates (NDJFM) resembling the winter conditions. 3
. If the seasonal ONI just prior to the date the forecasts were initiated indicates a warm or cold ENSO episode, the forecasts are selected for the composite analysis. Lead=+1 month only. The composites apply to monthly mean conditions in November, December, January, February, and March, respectively, as well as to the five-month aggregates (NDJFM) resembling the winter conditions. 3.")
4
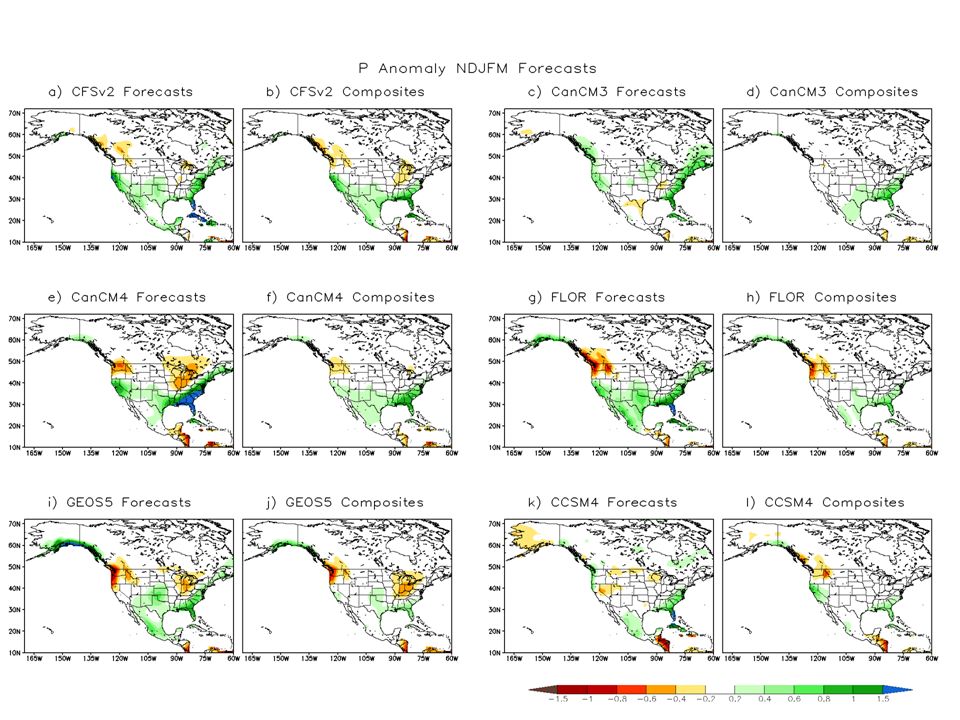
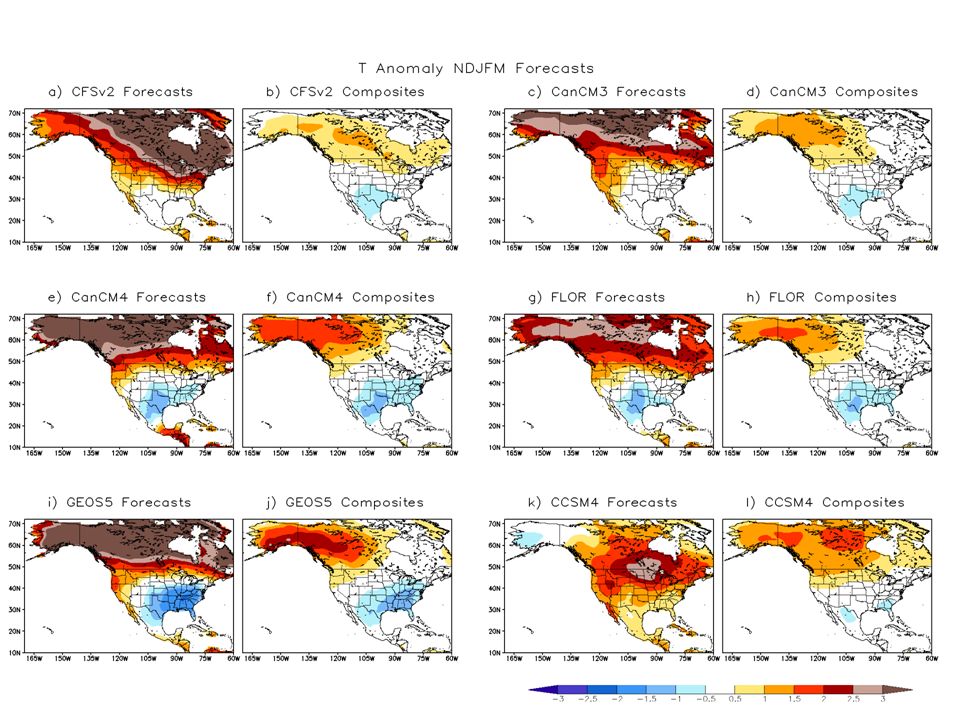
Anomaly Composites (physical units) For each model, monthly ensemble P and T forecasts are first computed by the equally weighted mean of all member forecasts. The P (or T) anomalies for a given start and lead times are then calculated by the differences between the ensemble P (or T) forecasts and the lead-specific model climatology derived from the hindcast average of all members excluding the forecast year. The P (or T) composites for the El Nino and La Nina events are simply the average of the ensemble P (or T) anomaly maps of selected years. The NMME composites are the equally weighted mean of the six models’ composites. 4
 anomalies for a given start and lead times are then calculated by the differences between the ensemble P (or T) forecasts and the lead-specific model climatology derived from the hindcast average of all members excluding the forecast year. The P (or T) composites for the El Nino and La Nina events are simply the average of the ensemble P (or T) anomaly maps of selected years. The NMME composites are the equally weighted mean of the six models’ composites. 4.")
5
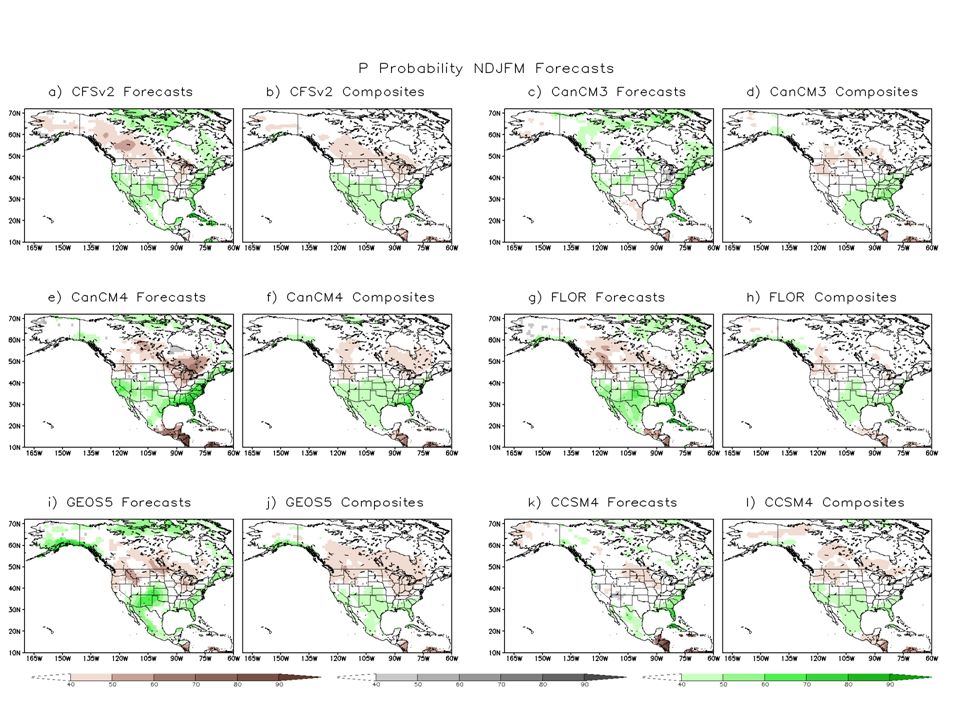
Probability Composites For each model, P (or T) forecasts for a given start and lead times are classified into three categories (A, N, B) based on the terciles derived from the hindcasts of all members excluding the forecast year. The classification applies to each individual member forecast, and the number of ensemble members that fell into the three categories under the El Nino and La Nina conditions are counted for the selected ENSO years. The probability of occurrence for each category under the warm (or cold) ENSO condition is then calculated by dividing the total number of counts by the product of the number of the selected ENSO years and the number of ensemble members. The NMME composite is the combination of all six models by adding all counts in each category from the six models together. The NDJFM composite is the combination of all five winter months. 5
 ENSO condition is then calculated by dividing the total number of counts by the product of the number of the selected ENSO years and the number of ensemble members. The NMME composite is the combination of all six models by adding all counts in each category from the six models together. The NDJFM composite is the combination of all five winter months. 5.")
6
Selected ENSO years used in the model composites (1982- 2010) 6 MonthNovDecJanFebMar ENSOWarmColdWarmColdWarmColdWarmColdWarmCold Years 198219851982198319821983 198419831984 1986198819861985198619841987198519871985 198719981987198819871988 198919881989 1991199919911995199119951992199619921996 1997200019941998199419981995199919951999 2002200719971999199719991998200019982000 2004201020022000200220002003200120032001 2009 20042007200420072005200620052006 2010200620102007200820072008 2009 2010200920102009 Total No. of years 87109 9

7
Summary NMME predicts ENSO P patterns well during wintertime. All models are reasonably good. This result gives us confidence in NMME P forecasts during an ENSO episode and models’ ability in simulating teleconnections. There are some discrepancies between the NMME and observed composites for T forecasts. The differences are mainly contributed by the GEOS5, CanCM4, and FLOR models. For both P and T composites, predictive skill under ENSO conditions is greater for NMME, as well as NDJFM. February tends to has higher skill than other winter months. For anomaly composites, most models have better skill in predicting El Nino patterns than La Nina patterns. For probability composites, all models have better skill in predicting P patterns than T patterns. The verification of model-based ENSO composites, although based on 1982-2010 hindcast data, fares better against observed ENSO composites if the latter are based on as many years as possible. 7

8
Now, as to the question of the day: Is the forecast for winter 2015/16 any different from the El Nino composite by the same model (or NMME collectively)? Knee-jurk reaction CPC forecasters Sample size (one case, but many realization in model world) Do models see any difference between El Ninos Flavors of El Nino, strength of El Nino (even if pattern is canonical) Other factors, specific to one case (here 2015/16), like SST other oceans, land surface The role of global change Note: No observations involved in the question
 Do models see any difference between El Ninos Flavors of El Nino, strength of El Nino (even if pattern is canonical) Other factors, specific to one case (here 2015/16), like SST other oceans, land surface The role of global change Note: No observations involved in the question.")
10
With seasonality

11
Precipitation Most models have a 2015/16 forecast similar to their own composite except NE Canada. Some models have a stronger response in 15/16. A few models have departures. Seasonality (February strongest) similar.
 similar..")
13
With seasonality

14
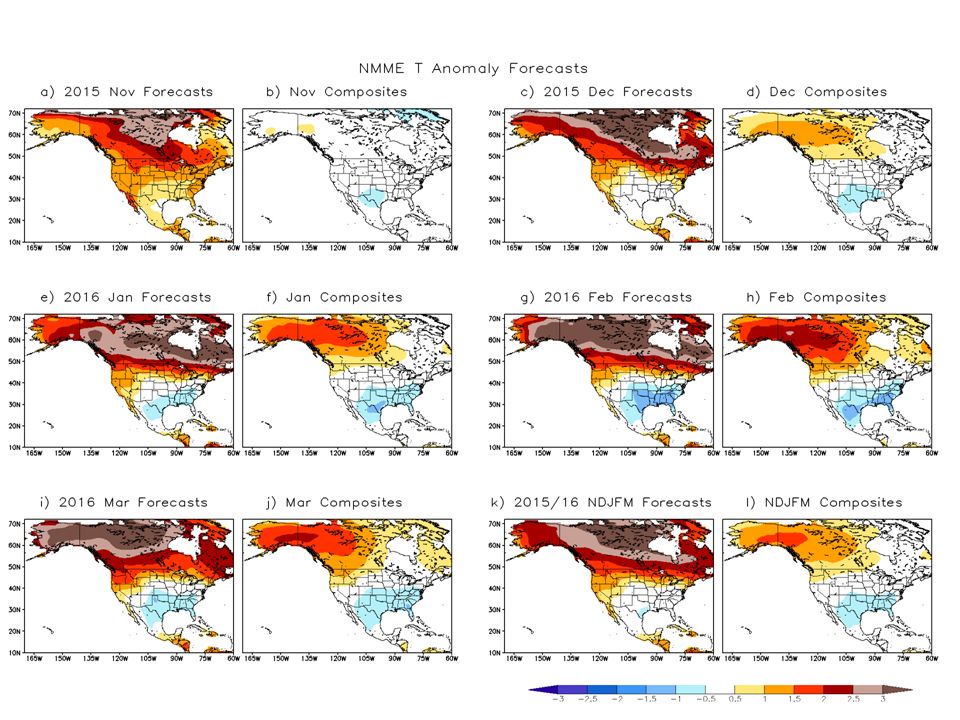
Temperature Composites and 2015/16 not very similar. Pattern the same?, add a uniform +ve constant?? (Without proof) global warming plays a major role in these discrepancies for T. (Taking a warming trend out before one does a composite, and sticking the trend (valid in real time) back into the composite for a RT forecast in an ENSO year would be necessary, but a major challenge if we lived in the model world. And even more difficult in our world of single realizations.)
 global warming plays a major role in these discrepancies for T. (Taking a warming trend out before one does a composite, and sticking the trend (valid in real time) back into the composite for a RT forecast in an ENSO year would be necessary, but a major challenge if we lived in the model world. And even more difficult in our world of single realizations.).")
15
Extra

17
With seasonality

Similar presentations


 Climate, CO2, MSU, OCN-updates, ENSO forecast (many tools) Soil Moisture, CA-SST Why –ve.>")
 (Revised: May 26, 2012) This product is published by the Oregon Department of Agriculture (ODA), in cooperation.>")
 CPC/NCEP/NOAA Jan 2011.>")
 is an index derived from North Pacific sea surface temperature anomalies and it has a high correlation to.>")


>")

 Winter Weather Forecast Conference OMSI / Oregon Chapter of the AMS 29 October 2011 Winter Weather Forecast Conference OMSI.>")


